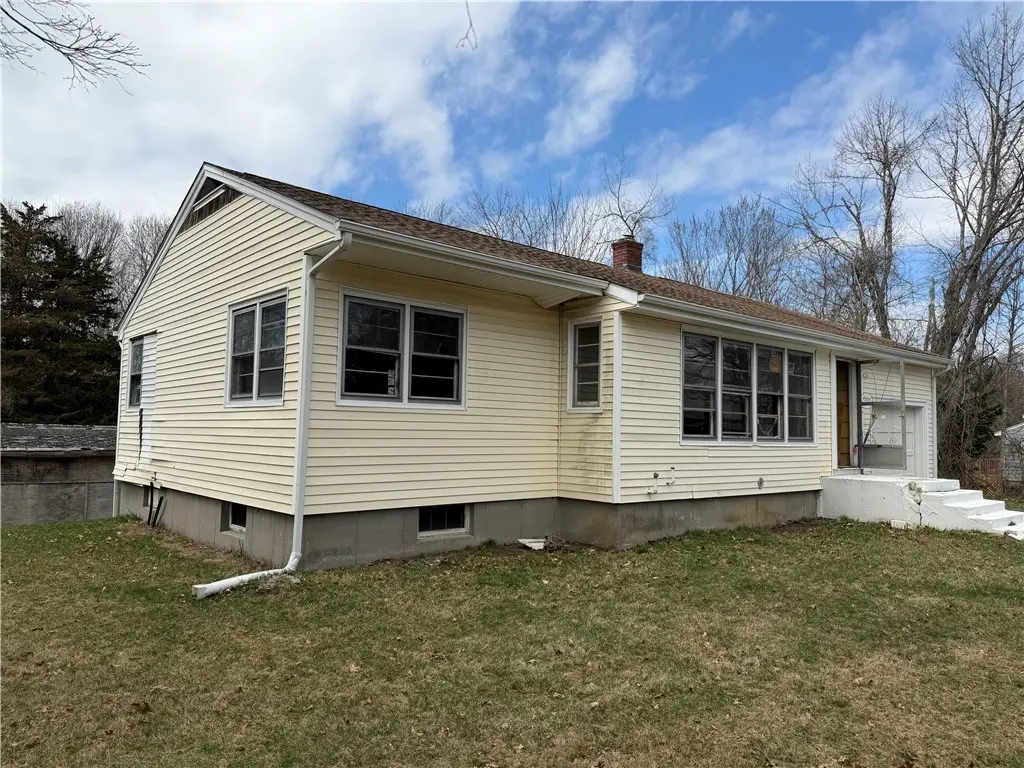
21 Nichols Ln · Westerly, RI
Flood risk No data
- FEMA flood zone
- —
- Chance of flooding over 30 yrs
- —
- Est. flood insurance / yr
- —
Fire risk No data
- Est. fire insurance / yr
- —
Heat risk No data
- Hot days now (above threshold)
- —
- Hot days in 30 yrs
- —
Wind risk No data
- Chance of severe wind over 30 yrs
- —
Air-quality risk No data
- Unhealthy air days now
- —
- Unhealthy air days in 30 yrs
- —
Risk factors via First Street. Map © Google.
Why this score? — see what drove the D grade
The composite is a weighted blend of 9 inputs, each scored 0–100. Each bar is that input's sub-score; the figure is the points it added to the 100-point composite (weight × sub-score).
- ARV discount +15.0/15.0
- Cash flow +8.3/30.0
- Rent growth +5.0/5.0
- Livability +3.7/5.0
- Schools +2.6/10.0
- Condition / age +2.5/5.0
- DSCR +2.3/10.0
- 1% rule +1.7/10.0
- Appreciation +0.0/10.0
$289,000
🖨 Deal sheet (PDF) 📄 Offer letter ✓ Due diligence
Listing remarks MLS
Great opportunity for investors, builders, or buyers seeking to create their dream home. This 3 bedroom, 1 bathroom (with potential for a second bath) ranch home is being sold as is. This home has a new roof, gutters, and has already been fully taken down to the framing, providing a blank slate for your vision! Currently serviced by a private well, but there is a plan already arranged with the water department to connect to city water. Ideally located in a desirable neighborhood just minutes from downtown Westerly and approximately 15 minutes away from the beach. This transaction must be a cash deal or rehab loan.
Key facts
- Private well
- New roof
- 0.61 acre lot
Tags
Neighborhood map
What this means for you Summary
Snapshot
- This is a 1-bed/1.0-bath single-family listed at $289k.
Deal economics
- At list price, monthly cash flow is $-264 ($-3k/yr) — negative.
- To cash-flow at today's rent, offer at most $242k (16.1% below list).
- To meet the 1% rule (rent ≥ 1% of price), the offer needs to be $194k (33.0% below list).
- Recommended offer: $194k (33.0% below list) — sets the bar for 1% rule.
- Cap rate 5.2% vs local median 1.8% in Westerly — top-decile yield for the area; either an underpriced asset or a hidden risk that comps aren't pricing in. Stress-test before assuming the spread holds.
Location & tenants
- Location reads 74/100 on livability (#10 in RI, #4,529 nationally) — a middle-class / working-renter tenant base. Strengths: crime A+, housing A+, health & safety A+; Watch: cost of living D+, amenities F, commute F.
- Westerly (suburban): math 19% / reading 39% proficiency, ranked #21 of 39 in RI (top 54%) — low school quality limits family demand, transient renter base, plan for 1-2y turnover.
- Market conditions: Rents rising fast (+11.7%/yr); 114 active listings in the ZIP; 6 comparable units currently listed for rent nearby; rentals leasing fast (median 3d on market — plan ~1-2 weeks tenant-placement turnaround); solid renter incomes; 311 units permitted in Washington County in 2024 (45 in 5+ unit buildings).
Forward outlook
- Local home prices are declining (-3.0%/yr); year-one equity from $2k of loan paydown is wiped out by about $9k of value loss. Plan a longer hold.
- Washington County population projected at -14% by 2050 — secular population decline; favor cash flow + early exit over multi-decade hold.
Negotiation context
- It's been on market 39 days — a 3% lower offer ($280k) is reasonable based on typical stale-listing flexibility.
- 5 sale attempts; this cycle's ask has dropped $21k (7%) from the opening price — seller is motivated, your offer sets the floor, not the list.
- Current owner paid $225k; 28% above their basis — modest negotiation headroom, anchor on the comps not their cost.
Risks & watch-outs
- Watch-outs: built in 1955 — expect roof / HVAC / electrical / plumbing capex.
Questions for the listing agent
- What do current leases actually rent for vs. the listed asking? Can we see a recent rent roll and the last 12 months of T-12 income?
- It's been on market 39 days. Have you received any prior offers? Is the seller open to a 33% concession, seller financing, or rate buy-down credit?
- Built in 1955 — when were the roof, HVAC, electrical panel, plumbing, and water heater last replaced?
- Is there a deadline driving the sale (1031 exchange, divorce, estate, relocation)? That informs how much negotiation room exists.
- The area grade is low — what's the realistic commute time and amenity access for the typical tenant pool here? Any planned neighborhood developments (good or bad) we should know about?
- What's the average days-on-market for RENTAL listings here right now (not sales)? A rising rental-DOM trend means longer vacancies and softer asking-rent achievability than the comps imply.
- What's the recent tenant-quality profile in this submarket — average credit score on applications, eviction rate, late-payment / NSF rate, and stable-employment percentage? A property-management company in the area should have these aggregated.
- How much new for-sale + rental construction is in the pipeline within 1–3 miles? Heavy new supply typically softens prices + rents 12–24 months out; constrained supply supports both.
Investment metrics
- 1% rule
- 0.67% ✗
- Cap rate
- 5.20%
- Cash-on-cash
- -3.92%
- DSCR
- 0.83
- GRM
- 12.4
CMA / ARV
- ARV (median comp)
- $451,953
- List price
- $289,000
- Delta
- -36.06%
- Verdict
- UNDERPRICED
- Comps
- 20 within 1.0 mi
Projected returns pro-forma
-3.0% appreciation · 8.0% rent growth · sell at horizon
- IRR
- -18.1%
- Equity multiple
- 0.34×
- Total profit
- $-53,502
- Equity at exit
- $43,091
- IRR
- -3.4%
- Equity multiple
- 0.73×
- Total profit
- $-22,021
- Equity at exit
- $24,987
Cash invested: $80,920 (down + closing). Projections, not guarantees.
Landlord ↔ Tenant lean methodology
- Overall (STATE)
- 31 Tenant-Leaning
- State Rhode Island
- 31 Tenant-Leaning · D+8
- County
- — inherits STATE
- City
- — inherits STATE
ZIP-level market 02891
- Home prices YoY
- -28.2%
- Rents YoY
- 11.7%
- Active inventory
- 114
- Price-to-rent
- 12.4×
Monthly cashflow live
- Estimated rent
- $1,938 high interval (Pro) →
- Mortgage (P&I)
- −$1,516
- Tax from tax record
- −$159 /mo · $1,906/yr
- Insurance
- −$120
- HOA
- −$0
- Vacancy / Maint / Mgmt
- −$407
- Net cashflow
- $-264
Break-even live
Sensitivity live
| Price | -10% $-100 | -5% $-182 | +0% $-264 | +5% $-346 | +10% $-428 |
|---|---|---|---|---|---|
| Rent | -10% $-417 | -5% $-341 | +0% $-264 | +5% $-187 | +10% $-111 |
| Rate | -1.0pp $-118 | -0.5pp $-191 | base $-264 | +0.5pp $-339 | +1.0pp $-415 |
UW: 25.0% down · 7.5% · 30yr · 1.5% tax · 5.0% vac · 8.0% maint · 8.0% mgmt
Financing live
Cash to close
- Down payment
- $72,250
- Closing costs
- $8,670
- Reserves months
- —
- Total cash needed
- —
Loan-product check · same deal, 3 products live
Conventional
25% down · 7.5% · 30yr
- Down + closing
- —
- Monthly P&I
- —
- Monthly cashflow
- —
- DSCR
- —
- Eligible?
- —
Personal DTI + credit; lowest rate.
DSCR
20% down · 8.5% · 30yr
- Down + closing
- —
- Monthly P&I
- —
- Monthly cashflow
- —
- DSCR
- —
- Eligible?
- —
No personal income docs; deal must DSCR.
Hard money
10% down · 12.0% · 12mo
- Down + closing
- —
- Monthly P&I
- —
- Monthly cashflow
- —
- DSCR
- —
- Eligible?
- —
Short-term bridge; refi at stabilization.
Rent comps 6 comps
| Address | Beds | Baths | Sqft | Rent | $/sqft | DOM | Units | Dist |
|---|---|---|---|---|---|---|---|---|
| 13 Brandywine Dr Unit 13 Westerly, RI | 2.0 | 1.5 | 1105 | $2,200 | $1.99 | 3d | 1 | 0.39mi |
| 35 Oak St Unit 2 Westerly, RI | 1.0 | 1.0 | 728 | $1,600 | $2.20 | 3d | 1 | 1.12mi |
| 35 Oak St Unit 1 Westerly, RI | 1.0 | 1.0 | 728 | $1,700 | $2.34 | 3d | 1 | 1.12mi |
| 16 West St Unit 3 Westerly, RI | 2.0 | 1.0 | 1307 | $1,750 | $1.34 | 3d | 1 | 1.12mi |
| 33 Railroad Ave #2 Westerly, RI | 2.0 | 1.0 | 900 | $2,400 | $2.67 | 3d | 1 | 1.31mi |
| 33 Railroad Ave Unit 1 Westerly, RI | 1.0 | 1.0 | 700 | $2,200 | $3.14 | 3d | 1 | 1.31mi |
Listing history 12 events
-
2026-05-15status Pending 621-char remark
Show marketing remark (621 chars)
Great opportunity for investors, builders, or buyers seeking to create their dream home. This 3 bedroom, 1 bathroom (with potential for a second bath) ranch home is being sold as is. This home has a new roof, gutters, and has already been fully taken down to the framing, providing a blank slate for your vision! Currently serviced by a private well, but there is a plan already arranged with the water department to connect to city water. Ideally located in a desirable neighborhood just minutes from downtown Westerly and approximately 15 minutes away from the beach. This transaction must be a cash deal or rehab loan.
-
2026-05-04price $289,000 621-char remark
Show marketing remark (621 chars)
Great opportunity for investors, builders, or buyers seeking to create their dream home. This 3 bedroom, 1 bathroom (with potential for a second bath) ranch home is being sold as is. This home has a new roof, gutters, and has already been fully taken down to the framing, providing a blank slate for your vision! Currently serviced by a private well, but there is a plan already arranged with the water department to connect to city water. Ideally located in a desirable neighborhood just minutes from downtown Westerly and approximately 15 minutes away from the beach. This transaction must be a cash deal or rehab loan.
-
2026-04-04$309,900 Active 621-char remark
Show marketing remark (621 chars)
Great opportunity for investors, builders, or buyers seeking to create their dream home. This 3 bedroom, 1 bathroom (with potential for a second bath) ranch home is being sold as is. This home has a new roof, gutters, and has already been fully taken down to the framing, providing a blank slate for your vision! Currently serviced by a private well, but there is a plan already arranged with the water department to connect to city water. Ideally located in a desirable neighborhood just minutes from downtown Westerly and approximately 15 minutes away from the beach. This transaction must be a cash deal or rehab loan.
-
2026-01-13historical
-
2025-10-26$429,900 Active
-
2025-10-26historical
-
2025-10-08$475,000 Active
-
2025-10-08historical
-
2025-10-08historical
-
2025-09-05$350,000 Active
-
2025-09-05$199,000 Active
-
2022-09-02soldstatus $225,000
ⓘ Source: listings_history table (triggers on properties + properties_extension) + one-shot
backfill from property_details.listing_events for pre-trigger history.
Tax reassessment forecast RI · Partial reset (capped growth)
- Current annual tax
- $1,906 · $159/mo
- Projected year-2 tax
- $3,308 · $276/mo
- Expected delta
- +$1,402/yr (+$117/mo · 73.6%)
ⓘ Screening estimate from a state-policy table — verify with the county assessor before closing.
Nearby sold comps map
Loading sold comps map…
Walkable amenities ~0.75 mi
Loading nearby amenities…
Taxation est. · year 1
- Rental income
- $23,252
- − Mortgage interest
- −$16,188
- − Property taxes
- −$1,906
- − Insurance
- −$1,445
- − Repairs & maintenance
- −$1,860
- − Management
- −$1,860
- − Depreciation
- −$8,407
- Taxable loss
- −$8,415
- Est. tax savings @ 24.0%
- +$2,020
- After-tax cash flow
- $-1,149/yr
For passive investors: Depreciation is non-cash, so a rental often shows a tax loss while cash-flowing — sheltering income. Rental losses are passive: they offset passive income freely, and up to $25,000/yr can offset ordinary (W-2) income if you actively participate and your MAGI is under $100k (phasing out to $0 by $150k); unused losses carry forward. On sale, claimed depreciation is recaptured at up to 25%, and gains may owe capital-gains tax (a 1031 exchange can defer both). Figures are a year-1 estimate at your 24.0% rate — not tax advice; consult a CPA.
Schools (NCES district)
- District
- Westerly
- NCES district ID
- 4401170
- Math proficiency
- 19% ▼ -19.00%
- Reading proficiency
- 39% ▼ -13.00%
- Median HH income
- $60,021
- Composite
- 26.25/100
- National rank
- #7257
- State rank
- #21 of 39 in RI
Livability — Westerly
- Score
- 74/100
- State rank
- #10
- US rank
- #4529
Category grades
Schools grade is shown separately in the Schools card above.
Census & demographics
- Census place
- Westerly, RI
- County
- Washington County · 79,886 people
- City population
- 21,587
- Metro
- Providence-Warwick, RI-MA
- Population (ZIP)
- 21,587
- Household income
- $97,110
- Rent vs Own
- Severe rent burden
- 577.0
Population outlook (Washington County) Hauer SSP2
- Today (2025)
- 123,856 people
- By 2030
- 121,962 · -1.5%
- By 2040
- 115,902 · -6.4%
- By 2050
- 107,078 · -13.5%
- By 2075
- 92,575 · -25.3%
- By 2100
- 77,407 · -37.5%
Race, ethnicity, and origin ACS 2023
- Neighborhood character
- Predominantly White (90%)
- Race & ethnicity
- White 90% Two or more races 4% Hispanic / Latino 3% Asian 3%
- Common ancestry
- Lithuanian 5% Romanian 3% Slovak 3%
- Foreign-born
- 5% · Canada, China
- Languages at home
- 92% English-only · Spanish 2% Chinese 2% Other Indo-European 1%
Political lean MEDSL · Washington
- 2024 margin
- D (+15.0) · D 56.4% · R 41.4% · Other 2.3%
- 2008→2024 swing
- -24.3pp toward R · 2008: 39.3pp · 2024: 15.0pp
- All cycles
- 2024: D+15.0 2020: D+19.4 2016: D+10.0 2012: D+16.8 2008: D+39.3
Not yet ingested
- Civics
- —
Market trends
- HPI YoY
- ▼ -145.15%
- Current HPI
- 369.8844
- Rent YoY
- ▲ 11.73%
- Metro
- Providence-Warwick, RI-MA
- State GDP YoY
- ▲ 2.25%
- F500 in state
- 10
Industry mix (Fortune 500 HQ in RI)
| Industry | F500 HQs | Revenue |
|---|---|---|
| Healthcare | 1 | $373B |
|
||
| Food Distribution | 1 | $31B |
|
||
| Aerospace / Defense | 1 | $14B |
|
||
| Financial Services | 1 | $8B |
|
||
| Consumer Goods | 1 | $4B |
|
||
Price history
+28.4% since first listed12 events — show timeline
- 2026-05-15 Pending — RIS
- 2026-05-04 Price Changed $289,000 RIS
- 2026-04-04 Listed $309,900 RIS
- 2026-01-13 Listing Removed — RIS
- 2025-10-26 Listing Removed — RIS
- 2025-10-26 Listed $429,900 RIS
- 2025-10-08 Listing Removed — RIS
- 2025-10-08 Listing Removed — RIS
- 2025-10-08 Listed $475,000 RIS
- 2025-09-05 Listed $199,000 RIS
- 2025-09-05 Listed $350,000 RIS
- 2022-09-02 Sold (Public Records) $225,000 Public Records
Property tax history
-1.2%/yrLatest (2025): $1,906 · +12.6% YoY. Source: county tax records.
Cash-flow waterfall
monthlySold comps — $/sqft
last 12 mo · ≤1 miLoading sold comps…