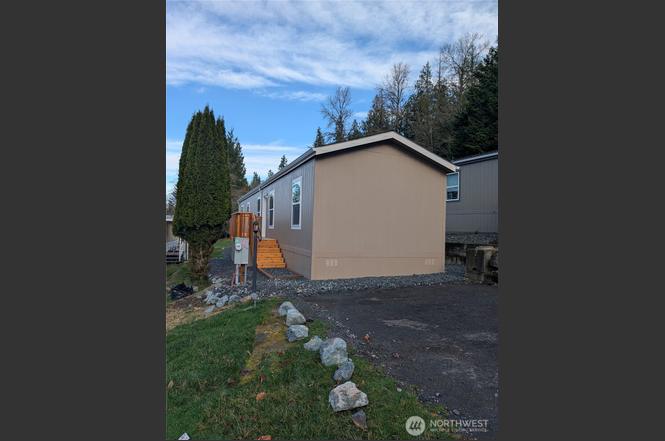
4000 Flynn St #131 · Bellingham, WA
Flood risk 7/10 · Major
- FEMA flood zone
- X (unshaded)
- Chance of flooding over 30 yrs
- 0.99%
- Est. flood insurance / yr
- $507 – $1,088
Fire risk 1/10 · Minimal
- Est. fire insurance / yr
- $604 – $1,122
Heat risk 2/10 · Minimal
- Hot days now (above 83°F)
- 7 days/yr
- Hot days in 30 yrs
- 17 days/yr
Wind risk 1/10 · Minimal
- Chance of severe wind over 30 yrs
- —
Air-quality risk 6/10 · Moderate
- Unhealthy air days now
- 10 days/yr
- Unhealthy air days in 30 yrs
- 10 days/yr
Risk factors via First Street. Map © Google.
Why this score? — see what drove the B grade
The composite is a weighted blend of 9 inputs, each scored 0–100. Each bar is that input's sub-score; the figure is the points it added to the 100-point composite (weight × sub-score).
- Cash flow +29.7/30.0
- DSCR +10.0/10.0
- ARV discount +8.8/15.0
- 1% rule +8.4/10.0
- Schools +4.8/10.0
- Livability +4.0/5.0
- Rent growth +3.3/5.0
- Condition / age +2.5/5.0
- Appreciation +0.0/10.0
$200,000
🖨 Deal sheet (PDF) 📄 Offer letter ✓ Due diligence
Listing remarks
Welcome to #131 Flynn St, this home is BRAND NEW, it features 3 beds, 2 baths, stainless appliances, it's also energy star rated for heating and appliances, front and rear new decks. Walking distance to Whatcom Falls Park, Blodel Park and Lake Whatcom, also is close to a bus route, this is an all ages park, pets are welcome with park approval, space rent is only $600/month, quiet cul-de-sac, come check it out.
Key facts
- Close to bus route
- Quiet cul-de-sac
- Stainless appliances
Tags
Property features AI
Finance
- Financial info: Listing terms: Cash or Conventional
- HOA & community: Located in Mill Wheel Park (about 155 homes); Park amenities include clubhouse and common area; Lot rent: $600/month (land lease)
Exterior
- Utilities: Water billed through lot rent; Sewer billed through lot rent; Puget Sound Energy for power
- Home design: Manufactured home (single wide); One story; Mobile home remains
- Construction: Manufactured house structure
- Exterior features: Paved lot
Interior
- Bedrooms: 3 bedrooms
- Bathrooms: 2 full bathrooms; 2 bathtubs; 2 showers
- Heating & cooling: Electric energy source
- Interior features: Has view
Neighborhood map
What this means for you Summary
Snapshot
- This is a 2-bed/1.0-bath manufactured listed at $200k.
Deal economics
- At list price, monthly cash flow is $663 ($8k/yr) — positive.
- The deal already cash-flows at list — no discount required.
- Meets the 1% rule at list price ($3k rent vs $200k).
- Recommended offer: $176k (12.0% below list) — sets the bar for market timing.
- Cap rate 10.7% vs local median 2.0% in Bellingham — top-decile yield for the area; either an underpriced asset or a hidden risk that comps aren't pricing in. Stress-test before assuming the spread holds.
Location & tenants
- Location reads 80/100 on livability (#102 in WA, #1,947 nationally) — a professional / high-income tenant draw. Strengths: amenities A+, commute A+, health & safety A+; Watch: crime F, cost of living F.
- Bellingham School District (urban): math 47% / reading 63% proficiency, ranked #106 of 291 in WA (top 36%) — acceptable for families but not a draw, mixed tenant base, ~2y average lease.
- Zoned schools: Silver Beach Elementary School (349 students, 20% FRL); Kulshan Middle School (623 students, 30% FRL); Bellingham High School (1,218 students, 34% FRL) — zoned schools at 28% FRL track the district average.
- Market conditions: Rents rising (+3.4%/yr); 275 active listings in the ZIP; 4 comparable units currently listed for rent nearby; rentals at typical pace (median 16d on market — plan ~3-4 weeks tenant-placement turnaround); solid renter incomes; 1,190 units permitted in Whatcom County in 2024 (327 in 5+ unit buildings).
- This rent runs 35% of the median local income ($91k/yr) — at the standard rent-burdened threshold; future hikes will face affordability resistance.
Forward outlook
- Local home prices are declining (-3.0%/yr); year-one equity from $1k of loan paydown is wiped out by about $6k of value loss. Plan a longer hold.
- Whatcom County population projected at +28% by 2050 — long-run rental-demand tailwind backs the buy-and-hold thesis.
- At projected returns (-3.0% appreciation + 3.4% rent growth), your $56k cash investment doubles in ~8 years — after that, you're playing with house money.
Negotiation context
- It's been on market 155 days — a 12% lower offer ($176k) is reasonable based on typical stale-listing flexibility.
Risks & watch-outs
- Watch-outs: flood insurance adds $66/mo.
- Climate carrying-cost: major flood risk — expect insurance premiums to compound above CPI over the hold.
Questions for the listing agent
- It's been on market 155 days. Have you received any prior offers? Is the seller open to a 12% concession, seller financing, or rate buy-down credit?
- What's the actual annual flood-insurance premium (NFIP or private), and is the property in a SFHA with mandatory coverage?
- Why hasn't it sold? Are there any deal-killer items the seller is aware of (foundation, flood, title, zoning, code violations)?
- Is there a deadline driving the sale (1031 exchange, divorce, estate, relocation)? That informs how much negotiation room exists.
- Schools are B-rated — typically a magnet for longer-tenancy family renters. What's the average tenant stay here, and is there a school-zone premium baked into asking?
- Crime grade is F in this area — have there been break-ins, vandalism, or insurance claims at this property in the last 3 years? What carrier currently insures it and at what premium?
- What's the average days-on-market for RENTAL listings here right now (not sales)? A rising rental-DOM trend means longer vacancies and softer asking-rent achievability than the comps imply.
- What's the recent tenant-quality profile in this submarket — average credit score on applications, eviction rate, late-payment / NSF rate, and stable-employment percentage? A property-management company in the area should have these aggregated.
- How much new for-sale + rental construction is in the pipeline within 1–3 miles? Heavy new supply typically softens prices + rents 12–24 months out; constrained supply supports both.
Investment metrics
- 1% rule
- 1.34% ✓
- Cap rate
- 10.67%
- Cash-on-cash
- 15.62%
- DSCR
- 1.70
- GRM
- 6.2
CMA / ARV
- ARV (on-the-fly)
- $205,824
- Comps found
- 1
Show comp detail 1 sale within ~0.75 mi
| Address | Dist | Beds/Ba | Sqft | Sold | Price | $/sf | Match |
|---|---|---|---|---|---|---|---|
| 4000 Flynn St #79 | 0.12mi | 2/2.0 | 1,368 (-11%) | 18mo | $183,000 | $134 | 57 |
Match score weights: distance 35% · size 25% · config 20% · recency 20%. Top-matched comps best support the ARV.
Projected returns pro-forma
-3.0% appreciation · 3.38% rent growth · sell at horizon
- IRR
- 5.0%
- Equity multiple
- 1.19×
- Total profit
- $10,894
- Equity at exit
- $29,821
- IRR
- 14.8%
- Equity multiple
- 2.22×
- Total profit
- $68,392
- Equity at exit
- $17,292
Cash invested: $56,000 (down + closing). Projections, not guarantees.
Landlord ↔ Tenant lean methodology
- Overall (STATE)
- 28 Tenant-Leaning
- State Washington
- 28 Tenant-Leaning · D+8
- County
- — inherits STATE
- City
- — inherits STATE
ZIP-level market 98229
- Rents YoY
- 3.4%
- Active inventory
- 275
- Price-to-rent
- 6.2×
Monthly cashflow live
- Estimated rent
- $2,672 medium interval (Pro) →
- Mortgage (P&I)
- −$1,049
- Tax est. 1.5%
- −$250 /mo · $3,000/yr
- Insurance
- −$83
- Flood insurance flood zone
- −$66 /mo · $798/yr
- HOA
- −$0
- Vacancy / Maint / Mgmt
- −$561
- Net cashflow
- $663
Break-even live
Sensitivity live
| Price | -10% $801 | -5% $732 | +0% $663 | +5% $593 | +10% $524 |
|---|---|---|---|---|---|
| Rent | -10% $451 | -5% $557 | +0% $663 | +5% $768 | +10% $874 |
| Rate | -1.0pp $763 | -0.5pp $713 | base $663 | +0.5pp $611 | +1.0pp $558 |
UW: 25.0% down · 7.5% · 30yr · 1.5% tax · 5.0% vac · 8.0% maint · 8.0% mgmt
Financing live
Cash to close
- Down payment
- $50,000
- Closing costs
- $6,000
- Reserves months
- —
- Total cash needed
- —
Loan-product check · same deal, 3 products live
Conventional
25% down · 7.5% · 30yr
- Down + closing
- —
- Monthly P&I
- —
- Monthly cashflow
- —
- DSCR
- —
- Eligible?
- —
Personal DTI + credit; lowest rate.
DSCR
20% down · 8.5% · 30yr
- Down + closing
- —
- Monthly P&I
- —
- Monthly cashflow
- —
- DSCR
- —
- Eligible?
- —
No personal income docs; deal must DSCR.
Hard money
10% down · 12.0% · 12mo
- Down + closing
- —
- Monthly P&I
- —
- Monthly cashflow
- —
- DSCR
- —
- Eligible?
- —
Short-term bridge; refi at stabilization.
Rent comps 4 comps
| Address | Beds | Baths | Sqft | Rent | $/sqft | DOM | Units | Dist |
|---|---|---|---|---|---|---|---|---|
| 2100 Electric Ave Bellingham, WA | 1.0–2.0 | 1.0–2.0 | 880 | $3,150 | $3.58 | 15d | 11 | 0.23mi |
| 3212 Heights Pl Bellingham, WA | 3.0 | 2.5 | 1800 | $2,900 | $1.61 | 23d | 1 | 1.17mi |
| 2251 Michigan St Bellingham, WA | 3.0 | 2.0 | 1283 | $2,300 | $1.79 | 15d | 1 | 1.18mi |
| 2139 Xenia Ln Bellingham, WA | 3.0 | 2.0 | 1064 | $2,300 | $2.16 | 15d | 1 | 1.34mi |
Listing history 1 events
-
2025-12-23$200,000 Active
ⓘ Source: listings_history table (triggers on properties + properties_extension) + one-shot
backfill from property_details.listing_events for pre-trigger history.
Climate risk First Street
- Flood 7/10 Severe FEMA zone X (unshaded) · 99% chance over 30 yrs
- Wildfire 1/10 Low
- Heat 2/10 Low 7 d/yr ≥83°F today · 17 d/yr by 30 yrs out
- Wind 1/10 Low
- Air quality 6/10 Major 10 unhealthy d/yr today · 10 by 30 yrs out
Nearby sold comps map
Loading sold comps map…
Walkable amenities ~0.75 mi
Loading nearby amenities…
Taxation est. · year 1
- Rental income
- $32,068
- − Mortgage interest
- −$11,203
- − Property taxes
- −$3,000
- − Insurance
- −$1,798
- − Repairs & maintenance
- −$2,565
- − Management
- −$2,565
- − Depreciation
- −$5,818
- Taxable income
- $5,118
- Est. tax owed @ 24.0%
- −$1,228
- After-tax cash flow
- $6,722/yr
For passive investors: Depreciation is non-cash, so a rental often shows a tax loss while cash-flowing — sheltering income. Rental losses are passive: they offset passive income freely, and up to $25,000/yr can offset ordinary (W-2) income if you actively participate and your MAGI is under $100k (phasing out to $0 by $150k); unused losses carry forward. On sale, claimed depreciation is recaptured at up to 25%, and gains may owe capital-gains tax (a 1031 exchange can defer both). Figures are a year-1 estimate at your 24.0% rate — not tax advice; consult a CPA.
Schools (NCES district)
- District
- Bellingham School District
- NCES district ID
- 5300420
- Math proficiency
- 47% ▼ -6.00%
- Reading proficiency
- 63% ▼ -1.00%
- Median HH income
- $47,678
- Composite
- 48.49/100
- National rank
- #4632
- State rank
- #106 of 291 in WA
Livability — Bellingham
- Score
- 80/100
- State rank
- #102
- US rank
- #1947
Category grades
Schools grade is shown separately in the Schools card above.
Census & demographics
- Census place
- Bellingham, WA
- County
- Whatcom County · 209,776 people
- City population
- 130,296
- Metro
- Bellingham, WA
- Population (ZIP)
- 33,298
- Household income
- $90,945
- Rent vs Own
- Severe rent burden
- 1040.0
Population outlook (Whatcom County) Hauer SSP2
- Today (2025)
- 240,408 people
- By 2030
- 254,667 · +5.9%
- By 2040
- 281,365 · +17.0%
- By 2050
- 307,592 · +27.9%
- By 2075
- 375,576 · +56.2%
- By 2100
- 421,637 · +75.4%
Race, ethnicity, and origin ACS 2023
- Neighborhood character
- Predominantly White (77%)
- Race & ethnicity
- White 77% Two or more races 13% Hispanic / Latino 10% Asian 3%
- Hispanic origin (detail)
- Mexican 8%
- Common ancestry
- Portuguese 6% Italian 4% Slovak 4%
- Foreign-born
- 8% · Canada, China, Vietnam
- Languages at home
- 88% English-only · Spanish 7% Chinese 1% German/W. Germanic 1%
Political lean MEDSL · Whatcom
- 2024 margin
- Strong D (+24.9) · D 60.8% · R 35.9% · Other 3.3%
- 2008→2024 swing
- +6.9pp toward D · 2008: 18.0pp · 2024: 24.9pp
- All cycles
- 2024: D+24.9 2020: D+23.9 2016: D+17.7 2012: D+12.1 2008: D+18.0
Not yet ingested
- Civics
- —
Market trends
- HPI YoY
- ▼ -652.00%
- Current HPI
- 413.1478
- Rent YoY
- ▲ 3.38%
- Metro
- Bellingham, WA
- State GDP YoY
- ▲ 4.65%
- F500 in state
- 22
Industry mix (Fortune 500 HQ in WA)
| Industry | F500 HQs | Revenue |
|---|---|---|
| Retail | 2 | $269B |
|
||
| Technology / Retail | 1 | $638B |
|
||
| Technology | 1 | $245B |
|
||
| Telecommunications | 1 | $38B |
|
||
| Food / Beverage | 1 | $36B |
|
||
| Automotive / Trucks | 1 | $34B |
|
||
Price history
1 event — show timeline
- 2025-12-23 Listed $200,000 NWMLS as Distributed by MLS Grid
Property tax history
+0.3%/yrLatest (2024): $224 · -8.0% YoY. Source: county tax records.
Cash-flow waterfall
monthlySold comps — $/sqft
last 12 mo · ≤1 miLoading sold comps…