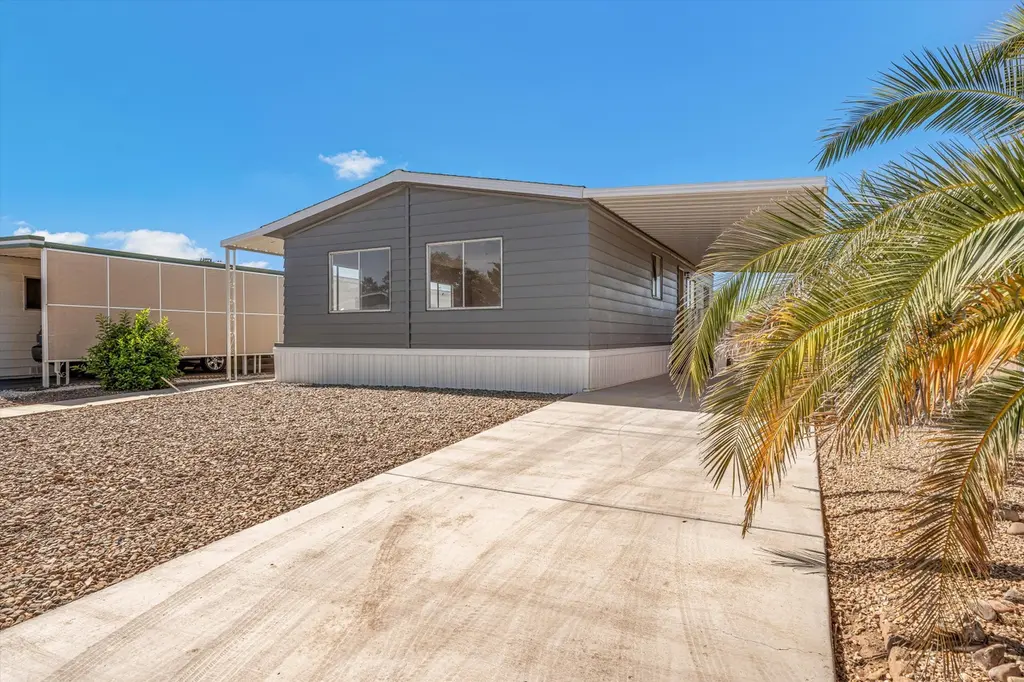
1302 W Ajo Way #132 · Tucson, AZ
Flood risk 1/10 · Minimal
- FEMA flood zone
- X (unshaded)
- Chance of flooding over 30 yrs
- 0.0%
- Est. flood insurance / yr
- $507 – $1,088
Fire risk 10/10 · Severe
- Est. fire insurance / yr
- $610 – $1,132
Heat risk 8/10 · Major
- Hot days now (above 106°F)
- 7 days/yr
- Hot days in 30 yrs
- 18 days/yr
Wind risk 1/10 · Minimal
- Chance of severe wind over 30 yrs
- —
Air-quality risk 1/10 · Minimal
- Unhealthy air days now
- 0 days/yr
- Unhealthy air days in 30 yrs
- 0 days/yr
Risk factors via First Street. Map © Google.
Why this score? — see what drove the D grade
The composite is a weighted blend of 9 inputs, each scored 0–100. Each bar is that input's sub-score; the figure is the points it added to the 100-point composite (weight × sub-score).
- ARV discount +15.0/15.0
- 1% rule +9.3/10.0
- Condition / age +5.0/5.0
- Cash flow +3.8/30.0
- Livability +3.7/5.0
- Rent growth +2.6/5.0
- Schools +1.6/10.0
- DSCR +0.0/10.0
- Appreciation +0.0/10.0
$92,500
🖨 Deal sheet (PDF) 📄 Offer letter ✓ Due diligence
Listing remarks MLS
* ALSO AVAILABLE FOR RENT: $1,450/MO * Welcome to Lot 132, a spacious 2 Bed 2 Bath home in Desert Pueblo Estates, a 55+ Community! This home is brand new inside with top of the line fixtures, brand new appliances, butcher block counter tops, new AC Unit, new counter tops, new flooring and carpet, a large patio and covered parking, new toilets, and much more! Located in a quiet portion of the park near the second clubhouse, this home gives you easy access to a pool and spa, gym, billiards room, and garden! This one won't last, schedule your tour today! If you are over the age of 40, please reach out for more information.
Key facts
- Brand new inside
- New ac unit
- Brand new appliances
Tags
Neighborhood map
What this means for you Summary
Snapshot
- This is a 2-bed/2.0-bath manufactured listed at $92k. Condition is rated excellent.
Deal economics
- At list price, monthly cash flow is $-266 ($-3k/yr) — negative.
- To cash-flow at today's rent, offer at most $54k (41.7% below list).
- Meets the 1% rule at list price ($1k rent vs $92k).
- Recommended offer: $54k (41.7% below list) — sets the bar for cash-flow.
- Cap rate 2.8% vs local median 3.7% in Tucson — below-typical yield; the buyer is paying a premium for something (appreciation thesis, condition, location) that the cap rate doesn't capture.
Location & tenants
- Location reads 74/100 on livability (#17 in AZ, #4,502 nationally) — a middle-class / working-renter tenant base. Strengths: commute A+, cost of living A+, housing A+; Watch: health & safety C-, crime F, employment D-.
- Tucson Unified District (4403) (urban): math 14% / reading 23% proficiency, ranked #190 of 249 in AZ (top 76%) — low school quality limits family demand, transient renter base, plan for 1-2y turnover.
- Zoned schools: Gale Elementary School (math 32% / reading 42%, grade F, #438 of 1,109 statewide, top 41%, 335 students, 54% FRL); Valencia Middle School (math 3% / reading 11%, grade F, #210 of 218 statewide, top 97%, 722 students, 79% FRL); Cholla High School (math 2% / reading 17%, grade F, #343 of 381 statewide, top 93%, 1,760 students, 62% FRL).
- Market conditions: Rents flat; 267 active listings in the ZIP; 23 comparable units currently listed for rent nearby; rentals at typical pace (median 26d on market — plan ~3-4 weeks tenant-placement turnaround); 5,268 units permitted in Pima County in 2024 (996 in 5+ unit buildings).
Forward outlook
- Local home prices are declining (-3.0%/yr); year-one equity from $640 of loan paydown is wiped out by about $3k of value loss. Plan a longer hold.
- Pima County population projected at +8% by 2050 — modest demand growth; plan on rents tracking national, not racing it.
Negotiation context
- It's been on market 82 days — a 6% lower offer ($87k) is reasonable based on typical stale-listing flexibility.
Risks & watch-outs
- Watch-outs: HOA is 51% of rent.
- Climate carrying-cost: severe wildfire risk; extreme-heat days projected 7→18/yr by 2055 (HVAC capex compounding) — expect insurance premiums to compound above CPI over the hold.
Questions for the listing agent
- What do current leases actually rent for vs. the listed asking? Can we see a recent rent roll and the last 12 months of T-12 income?
- It's been on market 82 days. Have you received any prior offers? Is the seller open to a 42% concession, seller financing, or rate buy-down credit?
- What does the HOA fee cover, when was the last increase, and are there any pending special assessments or reserve-fund shortfalls?
- Why hasn't it sold? Are there any deal-killer items the seller is aware of (foundation, flood, title, zoning, code violations)?
- Is there a deadline driving the sale (1031 exchange, divorce, estate, relocation)? That informs how much negotiation room exists.
- Schools are D-rated, which usually means shorter tenancies and higher turnover. Who's the typical renter profile here, and what's been the actual vacancy rate?
- Crime grade is F in this area — have there been break-ins, vandalism, or insurance claims at this property in the last 3 years? What carrier currently insures it and at what premium?
- The area grade is low — what's the realistic commute time and amenity access for the typical tenant pool here? Any planned neighborhood developments (good or bad) we should know about?
- What's the average days-on-market for RENTAL listings here right now (not sales)? A rising rental-DOM trend means longer vacancies and softer asking-rent achievability than the comps imply.
- What's the recent tenant-quality profile in this submarket — average credit score on applications, eviction rate, late-payment / NSF rate, and stable-employment percentage? A property-management company in the area should have these aggregated.
- How much new for-sale + rental construction is in the pipeline within 1–3 miles? Heavy new supply typically softens prices + rents 12–24 months out; constrained supply supports both.
Investment metrics
- 1% rule
- 1.43% ✓
- Cap rate
- 2.84%
- Cash-on-cash
- -12.34%
- DSCR
- 0.45
- GRM
- 5.8
CMA / ARV
- ARV (median comp)
- $114,661
- List price
- $92,500
- Delta
- -19.33%
- Verdict
- UNDERPRICED
- Comps
- 3 within 1.0 mi
Show comp detail 3 sales within ~0.75 mi
| Address | Dist | Beds/Ba | Sqft | Sold | Price | $/sf | Match |
|---|---|---|---|---|---|---|---|
| 2640 S Cottonwood Ln #106 | 0.60mi | 3/3.0 (+1) | 1,188 (+3%) | 4mo | $76,200 | $64 | 54 |
| 2640 S Cottonwood Ln #71 | 0.60mi | 3/2.0 (+1) | 1,238 (+8%) | 20mo | $122,795 | $99 | 38 |
| 2640 S Cottonwood Ln #94 | 0.60mi | 3/2.0 (+1) | 1,248 (+8%) | 23mo | $152,500 | $122 | 34 |
Match score weights: distance 35% · size 25% · config 20% · recency 20%. Top-matched comps best support the ARV.
Projected returns pro-forma
-3.0% appreciation · 0.21% rent growth · sell at horizon
- IRR
- -47.1%
- Equity multiple
- -0.36×
- Total profit
- $-35,145
- Equity at exit
- $13,792
- IRR
- —
- Equity multiple
- -1.50×
- Total profit
- $-64,744
- Equity at exit
- $7,998
Cash invested: $25,900 (down + closing). Projections, not guarantees.
Landlord ↔ Tenant lean methodology
- Overall (STATE)
- 87 Strongly Landlord-Friendly
- State Arizona
- 87 Strongly Landlord-Friendly · R+3
- County
- — inherits STATE
- City
- — inherits STATE
ZIP-level market 85713
- Home prices YoY
- -24.5%
- Rents YoY
- 0.2%
- Active inventory
- 267
- Price-to-rent
- 5.8×
Monthly cashflow live
- Estimated rent
- $1,326 high interval (Pro) →
- Mortgage (P&I)
- −$485
- Tax est. 1.5%
- −$116 /mo · $1,388/yr
- Insurance
- −$39
- HOA
- −$675
- Vacancy / Maint / Mgmt
- −$279
- Net cashflow
- $-266
Break-even live
Sensitivity live
| Price | -10% $-202 | -5% $-234 | +0% $-266 | +5% $-298 | +10% $-330 |
|---|---|---|---|---|---|
| Rent | -10% $-371 | -5% $-319 | +0% $-266 | +5% $-214 | +10% $-162 |
| Rate | -1.0pp $-220 | -0.5pp $-243 | base $-266 | +0.5pp $-290 | +1.0pp $-315 |
UW: 25.0% down · 7.5% · 30yr · 1.5% tax · 5.0% vac · 8.0% maint · 8.0% mgmt
Financing live
Cash to close
- Down payment
- $23,125
- Closing costs
- $2,775
- Reserves months
- —
- Total cash needed
- —
Loan-product check · same deal, 3 products live
Conventional
25% down · 7.5% · 30yr
- Down + closing
- —
- Monthly P&I
- —
- Monthly cashflow
- —
- DSCR
- —
- Eligible?
- —
Personal DTI + credit; lowest rate.
DSCR
20% down · 8.5% · 30yr
- Down + closing
- —
- Monthly P&I
- —
- Monthly cashflow
- —
- DSCR
- —
- Eligible?
- —
No personal income docs; deal must DSCR.
Hard money
10% down · 12.0% · 12mo
- Down + closing
- —
- Monthly P&I
- —
- Monthly cashflow
- —
- DSCR
- —
- Eligible?
- —
Short-term bridge; refi at stabilization.
Rent comps 23 comps
| Address | Beds | Baths | Sqft | Rent | $/sqft | DOM | Units | Dist |
|---|---|---|---|---|---|---|---|---|
| 1502 W Ajo Way Tucson, AZ | 1.0–2.0 | 1.0 | 713 | $844 | $1.18 | 5d | 4 | 0.32mi |
| 3655 S San Rafael Pl Tucson, AZ | 3.0 | 1.0 | 1204 | $1,650 | $1.37 | 45d | 1 | 0.44mi |
| 2800 S Mission Rd Tucson, AZ | 3.0 | 1.0–2.0 | 663 | $1,252 | $1.89 | 3d | 23 | 0.59mi |
| 2640 S Cottonwood Ln Unit 13 Tucson, AZ | 3.0 | 2.0 | 1200 | $1,395 | $1.16 | 45d | 1 | 0.62mi |
| 2410 S Mission Rd Tucson, AZ | 3.0 | 1.0–2.0 | 620 | $1,175 | $1.90 | 45d | 10 | 0.81mi |
| 1808 W Caravelle Rd Tucson, AZ | 2.0 | 2.0 | 1260 | $1,395 | $1.11 | 45d | 1 | 0.81mi |
| 3601 S 16th Ave Tucson, AZ | 2.0 | 1.0 | 523 | $1,025 | $1.96 | 45d | 1 | 0.83mi |
| 3619 S 14th Ave Tucson, AZ | 2.0 | 1.0 | 869 | $1,410 | $1.62 | 45d | 1 | 0.92mi |
| 673 W 41st St #1 Tucson, AZ | 2.0 | 1.0 | 700 | $1,000 | $1.43 | 25d | 1 | 0.95mi |
| 1975 W 36th St Tucson, AZ | 1.0–2.0 | 1.0 | 667 | $1,284 | $1.92 | 5d | 1 | 1.00mi |
| 1325 W Silverlake Rd Tucson, AZ | 2.0–3.0 | 2.0 | 990 | $1,400 | $1.41 | 13d | 2 | 1.00mi |
| 3511 S 12th Ave Unit 1101 Tucson, AZ | 2.0 | 1.0 | 752 | $950 | $1.26 | 45d | 1 | 1.07mi |
| 3420 S Clark Ave Tucson, AZ | 3.0 | 2.0 | 1100 | $1,495 | $1.36 | 13d | 1 | 1.11mi |
| 416 W 44th St Unit 1 Tucson, AZ | 1.0 | 1.0 | 780 | $900 | $1.15 | 25d | 1 | 1.14mi |
| 1880 S San Antonio Dr Unit 1851SANJOSE Tucson, AZ | 2.0 | 1.0 | 850 | $1,095 | $1.29 | 23d | 1 | 1.18mi |
| 1880 S San Antonio Dr Tucson, AZ | 2.0 | 1.0 | 850 | $1,095 | $1.29 | 25d | 2 | 1.18mi |
| 1880 S San Antonio Dr Unit 1871SANJOSE Tucson, AZ | 2.0 | 1.0 | 850 | $1,050 | $1.24 | 5d | 1 | 1.18mi |
| 3450 S Liberty Ave Unit 2 Tucson, AZ | 3.0 | 2.0 | 950 | $1,475 | $1.55 | 45d | 1 | 1.23mi |
| 3917 S Liberty Ave Tucson, AZ | 3.0 | 2.0 | 1044 | $1,590 | $1.52 | 5d | 1 | 1.34mi |
| 4213 S Lundy Ave Tucson, AZ | 3.0 | 1.0 | 1368 | $1,600 | $1.17 | 25d | 1 | 1.36mi |
| 3638 S 9th Ave Tucson, AZ | 3.0 | 1.0 | 945 | $1,600 | $1.69 | 5d | 1 | 1.37mi |
| 251 W 38th St Tucson, AZ | 3.0 | 2.0 | 1050 | $1,800 | $1.71 | 16d | 1 | 1.43mi |
| 251 W 38th St Tucson, AZ | 3.0 | 2.0 | 1050 | $1,700 | $1.62 | 46d | 1 | 1.43mi |
HOA detail
- Monthly dues
- $675 · $8,100/yr
- Likely covers
- poolgym
Listing history 16 events
-
2026-06-21days on market $92,500 Active 82 DOM
-
2026-06-18days on market $92,500 Active 79 DOM
-
2026-06-17days on market $92,500 Active 78 DOM
-
2026-06-16days on market $92,500 Active 77 DOM
-
2026-06-15days on market $92,500 Active 76 DOM
-
2026-06-13days on market $92,500 Active 74 DOM
-
2026-06-10days on market $92,500 Active 71 DOM
-
2026-06-09days on market $92,500 Active 70 DOM
-
2026-06-08days on market $92,500 Active 69 DOM
-
2026-06-07days on market $92,500 Active 68 DOM
-
2026-06-05days on market $92,500 Active 65 DOM
-
2026-06-03days on market $92,500 Active 64 DOM
-
2026-06-02days on market $92,500 Active 63 DOM
-
2026-06-01days on market $92,500 Active 62 DOM
-
2026-05-31days on market $92,500 Active 61 DOM
-
2026-04-01$92,500 Active 628-char remark
Show marketing remark (628 chars)
* ALSO AVAILABLE FOR RENT: $1,450/MO * Welcome to Lot 132, a spacious 2 Bed 2 Bath home in Desert Pueblo Estates, a 55+ Community! This home is brand new inside with top of the line fixtures, brand new appliances, butcher block counter tops, new AC Unit, new counter tops, new flooring and carpet, a large patio and covered parking, new toilets, and much more! Located in a quiet portion of the park near the second clubhouse, this home gives you easy access to a pool and spa, gym, billiards room, and garden! This one won't last, schedule your tour today! If you are over the age of 40, please reach out for more information.
ⓘ Source: listings_history table (triggers on properties + properties_extension) + one-shot
backfill from property_details.listing_events for pre-trigger history.
Climate risk First Street
- Flood 1/10 Low FEMA zone X (unshaded) · 0% chance over 30 yrs
- Wildfire 10/10 Extreme
- Heat 8/10 Severe 7 d/yr ≥106°F today · 18 d/yr by 30 yrs out
- Wind 1/10 Low
- Air quality 1/10 Low 0 unhealthy d/yr today · 0 by 30 yrs out
Nearby sold comps map
Loading sold comps map…
Walkable amenities ~0.75 mi
Loading nearby amenities…
Taxation est. · year 1
- Rental income
- $15,916
- − Mortgage interest
- −$5,181
- − Property taxes
- −$1,388
- − Insurance
- −$462
- − Repairs & maintenance
- −$1,273
- − Management
- −$1,273
- − HOA
- −$8,100
- − Depreciation
- −$2,691
- Taxable loss
- −$4,453
- Est. tax savings @ 24.0%
- +$1,069
- After-tax cash flow
- $-2,128/yr
For passive investors: Depreciation is non-cash, so a rental often shows a tax loss while cash-flowing — sheltering income. Rental losses are passive: they offset passive income freely, and up to $25,000/yr can offset ordinary (W-2) income if you actively participate and your MAGI is under $100k (phasing out to $0 by $150k); unused losses carry forward. On sale, claimed depreciation is recaptured at up to 25%, and gains may owe capital-gains tax (a 1031 exchange can defer both). Figures are a year-1 estimate at your 24.0% rate — not tax advice; consult a CPA.
Condition & rehab AI · 12 photos
This brand new, move-in-ready manufactured home in Desert Pueblo Estates offers top-of-the-line features and a spacious layout, making it an excellent investment opportunity.
Value-add opportunities
- Both Landscaping and curb appeal improvements — Enhances curb appeal and adds value for both resale and rental
- Both Add a smart home system — Improves convenience and energy efficiency, attracting more buyers and renters
- Both Install a smart thermostat — Enhances comfort and energy efficiency, attracting more buyers and renters
Renovation cost estimate screening
Value-add ROI direction
- Both Landscaping and curb appeal improvements — Enhances curb appeal and adds value for both resale and rental ↑
- Both Add a smart home system — Improves convenience and energy efficiency, attracting more buyers and renters ↑
- Both Install a smart thermostat — Enhances comfort and energy efficiency, attracting more buyers and renters ↑
ⓘ Cost ranges are severity-bucket heuristics (US national rule-of-thumb). Get contractor quotes + a written scope before underwriting a rehab budget.
Schools (NCES district)
- District
- Tucson Unified District (4403)
- NCES district ID
- 0408800
- Math proficiency
- 14% ▼ -17.00%
- Reading proficiency
- 23% ▼ -11.00%
- Median HH income
- $40,962
- Composite
- 15.78/100
- National rank
- #9270
- State rank
- #190 of 249 in AZ
Livability — Tucson
- Score
- 74/100
- State rank
- #17
- US rank
- #4502
Category grades
Schools grade is shown separately in the Schools card above.
Census & demographics
- Census place
- Tucson, AZ
- County
- Pima County · 1,012,107 people
- City population
- 839,336
- Metro
- Tucson, AZ
- Population (ZIP)
- 46,439
- Household income
- $53,152
- Rent vs Own
- Severe rent burden
- 1517.0
Population outlook (Pima County) Hauer SSP2
- Today (2025)
- 1,066,056 people
- By 2030
- 1,086,684 · +1.9%
- By 2040
- 1,117,160 · +4.8%
- By 2050
- 1,149,778 · +7.9%
- By 2075
- 1,271,480 · +19.3%
- By 2100
- 1,321,160 · +23.9%
Race, ethnicity, and origin ACS 2023
- Neighborhood character
- Predominantly Hispanic (70%)
- Race & ethnicity
- Hispanic / Latino 70% Two or more races 30% White 21% Native American 5% Black 3% Asian 1%
- Hispanic origin (detail)
- Mexican 67%
- Common ancestry
- Italian 1% Lithuanian 1% Portuguese 1%
- Foreign-born
- 19% · Canada, China
- Languages at home
- 49% English-only · Spanish 49%
Political lean MEDSL · Pima
- 2024 margin
- D (+15.2) · D 57.0% · R 41.8% · Other 1.2%
- 2008→2024 swing
- +9.1pp toward D · 2008: 6.1pp · 2024: 15.2pp
- All cycles
- 2024: D+15.2 2020: D+18.7 2016: D+13.5 2012: D+5.8 2008: D+6.1
Not yet ingested
- Civics
- —
Market trends
- HPI YoY
- ▼ -107.07%
- Current HPI
- 329.8338
- Rent YoY
- ▲ 0.21%
- Metro
- Tucson, AZ
- State GDP YoY
- ▲ 4.54%
- F500 in state
- 20
Industry mix (Fortune 500 HQ in AZ)
| Industry | F500 HQs | Revenue |
|---|---|---|
| Technology | 2 | $13B |
|
||
| Mining / Metals | 1 | $23B |
|
||
| Environmental Services | 1 | $16B |
|
||
| Metals / Steel | 1 | $14B |
|
||
| Technology Distribution | 1 | $9B |
|
||
| Homebuilding | 1 | $8B |
|
||
Price history
1 event — show timeline
- 2026-04-01 Listed $92,500 Zillow
Cash-flow waterfall
monthlySold comps — $/sqft
last 12 mo · ≤1 miLoading sold comps…