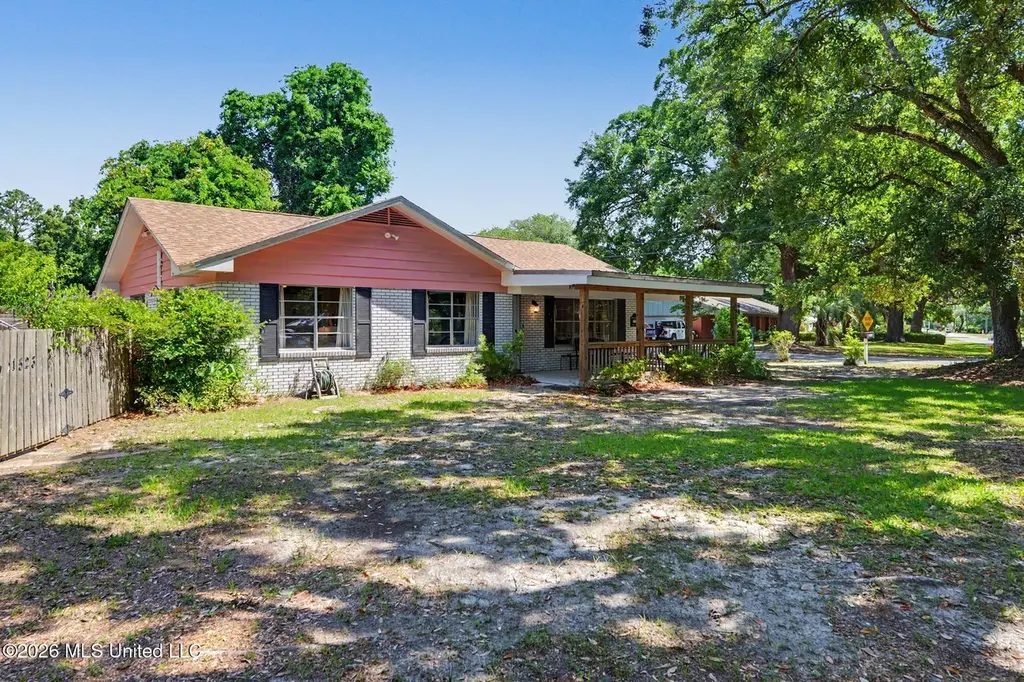
1523 E 2nd St · Pass Christian, MS
Flood risk 1/10 · Minimal
- FEMA flood zone
- X (unshaded)
- Chance of flooding over 30 yrs
- 0.0%
- Est. flood insurance / yr
- $507 – $1,088
Fire risk 3/10 · Minor
- Est. fire insurance / yr
- $1,241 – $2,305
Heat risk 10/10 · Severe
- Hot days now (above 106°F)
- 7 days/yr
- Hot days in 30 yrs
- 24 days/yr
Wind risk 9/10 · Severe
- Chance of severe wind over 30 yrs
- 99.0%
Air-quality risk 1/10 · Minimal
- Unhealthy air days now
- 0 days/yr
- Unhealthy air days in 30 yrs
- 0 days/yr
Risk factors via First Street. Map © Google.
Why this score? — see what drove the D grade
The composite is a weighted blend of 9 inputs, each scored 0–100. Each bar is that input's sub-score; the figure is the points it added to the 100-point composite (weight × sub-score).
- ARV discount +15.0/15.0
- Cash flow +10.1/30.0
- Schools +4.1/10.0
- Livability +3.5/5.0
- DSCR +2.9/10.0
- Rent growth +2.5/5.0
- Condition / age +2.5/5.0
- 1% rule +2.4/10.0
- Appreciation +0.0/10.0
$295,000
🖨 Deal sheet 📄 Offer letter ✓ Due diligence
Listing remarks MLS
New Price! Popular Second Street Location! Area had no flooding! Large double corner lot, with plenty of room to add on! Brick Ranch house is 1800 sq ft PLUS a 464 sq ft enclosed rear porch so under roof totals 2,264 sq ft actual living area. Bonus room that is used as as additional bedroom. Large open kitchen with real wood walls and ceiling, lots of cabinetry, storage. Living area to the back with fireplace and inside laundry room. 12 Year old room and 2 year old hot water heater and HVAC make this a great investment . RV hookup. Walkable to the beach. Top rated School System. Huge backyard. Seller to Sell ''as is.''
Key facts
- Brick fireplace
- Private backyard
- Large bunk room
Tags
Property features AI
Finance
- Other: Approximately 0.37-acre lot (140 x 125); Living area reported from public records (2,106)
Exterior
- Parking: 2-car garage; Driveway; RV access/parking
- Utilities: Public water; Public sewer; Electricity connected; Natural gas connected; Sewer connected
- Home design: Single-family house; One story; Brick veneer construction; Slab foundation
- Construction: Brick veneer; Asphalt shingle roof; Slab foundation; Built (year per public records)
- Exterior features: Front porch; Back yard fencing; RV hookup; RV access/parking; Driveway; Near beach; Level, rectangular city lot
Interior
- Kitchen: Dishwasher; Electric range; Refrigerator; Electric water heater
- Flooring: Luxury vinyl; Tile
- Bathrooms: 2 full bathrooms
- Heating & cooling: Central heating (natural gas); Central air; Ductless cooling
- Interior features: Move-in ready; Den with fireplace; Courtyard; Outdoor shower
- Laundry & utility: Laundry room
Neighborhood map
What this means for you Summary
Snapshot
- This is a 3-bed/1.0-bath single-family listed at $295k.
Deal economics
- At list price, monthly cash flow is $-174 ($-2k/yr) — negative.
- To cash-flow at today's rent, offer at most $264k (10.4% below list).
- To meet the 1% rule (rent ≥ 1% of price), the offer needs to be $218k (25.9% below list).
- Recommended offer: $218k (25.9% below list) — sets the bar for 1% rule.
- Cap rate 5.6% vs local median 1.1% in Pass Christian — top-decile yield for the area; either an underpriced asset or a hidden risk that comps aren't pricing in. Stress-test before assuming the spread holds.
Location & tenants
- Location reads 70/100 on livability (#40 in MS) — a middle-class / working-renter tenant base. Strengths: crime A+, cost of living A+, housing A+; Watch: amenities F, commute F, employment F.
- Pass Christian Public School District (suburban): math 45% / reading 51% proficiency, ranked #16 of 130 in MS (top 12%) — families likely to look elsewhere, expect single-tenant / working-renter base with shorter leases.
- Market conditions: 481 active listings in the ZIP; 7 comparable units currently listed for rent nearby; rentals leasing fast (median 12d on market — plan ~1-2 weeks tenant-placement turnaround); 2,194 units permitted in Harrison County in 2024 (0 in 5+ unit buildings).
Forward outlook
- Local home prices are declining (-3.0%/yr); year-one equity from $2k of loan paydown is wiped out by about $9k of value loss. Plan a longer hold.
- Harrison County population projected at +27% by 2050 — long-run rental-demand tailwind backs the buy-and-hold thesis.
Negotiation context
- Only 5 days on market — expect competitive offers; lowballing is unlikely to land.
- 4 sale attempts since 19y ago with the ask held roughly flat each time — persistent listings suggest the price (not the market) is what's stuck; bring a comps-based counter.
- Current owner paid $137k; list at $295k implies a 115% gain — meaningful room to come down on a strong offer.
Risks & watch-outs
- Climate carrying-cost: severe wind risk, 99% chance of damaging wind over 30y; extreme-heat days projected 7→24/yr by 2055 (HVAC capex compounding) — expect insurance premiums to compound above CPI over the hold.
Questions for the listing agent
- What do current leases actually rent for vs. the listed asking? Can we see a recent rent roll and the last 12 months of T-12 income?
- Built in 1968 — when were the roof, HVAC, electrical panel, plumbing, and water heater last replaced?
- Is there a deadline driving the sale (1031 exchange, divorce, estate, relocation)? That informs how much negotiation room exists.
- The area grade is low — what's the realistic commute time and amenity access for the typical tenant pool here? Any planned neighborhood developments (good or bad) we should know about?
- What's the average days-on-market for RENTAL listings here right now (not sales)? A rising rental-DOM trend means longer vacancies and softer asking-rent achievability than the comps imply.
- What's the recent tenant-quality profile in this submarket — average credit score on applications, eviction rate, late-payment / NSF rate, and stable-employment percentage? A property-management company in the area should have these aggregated.
- How much new for-sale + rental construction is in the pipeline within 1–3 miles? Heavy new supply typically softens prices + rents 12–24 months out; constrained supply supports both.
Investment metrics
- 1% rule
- 0.74% ✗
- Cap rate
- 5.58%
- Cash-on-cash
- -2.53%
- DSCR
- 0.89
- GRM
- 11.3
CMA / ARV
- ARV (median comp)
- $380,557
- List price
- $295,000
- Delta
- -22.48%
- Verdict
- UNDERPRICED
- Comps
- 20 within 1.0 mi
Show comp detail 12 sales within ~0.75 mi
| Address | Dist | Beds/Ba | Sqft | Sold | Price | $/sf | Match |
|---|---|---|---|---|---|---|---|
| 116 Palm Ave | 0.24mi | 2/2.0 (-1) | 1,801 (-0%) | 7mo | $475,000 | $264 | 73 |
| 116 Elva Dr | 0.12mi | 3/2.0 | 1,684 (-7%) | 8mo | $419,900 | $249 | 72 |
| 106 Edwards Dr | 0.19mi | 2/2.0 (-1) | 1,700 (-6%) | 3mo | $389,000 | $229 | 70 |
| 103 Palm Ave | 0.12mi | 4/2.5 (+1) | 1,896 (+5%) | 9mo | $367,500 | $194 | 68 |
| 121 Eleanor Ave | 0.17mi | 3/2.0 | 1,594 (-12%) | 4mo | $449,000 | $282 | 65 |
| 117 Palm Ave | 0.21mi | 2/2.0 (-1) | 1,726 (-4%) | 11mo | $449,500 | $260 | 65 |
| 125 Hayden Ave | 0.21mi | 3/2.0 | 1,573 (-13%) | 3mo | $249,900 | $159 | 62 |
| 119 Shadowlawn Ave | 0.39mi | 2/2.0 (-1) | 1,650 (-9%) | 12mo | $389,000 | $236 | 48 |
| 217 White Harbor Rd | 0.61mi | 3/2.0 | 2,033 (+13%) | 4mo | $520,000 | $256 | 43 |
| 1006 E Beach Blvd | 0.66mi | 4/3.0 (+1) | 1,881 (+4%) | 8mo | $619,000 | $329 | 43 |
| 1349 E 2nd St | 0.45mi | 4/2.0 (+1) | 2,021 (+12%) | 12mo | $320,000 | $158 | 40 |
| 313 Espy Ave | 0.62mi | 4/2.0 (+1) | 1,624 (-10%) | 11mo | $235,000 | $145 | 36 |
Match score weights: distance 35% · size 25% · config 20% · recency 20%. Top-matched comps best support the ARV.
Projected returns pro-forma
-3.0% appreciation · 3.0% rent growth · sell at horizon
- IRR
- -20.5%
- Equity multiple
- 0.29×
- Total profit
- $-58,964
- Equity at exit
- $43,985
- IRR
- -13.8%
- Equity multiple
- 0.20×
- Total profit
- $-65,860
- Equity at exit
- $25,506
Cash invested: $82,600 (down + closing). Projections, not guarantees.
Landlord ↔ Tenant lean methodology
- Overall (STATE)
- 90 Strongly Landlord-Friendly
- State Mississippi
- 90 Strongly Landlord-Friendly · R+11
- County
- — inherits STATE
- City
- — inherits STATE
ZIP-level market 39571
- Active inventory
- 481
- Price-to-rent
- 11.3×
Monthly cashflow live
- Estimated rent
- $2,185 high interval (Pro) →
- Mortgage (P&I)
- −$1,547
- Tax from tax record
- −$231 /mo · $2,767/yr
- Insurance
- −$123
- HOA
- −$0
- Vacancy / Maint / Mgmt
- −$459
- Net cashflow
- $-174
Break-even live
UW: 25.0% down · 7.5% · 30yr · 1.5% tax · 5.0% vac · 8.0% maint · 8.0% mgmt
Financing live
Cash to close
- Down payment
- $73,750
- Closing costs
- $8,850
- Reserves months
- —
- Total cash needed
- —
Loan-product check · same deal, 3 products live
Conventional
25% down · 7.5% · 30yr
- Down + closing
- —
- Monthly P&I
- —
- Monthly cashflow
- —
- DSCR
- —
- Eligible?
- —
Personal DTI + credit; lowest rate.
DSCR
20% down · 8.5% · 30yr
- Down + closing
- —
- Monthly P&I
- —
- Monthly cashflow
- —
- DSCR
- —
- Eligible?
- —
No personal income docs; deal must DSCR.
Hard money
10% down · 12.0% · 12mo
- Down + closing
- —
- Monthly P&I
- —
- Monthly cashflow
- —
- DSCR
- —
- Eligible?
- —
Short-term bridge; refi at stabilization.
Rent comps 7 comps
| Address | Beds | Baths | Sqft | Rent | $/sqft | DOM | Units | Dist |
|---|---|---|---|---|---|---|---|---|
| 105 Eleanor Ave Pass Christian, MS | 2.0 | 2.0 | 1535 | $2,400 | $1.56 | 3d | 1 | 0.28mi |
| 1592 E Second St Pass Christian, MS | 3.0 | 2.0 | 2300 | $2,300 | $1.00 | 13d | 1 | 0.40mi |
| 2012 W Second St Long Beach, MS | 1.0–3.0 | 1.0–2.0 | 1125 | $1,550 | $1.38 | 2d | 17 | 0.43mi |
| 7 Oak Alley Ln Long Beach, MS | 2.0 | 2.5 | 1520 | $2,600 | $1.71 | 13d | 1 | 0.53mi |
| 24 Pelican Cove Ln Long Beach, MS | 3.0 | 2.0 | 1968 | $1,900 | $0.97 | 11d | 1 | 0.54mi |
| 1000 Arbor Station Dr Long Beach, MS | 1.0–3.0 | 1.0–2.0 | 1281 | $1,669 | $1.30 | 11d | 1 | 1.05mi |
| 17 Alexandria Grace Dr Long Beach, MS | 4.0 | 2.0 | 2120 | $2,500 | $1.18 | 21d | 1 | 1.44mi |
Listing history 10 events
-
2026-05-07status Pending 1791-char remark
-
2026-05-01$295,000 Active 1791-char remark
-
2021-10-01historical
-
2017-06-13soldstatus $137,000
-
2017-06-09soldstatus
Show marketing remark (626 chars)
New Price! Popular Second Street Location! Area had no flooding! Large double corner lot, with plenty of room to add on! Brick Ranch house is 1800 sq ft PLUS a 464 sq ft enclosed rear porch so under roof totals 2,264 sq ft actual living area. Bonus room that is used as as additional bedroom. Large open kitchen with real wood walls and ceiling, lots of cabinetry, storage. Living area to the back with fireplace and inside laundry room. 12 Year old room and 2 year old hot water heater and HVAC make this a great investment . RV hookup. Walkable to the beach. Top rated School System. Huge backyard. Seller to Sell ''as is.''
-
2016-10-17$148,000
Show marketing remark (626 chars)
New Price! Popular Second Street Location! Area had no flooding! Large double corner lot, with plenty of room to add on! Brick Ranch house is 1800 sq ft PLUS a 464 sq ft enclosed rear porch so under roof totals 2,264 sq ft actual living area. Bonus room that is used as as additional bedroom. Large open kitchen with real wood walls and ceiling, lots of cabinetry, storage. Living area to the back with fireplace and inside laundry room. 12 Year old room and 2 year old hot water heater and HVAC make this a great investment . RV hookup. Walkable to the beach. Top rated School System. Huge backyard. Seller to Sell ''as is.''
-
2014-08-26$139,500
-
2007-06-29soldstatus
-
2007-06-26soldstatus
-
2007-03-08$169,500
ⓘ Source: listings_history table (triggers on properties + properties_extension) + one-shot
backfill from property_details.listing_events for pre-trigger history.
Tax reassessment forecast MS · Resets to sale price
- Current annual tax
- $2,767 · $231/mo
- Projected year-2 tax
- $2,767 · $231/mo
- Expected delta
- $0/yr ($0/mo · 0.0%)
ⓘ Screening estimate from a state-policy table — verify with the county assessor before closing.
Climate risk First Street
- Flood 1/10 Low FEMA zone X (unshaded) · 0% chance over 30 yrs
- Wildfire 3/10 Moderate
- Heat 10/10 Extreme 7 d/yr ≥106°F today · 24 d/yr by 30 yrs out
- Wind 9/10 Extreme 99% chance of damaging wind over 30 yrs
- Air quality 1/10 Low 0 unhealthy d/yr today · 0 by 30 yrs out
Nearby sold comps map
Loading sold comps map…
Walkable amenities ~0.75 mi
Loading nearby amenities…
Taxation est. · year 1
- Rental income
- $26,220
- − Mortgage interest
- −$16,525
- − Property taxes
- −$2,767
- − Insurance
- −$1,475
- − Repairs & maintenance
- −$2,098
- − Management
- −$2,098
- − Depreciation
- −$8,582
- Taxable loss
- −$7,324
- Est. tax savings @ 24.0%
- +$1,758
- After-tax cash flow
- $-335/yr
For passive investors: Depreciation is non-cash, so a rental often shows a tax loss while cash-flowing — sheltering income. Rental losses are passive: they offset passive income freely, and up to $25,000/yr can offset ordinary (W-2) income if you actively participate and your MAGI is under $100k (phasing out to $0 by $150k); unused losses carry forward. On sale, claimed depreciation is recaptured at up to 25%, and gains may owe capital-gains tax (a 1031 exchange can defer both). Figures are a year-1 estimate at your 24.0% rate — not tax advice; consult a CPA.
Schools (NCES district)
- District
- Pass Christian Public School District
- NCES district ID
- 2803510
- Math proficiency
- 45% ▼ -11.00%
- Reading proficiency
- 51% ▼ -3.00%
- Median HH income
- $51,858
- Composite
- 41.29/100
- National rank
- #3517
- State rank
- #16 of 130 in MS
Livability — Pass Christian
- Score
- 70/100
- State rank
- #40
- US rank
- #7599
Category grades
Schools grade is shown separately in the Schools card above.
Census & demographics
- Census place
- Pass Christian, MS
- Population (ZIP)
- 13,942
Population outlook (Harrison County) Hauer SSP2
- Today (2025)
- 228,444 people
- By 2030
- 241,942 · +5.9%
- By 2040
- 267,531 · +17.1%
- By 2050
- 291,062 · +27.4%
- By 2075
- 346,711 · +51.8%
- By 2100
- 378,165 · +65.5%
Race, ethnicity, and origin ACS 2023
- Neighborhood character
- Predominantly White (73%)
- Race & ethnicity
- White 73% Black 17% Hispanic / Latino 7% Two or more races 6%
- Hispanic origin (detail)
- Mexican 2%
- Common ancestry
- Lithuanian 10% Slovak 2% Italian 2%
- Foreign-born
- 2% · Canada, Vietnam
- Languages at home
- 95% English-only · Spanish 3% French/Haitian/Cajun 0%
Political lean MEDSL · Harrison
- 2024 margin
- Strong R (+28.9) · D 35.0% · R 63.9% · Other 1.1%
- 2008→2024 swing
- -2.9pp toward R · 2008: -26.0pp · 2024: -28.9pp
- All cycles
- 2024: R+28.9 2020: R+25.2 2016: R+30.7 2012: R+26.6 2008: R+26.0
Not yet ingested
- Civics
- —
Market trends
- HPI YoY
- ▼ -107.22%
- Current HPI
- 183.8701
- Rent YoY
- —
- Metro
- —
- State GDP YoY
- —
- F500 in state
- 0
Price history
+74.0% since first listed12 events — show timeline
- 2026-06-03 Sold (Public Records) — Public Records
- 2026-06-01 Sold (MLS) — MLSU
- 2026-05-07 Pending — MLSU
- 2026-05-01 Listed $295,000 MLSU
- 2021-10-01 Listing Removed — MLSU
- 2017-06-13 Sold (Public Records) $137,000 Public Records
- 2017-06-09 Sold (MLS) — MLSU
- 2016-10-17 Listed $148,000 MLSU
- 2014-08-26 Listed $139,500 MLSU
- 2007-06-29 Sold (Public Records) — Public Records
- 2007-06-26 Sold (MLS) — MLSU
- 2007-03-08 Listed $169,500 MLSU
Property tax history
+1.3%/yrLatest (2025): $2,767 · +5.7% YoY. Source: county tax records.
Cash-flow waterfall
monthlySold comps — $/sqft
last 12 mo · ≤1 miLoading sold comps…