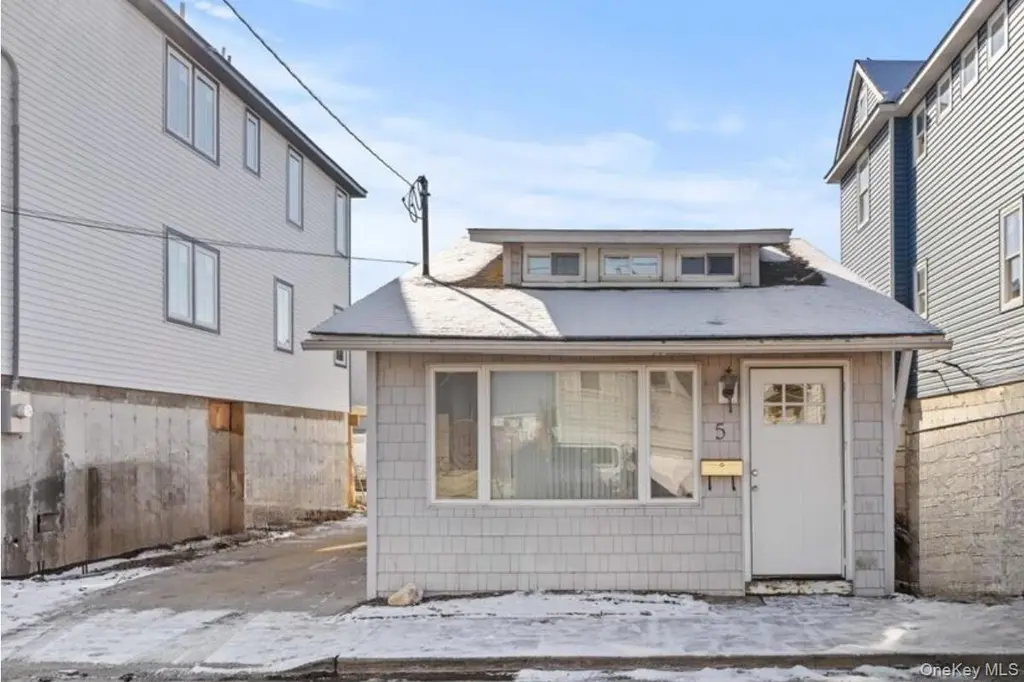
5 James St · Bay Park, NY
Flood risk 10/10 · Severe
- FEMA flood zone
- AE
- Chance of flooding over 30 yrs
- 0.99%
- Est. flood insurance / yr
- $1,737 – $8,500
Fire risk 1/10 · Minimal
- Est. fire insurance / yr
- $691 – $1,283
Heat risk 6/10 · Moderate
- Hot days now (above 95°F)
- 7 days/yr
- Hot days in 30 yrs
- 15 days/yr
Wind risk 6/10 · Moderate
- Chance of severe wind over 30 yrs
- 71.0%
Air-quality risk 4/10 · Minor
- Unhealthy air days now
- 4 days/yr
- Unhealthy air days in 30 yrs
- 6 days/yr
Risk factors via First Street. Map © Google.
Why this score? — see what drove the C grade
The composite is a weighted blend of 9 inputs, each scored 0–100. Each bar is that input's sub-score; the figure is the points it added to the 100-point composite (weight × sub-score).
- Cash flow +19.2/30.0
- ARV discount +15.0/15.0
- DSCR +6.0/10.0
- Schools +5.7/10.0
- 1% rule +5.1/10.0
- Livability +4.0/5.0
- Rent growth +2.5/5.0
- Condition / age +2.2/5.0
- Appreciation +0.0/10.0
$400,000
🖨 Deal sheet (PDF) 📄 Offer letter ✓ Due diligence
Listing remarks MLS
Experience the essence of seaside living at this charming coastal retreat perfectly positioned for those who love life by the water. Nestled in a vibrant nautical community, this home offers proximity to marinas, boat slips, waterfront dining, and scenic canals. Inside, the home is filled with natural light and a breezy coastal feel, creating an inviting atmosphere that reflects the beauty of its surroundings—featuring 2 Bedrooms, an open layout, and a backyard oasis. Whether you’re heading out for a day on the water, enjoying sunset strolls along the shoreline, or entertaining after a day of boating, this property offers a lifestyle that blends comfort with coastal charm. A rare opportunity to embrace the nautical lifestyle you’ve been dreaming of — all in the heart of East Rockaway.
Key facts
- Waterfront dining
- Proximity to marinas
- Natural light
Tags
Neighborhood map
What this means for you Summary
Snapshot
- This is a 2-bed/1.0-bath single-family listed at $400k. Condition is rated fair.
Deal economics
- At list price, monthly cash flow is $2 ($28/yr) — positive.
- The deal already cash-flows at list — no discount required.
- Meets the 1% rule at list price ($4k rent vs $400k).
- Recommended offer: $376k (6.0% below list) — sets the bar for market timing.
Location & tenants
- Location reads 79/100 on livability (#127 in NY, #2,041 nationally) — a middle-class / working-renter tenant base. Strengths: crime A+, employment A+, housing A+; Watch: amenities D+, cost of living F.
- East Rockaway Union Free School District (suburban): math 61% / reading 67% proficiency, ranked #165 of 590 in NY (top 28%) — acceptable for families but not a draw, mixed tenant base, ~2y average lease; only 20% free/reduced lunch — higher-income household profile.
- Zoned schools: Rhame Avenue Elementary School (math 42% / reading 62%, grade C-, #988 of 2,108 statewide, top 49%, 312 students, 0% FRL); East Rockaway Junior-Senior High School (math 77% / reading 67%, grade B+, #677 of 1,100 statewide, top 63%, 583 students, 0% FRL) — zoned schools average 0% FRL vs 20% district-wide (20 pts lower); this property's tenant base skews higher-income than the district average.
- Market conditions: 92 active listings in the ZIP; 12 comparable units currently listed for rent nearby; rentals at typical pace (median 26d on market — plan ~3-4 weeks tenant-placement turnaround); 824 units permitted in Nassau County in 2024 (153 in 5+ unit buildings).
Forward outlook
- Local home prices are declining (-3.0%/yr); year-one equity from $3k of loan paydown is wiped out by about $12k of value loss. Plan a longer hold.
- Nassau County population projected at +7% by 2050 — modest demand growth; plan on rents tracking national, not racing it.
Negotiation context
- It's been on market 90 days — a 6% lower offer ($376k) is reasonable based on typical stale-listing flexibility.
- 6 sale attempts since 12y ago; this cycle's ask has dropped $30k (7%) from the opening price — seller is motivated, your offer sets the floor, not the list.
Risks & watch-outs
- Watch-outs: flood insurance adds $427/mo; built in 1925 — expect roof / HVAC / electrical / plumbing capex.
- Climate carrying-cost: in FEMA flood zone AE (mandatory federal flood insurance); major wind risk, 71% chance of damaging wind over 30y; extreme-heat days projected 7→15/yr by 2055 (HVAC capex compounding) — expect insurance premiums to compound above CPI over the hold.
Questions for the listing agent
- It's been on market 90 days. Have you received any prior offers? Is the seller open to a 6% concession, seller financing, or rate buy-down credit?
- Have any recent inspections been done? Can we get a copy of the seller's disclosures and any deferred-maintenance estimates?
- Built in 1925 — when were the roof, HVAC, electrical panel, plumbing, and water heater last replaced?
- What's the actual annual flood-insurance premium (NFIP or private), and is the property in a SFHA with mandatory coverage?
- Why hasn't it sold? Are there any deal-killer items the seller is aware of (foundation, flood, title, zoning, code violations)?
- Is there a deadline driving the sale (1031 exchange, divorce, estate, relocation)? That informs how much negotiation room exists.
- Schools are B-rated — typically a magnet for longer-tenancy family renters. What's the average tenant stay here, and is there a school-zone premium baked into asking?
- What's the average days-on-market for RENTAL listings here right now (not sales)? A rising rental-DOM trend means longer vacancies and softer asking-rent achievability than the comps imply.
- What's the recent tenant-quality profile in this submarket — average credit score on applications, eviction rate, late-payment / NSF rate, and stable-employment percentage? A property-management company in the area should have these aggregated.
- How much new for-sale + rental construction is in the pipeline within 1–3 miles? Heavy new supply typically softens prices + rents 12–24 months out; constrained supply supports both.
Investment metrics
- 1% rule
- 1.01% ✓
- Cap rate
- 7.58%
- Cash-on-cash
- 4.60%
- DSCR
- 1.20
- GRM
- 8.2
CMA / ARV
- ARV (median comp)
- $619,381
- List price
- $400,000
- Delta
- -35.42%
- Verdict
- UNDERPRICED
- Comps
- 20 within 1.0 mi
Show comp detail 12 sales within ~0.75 mi
| Address | Dist | Beds/Ba | Sqft | Sold | Price | $/sf | Match |
|---|---|---|---|---|---|---|---|
| 126 Williamson St | 0.02mi | 2/1.5 | 1,208 (+10%) | 1mo | $460,000 | $381 | 79 |
| 28 Cammerer Ave | 0.36mi | 3/1.0 (+1) | 1,143 (+4%) | 5mo | $447,000 | $391 | 66 |
| 42 West Blvd | 0.57mi | 2/1.0 | 1,136 (+4%) | 11mo | $629,000 | $554 | 58 |
| 98 1st Ave | 0.35mi | 2/2.0 | 1,230 (+12%) | 2mo | $499,999 | $407 | 58 |
| 375 W Windsor Pkwy | 0.27mi | 3/1.5 (+1) | 1,223 (+12%) | 5mo | $710,000 | $581 | 56 |
| 35 Lawson Ave | 0.62mi | 3/2.0 (+1) | 1,064 (-3%) | 3mo | $619,000 | $582 | 55 |
| 10 Fulton St E | 0.50mi | 2/2.0 | 1,200 (+10%) | 3mo | $660,000 | $550 | 54 |
| 10 Sampson St E | 0.62mi | 2/1.5 | 1,136 (+4%) | 11mo | $440,000 | $387 | 53 |
| 495 Henry St | 0.52mi | 3/1.5 (+1) | 1,180 (+8%) | 14mo | $660,000 | $559 | 44 |
| 86 West Blvd | 0.65mi | 2/2.0 | 1,200 (+10%) | 8mo | $570,000 | $475 | 43 |
| 589 Yale St | 0.70mi | 3/2.0 (+1) | 1,075 (-2%) | 15mo | $700,000 | $651 | 42 |
| 2982 Bayview Ct | 0.68mi | 3/2.0 (+1) | 1,250 (+14%) | 12mo | $690,000 | $552 | 26 |
Match score weights: distance 35% · size 25% · config 20% · recency 20%. Top-matched comps best support the ARV.
Projected returns pro-forma
-3.0% appreciation · 3.0% rent growth · sell at horizon
- IRR
- -16.2%
- Equity multiple
- 0.43×
- Total profit
- $-64,345
- Equity at exit
- $59,641
- IRR
- -7.7%
- Equity multiple
- 0.51×
- Total profit
- $-54,525
- Equity at exit
- $34,585
Cash invested: $112,000 (down + closing). Projections, not guarantees.
Landlord ↔ Tenant lean methodology
- Overall (STATE)
- 15 Strongly Tenant-Friendly
- State New York
- 15 Strongly Tenant-Friendly · D+10
- County
- — inherits STATE
- City
- — inherits STATE
ZIP-level market 11518
- Active inventory
- 92
- Price-to-rent
- 8.2×
Monthly cashflow live
- Estimated rent
- $4,042 high interval (Pro) →
- Mortgage (P&I)
- −$2,098
- Tax est. 1.5%
- −$500 /mo · $6,000/yr
- Insurance
- −$167
- Flood insurance flood zone
- −$427 /mo · $5,118/yr
- HOA
- −$0
- Vacancy / Maint / Mgmt
- −$849
- Net cashflow
- $2
Break-even live
Sensitivity live
| Price | -10% $279 | -5% $141 | +0% $2 | +5% $-136 | +10% $-274 |
|---|---|---|---|---|---|
| Rent | -10% $-317 | -5% $-157 | +0% $2 | +5% $162 | +10% $322 |
| Rate | -1.0pp $204 | -0.5pp $104 | base $2 | +0.5pp $-101 | +1.0pp $-207 |
UW: 25.0% down · 7.5% · 30yr · 1.5% tax · 5.0% vac · 8.0% maint · 8.0% mgmt
Financing live
Cash to close
- Down payment
- $100,000
- Closing costs
- $12,000
- Reserves months
- —
- Total cash needed
- —
Loan-product check · same deal, 3 products live
Conventional
25% down · 7.5% · 30yr
- Down + closing
- —
- Monthly P&I
- —
- Monthly cashflow
- —
- DSCR
- —
- Eligible?
- —
Personal DTI + credit; lowest rate.
DSCR
20% down · 8.5% · 30yr
- Down + closing
- —
- Monthly P&I
- —
- Monthly cashflow
- —
- DSCR
- —
- Eligible?
- —
No personal income docs; deal must DSCR.
Hard money
10% down · 12.0% · 12mo
- Down + closing
- —
- Monthly P&I
- —
- Monthly cashflow
- —
- DSCR
- —
- Eligible?
- —
Short-term bridge; refi at stabilization.
Rent comps 12 comps
| Address | Beds | Baths | Sqft | Rent | $/sqft | DOM | Units | Dist |
|---|---|---|---|---|---|---|---|---|
| 121 Williamson St East Rockaway, NY | 3.0 | 1.5 | 1000 | $4,700 | $4.70 | 0d | 1 | 0.05mi |
| 225 Marina Pointe Dr Unit 225 Oceanside, NY | 2.0 | 2.0 | 1337 | $4,200 | $3.14 | 12d | 1 | 0.38mi |
| 2701 Magee Pl Unit 2 Oceanside, NY | 2.0 | 1.0 | 1500 | $3,100 | $2.07 | 45d | 1 | 0.72mi |
| 441 Atlantic Ave Unit 2 East Rockaway, NY | 3.0 | 1.0 | 1150 | $3,500 | $3.04 | 45d | 1 | 0.73mi |
| 8 Roswell Ave Oceanside, NY | 2.0 | 1.5 | 741 | $3,100 | $4.18 | 26d | 1 | 0.96mi |
| 99 Centre Ave East Rockaway, NY | 1.0 | 1.0 | 1200 | $2,995 | $2.50 | 6d | 1 | 0.97mi |
| 576 Scranton Ave Unit 576-4 Lynbrook, NY | 2.0 | 1.0 | 1212 | $3,750 | $3.09 | 46d | 1 | 1.28mi |
| 111 S Centre Ave Apt 1SS Rockville Centre, NY | 2.0 | 1.0 | 950 | $3,250 | $3.42 | 6d | 1 | 1.36mi |
| 24 Doxsey Pl Unit 3 Lynbrook, NY | 2.0 | 1.0 | 900 | $3,300 | $3.67 | 26d | 1 | 1.38mi |
| 112 Atlantic Ave Apt 71 Lynbrook, NY | 2.0 | 1.0 | 760 | $3,000 | $3.95 | 15d | 1 | 1.44mi |
| 68 Shipherd Ave Apt 2 Lynbrook, NY | 2.0 | 1.0 | 1200 | $2,650 | $2.21 | 26d | 1 | 1.46mi |
| 23 Thompson Pl Unit 2 Lynbrook, NY | 3.0 | 1.0 | 900 | $3,100 | $3.44 | 20d | 1 | 1.49mi |
Listing history 30 events
-
2026-06-21days on market $400,000 Active 90 DOM
-
2026-06-18days on market $400,000 Active 87 DOM
-
2026-06-17days on market $400,000 Active 86 DOM
-
2026-06-16days on market $400,000 Active 85 DOM
-
2026-06-15price $400,000 Active 84 DOM
-
2026-06-15days on market $429,999 Active 84 DOM
-
2026-06-13days on market $429,999 Active 82 DOM
-
2026-06-09days on market $429,999 Active 78 DOM
-
2026-06-08days on market $429,999 Active 77 DOM
-
2026-06-07days on market $429,999 Active 76 DOM
-
2026-06-04days on market $429,999 Active 73 DOM
-
2026-06-03days on market $429,999 Active 72 DOM
-
2026-06-02days on market $429,999 Active 71 DOM
-
2026-06-01days on market $429,999 Active 70 DOM
-
2026-05-31days on market $429,999 Active 69 DOM
-
2026-03-24status Active 820-char remark
Show marketing remark (820 chars)
Experience the essence of seaside living at this charming coastal retreat perfectly positioned for those who love life by the water. Nestled in a vibrant nautical community, this home offers proximity to marinas, boat slips, waterfront dining, and scenic canals. Inside, the home is filled with natural light and a breezy coastal feel, creating an inviting atmosphere that reflects the beauty of its surroundings—featuring 2 Bedrooms, an open layout, and a backyard oasis. Whether you’re heading out for a day on the water, enjoying sunset strolls along the shoreline, or entertaining after a day of boating, this property offers a lifestyle that blends comfort with coastal charm. A rare opportunity to embrace the nautical lifestyle you’ve been dreaming of — all in the heart of East Rockaway.
-
2026-01-28$429,999 Active 820-char remark
Show marketing remark (820 chars)
Experience the essence of seaside living at this charming coastal retreat perfectly positioned for those who love life by the water. Nestled in a vibrant nautical community, this home offers proximity to marinas, boat slips, waterfront dining, and scenic canals. Inside, the home is filled with natural light and a breezy coastal feel, creating an inviting atmosphere that reflects the beauty of its surroundings—featuring 2 Bedrooms, an open layout, and a backyard oasis. Whether you’re heading out for a day on the water, enjoying sunset strolls along the shoreline, or entertaining after a day of boating, this property offers a lifestyle that blends comfort with coastal charm. A rare opportunity to embrace the nautical lifestyle you’ve been dreaming of — all in the heart of East Rockaway.
-
2024-11-26soldstatus $459,000 Closed 312-char remark
Show marketing remark (312 chars)
Beautiful move in ready 3-bedroom home in the desirable town of East Rockaway. Updated kitchen and bathroom with granite countertop. Large bedroom on second floor with additional room for storage. Large recently updated deck for entertaining and large driveway for multiple cars. Perfect starter or forever home.
-
2024-10-10status Pending 312-char remark
Show marketing remark (312 chars)
Beautiful move in ready 3-bedroom home in the desirable town of East Rockaway. Updated kitchen and bathroom with granite countertop. Large bedroom on second floor with additional room for storage. Large recently updated deck for entertaining and large driveway for multiple cars. Perfect starter or forever home.
-
2024-10-01$449,999 Active 312-char remark
Show marketing remark (312 chars)
Beautiful move in ready 3-bedroom home in the desirable town of East Rockaway. Updated kitchen and bathroom with granite countertop. Large bedroom on second floor with additional room for storage. Large recently updated deck for entertaining and large driveway for multiple cars. Perfect starter or forever home.
-
2019-01-10historical
-
2019-01-10soldstatus $295,000 Closed
-
2018-10-13status Under Contract
-
2018-08-14price $299,950
-
2018-07-27price $310,000
-
2018-05-09$319,000 New
-
2014-11-06soldstatus $82,000
-
2014-10-08$89,900
-
2014-05-13historical
-
2014-02-12$89,900
ⓘ Source: listings_history table (triggers on properties + properties_extension) + one-shot
backfill from property_details.listing_events for pre-trigger history.
Climate risk First Street
- Flood 10/10 Extreme FEMA zone AE · 99% chance over 30 yrs
- Wildfire 1/10 Low
- Heat 6/10 Major 7 d/yr ≥95°F today · 15 d/yr by 30 yrs out
- Wind 6/10 Major 71% chance of damaging wind over 30 yrs
- Air quality 4/10 Moderate 4 unhealthy d/yr today · 6 by 30 yrs out
Nearby sold comps map
Loading sold comps map…
Walkable amenities ~0.75 mi
Loading nearby amenities…
Taxation est. · year 1
- Rental income
- $48,504
- − Mortgage interest
- −$22,406
- − Property taxes
- −$6,000
- − Insurance
- −$7,118
- − Repairs & maintenance
- −$3,880
- − Management
- −$3,880
- − Depreciation
- −$11,636
- Taxable loss
- −$6,418
- Est. tax savings @ 24.0%
- +$1,540
- After-tax cash flow
- $1,568/yr
For passive investors: Depreciation is non-cash, so a rental often shows a tax loss while cash-flowing — sheltering income. Rental losses are passive: they offset passive income freely, and up to $25,000/yr can offset ordinary (W-2) income if you actively participate and your MAGI is under $100k (phasing out to $0 by $150k); unused losses carry forward. On sale, claimed depreciation is recaptured at up to 25%, and gains may owe capital-gains tax (a 1031 exchange can defer both). Figures are a year-1 estimate at your 24.0% rate — not tax advice; consult a CPA.
Condition & rehab AI · 12 photos
This home requires moderate repairs to the roof and exterior siding, but has good interior walls and flooring. A roof repair and exterior siding repair would significantly increase its resale and rental value.
Repairs flagged
- Major Roof — Snow and potential ice dam
- Major Exterior siding — Snow and potential ice dam
Value-add opportunities
- Both Roof repair — Fixes major issue and improves curb appeal
- Both Exterior siding repair — Fixes major issue and improves curb appeal
- Both Landscaping — Enhances curb appeal and creates a welcoming environment
Renovation cost estimate screening
| Repair item | Severity | Est. cost |
|---|---|---|
| Roof · Snow and potential ice dam | Major | $15,000–50,000 |
| Exterior siding · Snow and potential ice dam | Major | $15,000–50,000 |
| Total estimated repair cost · 2 items | $30,000–100,000 |
Value-add ROI direction
- Both Roof repair — Fixes major issue and improves curb appeal ↑
- Both Exterior siding repair — Fixes major issue and improves curb appeal ↑
- Both Landscaping — Enhances curb appeal and creates a welcoming environment ↑
ⓘ Cost ranges are severity-bucket heuristics (US national rule-of-thumb). Get contractor quotes + a written scope before underwriting a rehab budget.
Schools (NCES district)
- District
- East Rockaway Union Free School District
- NCES district ID
- 3609960
- Math proficiency
- 61% ▲ 1.00%
- Reading proficiency
- 67% ▲ 10.00%
- Median HH income
- $82,326
- Composite
- 57.47/100
- National rank
- #1072
- State rank
- #165 of 590 in NY
Livability — Bay Park
- Score
- 79/100
- State rank
- #127
- US rank
- #2041
Category grades
Schools grade is shown separately in the Schools card above.
Census & demographics
- Census place
- Bay Park, NY
- Population (ZIP)
- 10,390
Population outlook (Nassau County) Hauer SSP2
- Today (2025)
- 1,409,302 people
- By 2030
- 1,431,482 · +1.6%
- By 2040
- 1,471,607 · +4.4%
- By 2050
- 1,502,845 · +6.6%
- By 2075
- 1,575,403 · +11.8%
- By 2100
- 1,554,356 · +10.3%
Race, ethnicity, and origin ACS 2023
- Neighborhood character
- Predominantly White (76%)
- Race & ethnicity
- White 76% Hispanic / Latino 14% Two or more races 6% Black 4% Asian 3%
- Hispanic origin (detail)
- Puerto Rican 2% Cuban 1% Dominican 3%
- Common ancestry
- Romanian 6% Scotch-Irish 4% Italian 1%
- Foreign-born
- 14% · Canada, China, Jamaica
- Languages at home
- 83% English-only · Spanish 11% Chinese 2% Other Indo-European 2%
Political lean MEDSL · Nassau
- 2024 margin
- Toss-up / Even · D 47.9% · R 52.1%
- 2008→2024 swing
- -12.6pp toward R · 2008: 8.4pp · 2024: -4.2pp
- All cycles
- 2024: R+4.2 2020: D+9.5 2016: D+5.3 2012: D+6.7 2008: D+8.4
Not yet ingested
- Civics
- —
Market trends
- HPI YoY
- ▼ -573.27%
- Current HPI
- 296.296
- Rent YoY
- —
- Metro
- —
- State GDP YoY
- ▲ 2.60%
- F500 in state
- 92
Industry mix (Fortune 500 HQ in NY)
| Industry | F500 HQs | Revenue |
|---|---|---|
| Financial Services | 10 | $950B |
|
||
| Consumer Goods | 9 | $162B |
|
||
| Insurance | 4 | $225B |
|
||
| Telecommunications | 2 | $144B |
|
||
| Pharmaceuticals | 2 | $112B |
|
||
| Media / Entertainment | 2 | $69B |
|
||
Price history
+378.3% since first listed15 events — show timeline
- 2026-03-24 Relisted — OneKey® MLS as Distributed by MLS Grid
- 2026-01-28 Listed $429,999 OneKey® MLS as Distributed by MLS Grid
- 2024-11-26 Sold (MLS) $459,000 OneKey® MLS as Distributed by MLS Grid
- 2024-10-10 Pending — OneKey® MLS as Distributed by MLS Grid
- 2024-10-01 Listed $449,999 OneKey® MLS as Distributed by MLS Grid
- 2019-01-10 Listing Removed — OneKey® MLS as Distributed by MLS Grid
- 2019-01-10 Sold (MLS) $295,000 OneKey® MLS as Distributed by MLS Grid
- 2018-10-13 Pending — OneKey® MLS as Distributed by MLS Grid
- 2018-08-14 Price Changed $299,950 OneKey® MLS as Distributed by MLS Grid
- 2018-07-27 Price Changed $310,000 OneKey® MLS as Distributed by MLS Grid
- 2018-05-09 Listed $319,000 OneKey® MLS as Distributed by MLS Grid
- 2014-11-06 Sold (MLS) $82,000 OneKey® MLS as Distributed by MLS Grid
- 2014-10-08 Listed $89,900 OneKey® MLS as Distributed by MLS Grid
- 2014-05-13 Listing Removed — OneKey® MLS as Distributed by MLS Grid
- 2014-02-12 Listed $89,900 OneKey® MLS as Distributed by MLS Grid
Cash-flow waterfall
monthlySold comps — $/sqft
last 12 mo · ≤1 miLoading sold comps…