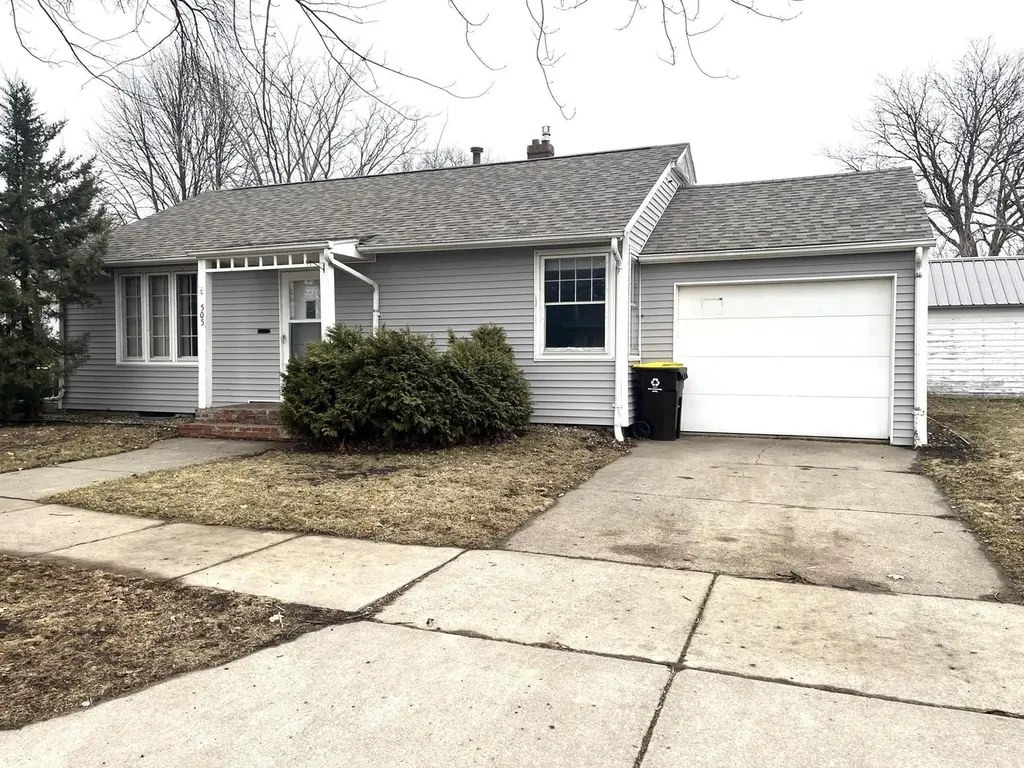
505 Webster St · Fairmont, MN
Flood risk 1/10 · Minimal
- FEMA flood zone
- X
- Chance of flooding over 30 yrs
- 0.0%
- Est. flood insurance / yr
- $507 – $1,088
Fire risk 1/10 · Minimal
- Est. fire insurance / yr
- $888 – $1,650
Heat risk 2/10 · Minimal
- Hot days now (above 98°F)
- 7 days/yr
- Hot days in 30 yrs
- 15 days/yr
Wind risk 2/10 · Minimal
- Chance of severe wind over 30 yrs
- —
Air-quality risk 2/10 · Minimal
- Unhealthy air days now
- 0 days/yr
- Unhealthy air days in 30 yrs
- 1 days/yr
Risk factors via First Street. Map © Google.
Why this score? — see what drove the C+ grade
The composite is a weighted blend of 9 inputs, each scored 0–100. Each bar is that input's sub-score; the figure is the points it added to the 100-point composite (weight × sub-score).
- Cash flow +24.9/30.0
- ARV discount +13.0/15.0
- DSCR +8.1/10.0
- 1% rule +6.2/10.0
- Schools +4.1/10.0
- Livability +3.4/5.0
- Rent growth +2.5/5.0
- Condition / age +2.5/5.0
- Appreciation +0.0/10.0
$89,900
🖨 Deal sheet (PDF) 📄 Offer letter ✓ Due diligence
Listing remarks MLS
So much potential here! This 2 bedroom rambler is located on a corner lot in the heart of town. There is new flooring in the living/dining room. The basement has a radon mitigation system. New vinyl siding in 2025.
Key facts
- New flooring
- New vinyl siding
- Corner lot
Tags
Neighborhood map
What this means for you Summary
Snapshot
- This is a 2-bed/1.0-bath single-family listed at $90k.
Deal economics
- At list price, monthly cash flow is $193 ($2k/yr) — positive.
- The deal already cash-flows at list — no discount required.
- Meets the 1% rule at list price ($1k rent vs $90k).
- Recommended offer: $82k (9.0% below list) — sets the bar for market timing.
- Cap rate 8.9% vs local median 3.4% in Fairmont — top-decile yield for the area; either an underpriced asset or a hidden risk that comps aren't pricing in. Stress-test before assuming the spread holds.
Location & tenants
- Location reads 68/100 on livability (#407 in MN) — a middle-class / working-renter tenant base. Strengths: cost of living A+, housing A+; Watch: health & safety C-, employment D+, amenities F.
- Fairmont Area School District (town): math 45% / reading 51% proficiency, ranked #148 of 301 in MN (top 49%) — families likely to look elsewhere, expect single-tenant / working-renter base with shorter leases.
- Zoned schools: Fairmont Elementary School (math 50% / reading 51%, grade D+, #412 of 857 statewide, top 48%, 956 students, 62% FRL); Fairmont Jr./Sr. High School (math 40% / reading 50%, grade D-, #187 of 471 statewide, top 40%, 859 students, 49% FRL) — zoned schools average 56% FRL vs 35% district-wide (21 pts higher); higher-poverty schools than district average — tighter screening recommended.
- Market conditions: 94 active listings in the ZIP; 19 units permitted in Martin County in 2024 (0 in 5+ unit buildings).
Forward outlook
- Local home prices are declining (-3.0%/yr); year-one equity from $622 of loan paydown is wiped out by about $3k of value loss. Plan a longer hold.
- Martin County population projected at -19% by 2050 — secular population decline; favor cash flow + early exit over multi-decade hold.
Negotiation context
- It's been on market 108 days — a 9% lower offer ($82k) is reasonable based on typical stale-listing flexibility.
- Current owner paid $56k; list at $90k implies a 60% gain — meaningful room to come down on a strong offer.
Risks & watch-outs
- Watch-outs: built in 1950 — expect roof / HVAC / electrical / plumbing capex.
Questions for the listing agent
- It's been on market 108 days. Have you received any prior offers? Is the seller open to a 9% concession, seller financing, or rate buy-down credit?
- Built in 1950 — when were the roof, HVAC, electrical panel, plumbing, and water heater last replaced?
- Why hasn't it sold? Are there any deal-killer items the seller is aware of (foundation, flood, title, zoning, code violations)?
- Is there a deadline driving the sale (1031 exchange, divorce, estate, relocation)? That informs how much negotiation room exists.
- What's the average days-on-market for RENTAL listings here right now (not sales)? A rising rental-DOM trend means longer vacancies and softer asking-rent achievability than the comps imply.
- What's the recent tenant-quality profile in this submarket — average credit score on applications, eviction rate, late-payment / NSF rate, and stable-employment percentage? A property-management company in the area should have these aggregated.
- How much new for-sale + rental construction is in the pipeline within 1–3 miles? Heavy new supply typically softens prices + rents 12–24 months out; constrained supply supports both.
Investment metrics
- 1% rule
- 1.12% ✓
- Cap rate
- 8.86%
- Cash-on-cash
- 9.18%
- DSCR
- 1.41
- GRM
- 7.4
CMA / ARV
- ARV (median comp)
- $102,308
- List price
- $89,900
- Delta
- -12.13%
- Verdict
- UNDERPRICED
- Comps
- 1 within 2.0 mi
Projected returns pro-forma
-3.0% appreciation · 3.0% rent growth · sell at horizon
- IRR
- -2.4%
- Equity multiple
- 0.91×
- Total profit
- $-2,296
- Equity at exit
- $13,404
- IRR
- 7.3%
- Equity multiple
- 1.55×
- Total profit
- $13,815
- Equity at exit
- $7,773
Cash invested: $25,172 (down + closing). Projections, not guarantees.
Landlord ↔ Tenant lean methodology
- Overall (STATE)
- 46 Balanced
- State Minnesota
- 46 Balanced · D+2
- County
- — inherits STATE
- City
- — inherits STATE
ZIP-level market 56031
- Active inventory
- 94
- Price-to-rent
- 7.4×
Monthly cashflow live
- Estimated rent
- $1,008 medium interval (Pro) →
- Mortgage (P&I)
- −$471
- Tax from tax record
- −$95 /mo · $1,136/yr
- Insurance
- −$37
- HOA
- −$0
- Vacancy / Maint / Mgmt
- −$212
- Net cashflow
- $193
Break-even live
Sensitivity live
| Price | -10% $244 | -5% $218 | +0% $193 | +5% $167 | +10% $142 |
|---|---|---|---|---|---|
| Rent | -10% $113 | -5% $153 | +0% $193 | +5% $232 | +10% $272 |
| Rate | -1.0pp $238 | -0.5pp $215 | base $193 | +0.5pp $169 | +1.0pp $146 |
UW: 25.0% down · 7.5% · 30yr · 1.5% tax · 5.0% vac · 8.0% maint · 8.0% mgmt
Financing live
Cash to close
- Down payment
- $22,475
- Closing costs
- $2,697
- Reserves months
- —
- Total cash needed
- —
Loan-product check · same deal, 3 products live
Conventional
25% down · 7.5% · 30yr
- Down + closing
- —
- Monthly P&I
- —
- Monthly cashflow
- —
- DSCR
- —
- Eligible?
- —
Personal DTI + credit; lowest rate.
DSCR
20% down · 8.5% · 30yr
- Down + closing
- —
- Monthly P&I
- —
- Monthly cashflow
- —
- DSCR
- —
- Eligible?
- —
No personal income docs; deal must DSCR.
Hard money
10% down · 12.0% · 12mo
- Down + closing
- —
- Monthly P&I
- —
- Monthly cashflow
- —
- DSCR
- —
- Eligible?
- —
Short-term bridge; refi at stabilization.
Listing history 21 events
-
2026-06-21days on market $89,900 Active 108 DOM
-
2026-06-21days on market $89,900 Active 107 DOM
-
2026-06-18days on market $89,900 Active 105 DOM
-
2026-06-17days on market $89,900 Active 104 DOM
-
2026-06-16days on market $89,900 Active 103 DOM
-
2026-06-15days on market $89,900 Active 102 DOM
-
2026-06-13days on market $89,900 Active 100 DOM
-
2026-06-12days on market $89,900 Active 99 DOM
-
2026-06-09days on market $89,900 Active 96 DOM
-
2026-06-08days on market $89,900 Active 95 DOM
-
2026-06-07days on market $89,900 Active 94 DOM
-
2026-06-05days on market $89,900 Active 92 DOM
-
2026-06-04days on market $89,900 Active 90 DOM
-
2026-06-02days on market $89,900 Active 89 DOM
-
2026-06-01days on market $89,900 Active 88 DOM
-
2026-05-31days on market $89,900 Active 87 DOM
-
2026-05-31days on market $89,900 Active 86 DOM
-
2026-05-19price $89,900 214-char remark
Show marketing remark (214 chars)
So much potential here! This 2 bedroom rambler is located on a corner lot in the heart of town. There is new flooring in the living/dining room. The basement has a radon mitigation system. New vinyl siding in 2025.
-
2026-03-05$99,900 Active 214-char remark
Show marketing remark (214 chars)
So much potential here! This 2 bedroom rambler is located on a corner lot in the heart of town. There is new flooring in the living/dining room. The basement has a radon mitigation system. New vinyl siding in 2025.
-
2006-12-13soldstatus $56,300
-
2005-07-01soldstatus $45,000
ⓘ Source: listings_history table (triggers on properties + properties_extension) + one-shot
backfill from property_details.listing_events for pre-trigger history.
Tax reassessment forecast MN · Partial reset (capped growth)
- Current annual tax
- $1,136 · $95/mo
- Projected year-2 tax
- $1,136 · $95/mo
- Expected delta
- $0/yr ($0/mo · 0.0%)
ⓘ Screening estimate from a state-policy table — verify with the county assessor before closing.
Climate risk First Street
- Flood 1/10 Low FEMA zone X · 0% chance over 30 yrs
- Wildfire 1/10 Low
- Heat 2/10 Low 7 d/yr ≥98°F today · 15 d/yr by 30 yrs out
- Wind 2/10 Low
- Air quality 2/10 Low 0 unhealthy d/yr today · 1 by 30 yrs out
Nearby sold comps map
Loading sold comps map…
Walkable amenities ~0.75 mi
Loading nearby amenities…
Taxation est. · year 1
- Rental income
- $12,094
- − Mortgage interest
- −$5,036
- − Property taxes
- −$1,136
- − Insurance
- −$450
- − Repairs & maintenance
- −$968
- − Management
- −$968
- − Depreciation
- −$2,615
- Taxable income
- $922
- Est. tax owed @ 24.0%
- −$221
- After-tax cash flow
- $2,090/yr
For passive investors: Depreciation is non-cash, so a rental often shows a tax loss while cash-flowing — sheltering income. Rental losses are passive: they offset passive income freely, and up to $25,000/yr can offset ordinary (W-2) income if you actively participate and your MAGI is under $100k (phasing out to $0 by $150k); unused losses carry forward. On sale, claimed depreciation is recaptured at up to 25%, and gains may owe capital-gains tax (a 1031 exchange can defer both). Figures are a year-1 estimate at your 24.0% rate — not tax advice; consult a CPA.
Schools (NCES district)
- District
- Fairmont Area School District
- NCES district ID
- 2700124
- Math proficiency
- 45% ▼ -13.00%
- Reading proficiency
- 51% ▼ -7.00%
- Median HH income
- $46,280
- Composite
- 40.76/100
- National rank
- #3648
- State rank
- #148 of 301 in MN
Livability — Fairmont
- Score
- 68/100
- State rank
- #407
- US rank
- #9480
Category grades
Schools grade is shown separately in the Schools card above.
Census & demographics
- Census place
- Fairmont, MN
- City population
- 11,800
- Population (ZIP)
- 11,800
Population outlook (Martin County) Hauer SSP2
- Today (2025)
- 18,583 people
- By 2030
- 17,814 · -4.1%
- By 2040
- 16,312 · -12.2%
- By 2050
- 15,021 · -19.2%
- By 2075
- 13,025 · -29.9%
- By 2100
- 11,311 · -39.1%
Race, ethnicity, and origin ACS 2023
- Neighborhood character
- Predominantly White (87%)
- Race & ethnicity
- White 87% Hispanic / Latino 8% Two or more races 3%
- Hispanic origin (detail)
- Mexican 7%
- Common ancestry
- Portuguese 11% Romanian 6% Italian 2%
- Foreign-born
- 3% · Canada, China
- Languages at home
- 93% English-only · Spanish 5%
Political lean MEDSL · Martin
- 2024 margin
- Solid R (+39.7) · D 29.5% · R 69.1% · Other 1.4%
- 2008→2024 swing
- -24.4pp toward R · 2008: -15.2pp · 2024: -39.7pp
- All cycles
- 2024: R+39.7 2020: R+37.9 2016: R+41.4 2012: R+23.8 2008: R+15.2
Not yet ingested
- Civics
- —
Market trends
- HPI YoY
- ▼ -143.34%
- Current HPI
- 191.514
- Rent YoY
- —
- Metro
- —
- State GDP YoY
- ▲ 2.41%
- F500 in state
- 34
Industry mix (Fortune 500 HQ in MN)
| Industry | F500 HQs | Revenue |
|---|---|---|
| Healthcare | 2 | $407B |
|
||
| Retail | 2 | $150B |
|
||
| Consumer Goods | 2 | $32B |
|
||
| Industrial Machinery | 2 | $6B |
|
||
| Agriculture | 1 | $40B |
|
||
| Healthcare / Medical Devices | 1 | $32B |
|
||
Price history
+99.8% since first listed4 events — show timeline
- 2026-05-19 Price Changed $89,900 NORTHSTARMLS as Distributed by MLS Grid
- 2026-03-05 Listed $99,900 NORTHSTARMLS as Distributed by MLS Grid
- 2006-12-13 Sold (Public Records) $56,300 Public Records
- 2005-07-01 Sold (Public Records) $45,000 Public Records
Property tax history
+4.1%/yrLatest (2025): $1,136 · -7.3% YoY. Source: county tax records.
Cash-flow waterfall
monthlySold comps — $/sqft
last 12 mo · ≤1 miLoading sold comps…