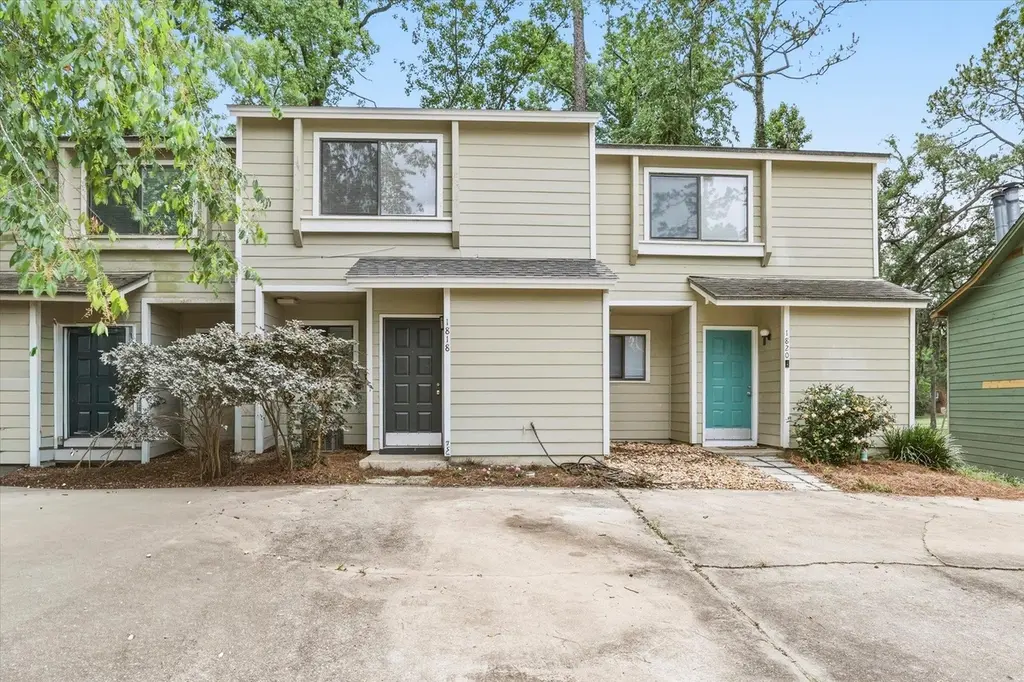
1818 Nicklaus Dr · Tallahassee, FL
Flood risk 1/10 · Minimal
- FEMA flood zone
- X (unshaded)
- Chance of flooding over 30 yrs
- 0.0%
- Est. flood insurance / yr
- $507 – $1,088
Fire risk 4/10 · Minor
- Est. fire insurance / yr
- $947 – $1,759
Heat risk 8/10 · Major
- Hot days now (above 108°F)
- 7 days/yr
- Hot days in 30 yrs
- 20 days/yr
Wind risk 9/10 · Severe
- Chance of severe wind over 30 yrs
- 99.0%
Air-quality risk 4/10 · Minor
- Unhealthy air days now
- 6 days/yr
- Unhealthy air days in 30 yrs
- 7 days/yr
Risk factors via First Street. Map © Google.
Why this score? — see what drove the F grade
The composite is a weighted blend of 9 inputs, each scored 0–100. Each bar is that input's sub-score; the figure is the points it added to the 100-point composite (weight × sub-score).
- Cash flow +11.6/30.0
- Schools +4.3/10.0
- Livability +4.3/5.0
- Rent growth +3.5/5.0
- DSCR +3.4/10.0
- 1% rule +3.2/10.0
- Condition / age +2.5/5.0
- ARV discount +0.0/15.0
- Appreciation +0.0/10.0
$170,000
🖨 Deal sheet (PDF) 📄 Offer letter ✓ Due diligence
Listing remarks
Great 2 bed/2.5 bath townhome on Hilaman Golf Course. All LVP flooring, fresh paint, clean and move-in ready. Each bedroom has it's own full bathroom, fireplace, attached laundry room that includes washer/dryer. Kitchen with granite counter tops, bar, stainless appliances, recent cabinets and pass through opens nicely into the large living room with fireplace and sliding door providing plenty of natural light and golf course view. No HOA dues! The roof replaced April 2026!
Key facts
- Parking
- Built 1984
- Listed 27 days
Property features AI
Exterior
- Parking: Driveway
- Utilities: Public sewer
- Home design: 2 stories; Fiber cement construction
- Construction: Fiber cement construction
- Exterior features: Deck; Patio; Near golf course; Public maintained paved road; Has view
Interior
- Kitchen: Dishwasher; Microwave; Refrigerator; Stove
- Bedrooms: Bedroom 2 (12x2)
- Flooring: Plank flooring; Vinyl flooring
- Bathrooms: 2 full bathrooms; 1 half bathroom
- Heating & cooling: Central heating; Electric heating; Heat pump heating; Wood heating; Central air conditioning; Electric cooling; Heat pump cooling
- Interior features: Upper level primary bedroom; Fireplace
- Laundry & utility: Washer; Dryer; Utility room
Neighborhood map
What this means for you Summary
Snapshot
- This is a 2-bed/2.5-bath townhouse listed at $170k.
Deal economics
- At list price, monthly cash flow is $-52 ($-623/yr) — negative.
- To cash-flow at today's rent, offer at most $161k (5.4% below list).
- To meet the 1% rule (rent ≥ 1% of price), the offer needs to be $140k (17.5% below list).
- Recommended offer: $140k (17.5% below list) — sets the bar for 1% rule.
- Cap rate 5.9% vs local median 4.2% in Tallahassee — top-decile yield for the area; either an underpriced asset or a hidden risk that comps aren't pricing in. Stress-test before assuming the spread holds.
Location & tenants
- Location reads 86/100 on livability (#19 in FL, #429 nationally) — a professional / high-income tenant draw. Strengths: amenities A+, commute A+, health & safety A+; Watch: employment D.
- Leon (urban): math 48% / reading 53% proficiency, ranked #33 of 73 in FL (top 45%) — acceptable for families but not a draw, mixed tenant base, ~2y average lease.
- Zoned schools: J Michael Conley Elementary School At Southwood (math 44% / reading 52%, grade D, #1,171 of 2,144 statewide, top 55%, 657 students, 47% FRL); Fairview Middle School (math 44% / reading 46%, grade D, #310 of 571 statewide, top 56%, 747 students, 58% FRL); James Rickards High School (math 23% / reading 37%, grade F, #441 of 667 statewide, top 67%, 1,581 students, 57% FRL).
- Market conditions: Rents rising fast (+4.2%/yr); 121 active listings in the ZIP; 17 comparable units currently listed for rent nearby; rentals at typical pace (median 15d on market — plan ~3-4 weeks tenant-placement turnaround); 1,765 units permitted in Leon County in 2024 (975 in 5+ unit buildings).
- This rent runs 33% of the median local income ($51k/yr) — at the standard rent-burdened threshold; future hikes will face affordability resistance.
Forward outlook
- Local home prices are declining (-3.0%/yr); year-one equity from $1k of loan paydown is wiped out by about $5k of value loss. Plan a longer hold.
- Leon County population projected at +23% by 2050 — long-run rental-demand tailwind backs the buy-and-hold thesis.
Negotiation context
- It's been on market 27 days — a 2% lower offer ($167k) is reasonable based on typical stale-listing flexibility.
- 2 sale attempts with the ask held roughly flat each time — persistent listings suggest the price (not the market) is what's stuck; bring a comps-based counter.
- Current owner paid $68k; list at $170k implies a 149% gain — meaningful room to come down on a strong offer.
Risks & watch-outs
- Climate carrying-cost: severe wind risk, 99% chance of damaging wind over 30y; extreme-heat days projected 7→20/yr by 2055 (HVAC capex compounding) — expect insurance premiums to compound above CPI over the hold.
Questions for the listing agent
- What do current leases actually rent for vs. the listed asking? Can we see a recent rent roll and the last 12 months of T-12 income?
- Is there a deadline driving the sale (1031 exchange, divorce, estate, relocation)? That informs how much negotiation room exists.
- Schools are B-rated — typically a magnet for longer-tenancy family renters. What's the average tenant stay here, and is there a school-zone premium baked into asking?
- The area grade is low — what's the realistic commute time and amenity access for the typical tenant pool here? Any planned neighborhood developments (good or bad) we should know about?
- What's the average days-on-market for RENTAL listings here right now (not sales)? A rising rental-DOM trend means longer vacancies and softer asking-rent achievability than the comps imply.
- What's the recent tenant-quality profile in this submarket — average credit score on applications, eviction rate, late-payment / NSF rate, and stable-employment percentage? A property-management company in the area should have these aggregated.
- How much new for-sale + rental construction is in the pipeline within 1–3 miles? Heavy new supply typically softens prices + rents 12–24 months out; constrained supply supports both.
Investment metrics
- 1% rule
- 0.82% ✗
- Cap rate
- 5.93%
- Cash-on-cash
- -1.31%
- DSCR
- 0.94
- GRM
- 10.1
CMA / ARV
- ARV (on-the-fly)
- $140,718
- Comps found
- 11
Show comp detail 11 sales within ~0.75 mi
| Address | Dist | Beds/Ba | Sqft | Sold | Price | $/sf | Match |
|---|---|---|---|---|---|---|---|
| 3146 Oak Hammock Ln | 0.09mi | 2/2.0 | 1,020 (+2%) | 7mo | $172,500 | $169 | 84 |
| 1998 Nicklaus Dr | 0.12mi | 2/2.5 | 973 (-2%) | 9mo | $85,000 | $87 | 83 |
| 3104 Oak Hammock Ln | 0.11mi | 2/1.5 | 924 (-7%) | 2mo | $150,000 | $162 | 77 |
| 1561 Jacks Dr Unit B | 0.41mi | 2/2.5 | 1,024 (+3%) | 2mo | $144,000 | $141 | 75 |
| 3101 Oak Hammock Ct Unit B | 0.09mi | 2/2.0 | 1,020 (+2%) | 19mo | $129,000 | $126 | 74 |
| 1903 Larette Dr | 0.41mi | 2/2.5 | 1,026 (+3%) | 12mo | $178,000 | $173 | 66 |
| 1815 Nicklaus Dr Unit E | 0.04mi | 2/2.0 | 1,094 (+10%) | 18mo | $115,000 | $105 | 65 |
| 1970 Nicklaus Dr Unit B | 0.10mi | 2/2.0 | 1,096 (+10%) | 14mo | $135,000 | $123 | 65 |
| 1573 Jacks Dr Unit B | 0.37mi | 2/2.5 | 1,024 (+3%) | 17mo | $177,000 | $173 | 64 |
| 1815 Nickalus Unit F | 0.04mi | 2/2.0 | 1,094 (+10%) | 20mo | $142,500 | $130 | 64 |
| 1685 Kay Ave | 0.24mi | 2/1.5 | 1,122 (+12%) | 15mo | $173,500 | $155 | 51 |
Match score weights: distance 35% · size 25% · config 20% · recency 20%. Top-matched comps best support the ARV.
Projected returns pro-forma
-3.0% appreciation · 4.16% rent growth · sell at horizon
- IRR
- -17.2%
- Equity multiple
- 0.39×
- Total profit
- $-29,187
- Equity at exit
- $25,348
- IRR
- -7.1%
- Equity multiple
- 0.52×
- Total profit
- $-22,672
- Equity at exit
- $14,698
Cash invested: $47,600 (down + closing). Projections, not guarantees.
Landlord ↔ Tenant lean methodology
- Overall (STATE)
- 87 Strongly Landlord-Friendly
- State Florida
- 87 Strongly Landlord-Friendly · R+3
- County
- — inherits STATE
- City
- — inherits STATE
ZIP-level market 32301
- Rents YoY
- 4.2%
- Active inventory
- 121
- Price-to-rent
- 10.1×
Monthly cashflow live
- Estimated rent
- $1,402 high interval (Pro) →
- Mortgage (P&I)
- −$891
- Tax from tax record
- −$197 /mo · $2,365/yr
- Insurance
- −$71
- HOA
- −$0
- Vacancy / Maint / Mgmt
- −$294
- Net cashflow
- $-52
Break-even live
Sensitivity live
| Price | -10% $44 | -5% $-4 | +0% $-52 | +5% $-100 | +10% $-148 |
|---|---|---|---|---|---|
| Rent | -10% $-163 | -5% $-107 | +0% $-52 | +5% $3 | +10% $59 |
| Rate | -1.0pp $34 | -0.5pp $-9 | base $-52 | +0.5pp $-96 | +1.0pp $-141 |
UW: 25.0% down · 7.5% · 30yr · 1.5% tax · 5.0% vac · 8.0% maint · 8.0% mgmt
Financing live
Cash to close
- Down payment
- $42,500
- Closing costs
- $5,100
- Reserves months
- —
- Total cash needed
- —
Loan-product check · same deal, 3 products live
Conventional
25% down · 7.5% · 30yr
- Down + closing
- —
- Monthly P&I
- —
- Monthly cashflow
- —
- DSCR
- —
- Eligible?
- —
Personal DTI + credit; lowest rate.
DSCR
20% down · 8.5% · 30yr
- Down + closing
- —
- Monthly P&I
- —
- Monthly cashflow
- —
- DSCR
- —
- Eligible?
- —
No personal income docs; deal must DSCR.
Hard money
10% down · 12.0% · 12mo
- Down + closing
- —
- Monthly P&I
- —
- Monthly cashflow
- —
- DSCR
- —
- Eligible?
- —
Short-term bridge; refi at stabilization.
Rent comps 17 comps
| Address | Beds | Baths | Sqft | Rent | $/sqft | DOM | Units | Dist |
|---|---|---|---|---|---|---|---|---|
| 1412 Ramble Brk Unit C Tallahassee, FL | 2.0 | 1.0 | 950 | $1,050 | $1.11 | 22d | 1 | 0.32mi |
| 1411 Lazy Brk Unit D Tallahassee, FL | 2.0 | 1.0 | 950 | $1,150 | $1.21 | 22d | 1 | 0.32mi |
| 1872 Darryl Dr Tallahassee, FL | 2.0 | 2.0 | 1062 | $1,500 | $1.41 | 22d | 1 | 0.36mi |
| 2221 Orange Ave E Tallahassee, FL | 1.0–3.0 | 1.0–2.0 | 1007 | $1,884 | $1.87 | 15d | 28 | 0.39mi |
| 1539 Paul Russell Rd Tallahassee, FL | 1.0 | 1.0 | 800 | $950 | $1.19 | 22d | 1 | 0.54mi |
| 2074 Midyette Rd Tallahassee, FL | 2.0–3.0 | 2.0 | 1033 | $899 | $0.87 | 15d | 1 | 0.54mi |
| 2400 Barcelona Ct Tallahassee, FL | 3.0 | 2.0 | 1080 | $1,600 | $1.48 | 15d | 1 | 0.66mi |
| 3501 S Blair Stone Rd Tallahassee, FL | 1.0–3.0 | 1.0–2.0 | 1190 | $1,680 | $1.41 | 15d | 10 | 0.71mi |
| 2001 Old Saint Augustine Rd Tallahassee, FL | 1.0–2.0 | 1.0–2.0 | 875 | $1,436 | $1.64 | 15d | 11 | 0.76mi |
| 1453 Fisher Ln Unit 1453 Tallahassee, FL | 2.0 | 1.0 | 674 | $1,600 | $2.37 | 22d | 1 | 0.80mi |
| 3450 S Blair Stone Rd Tallahassee, FL | 1.0–3.0 | 1.0–2.0 | 943 | $1,750 | $1.86 | 15d | 25 | 0.86mi |
| 3550 Esplanade Way Tallahassee, FL | 1.0–3.0 | 1.0–2.0 | 1031 | $1,802 | $1.75 | 15d | 27 | 0.86mi |
| 2750 Old Saint Augustine Rd Tallahassee, FL | 1.0–3.0 | 1.0–2.0 | 1230 | $1,589 | $1.29 | 22d | 2 | 0.97mi |
| 2873 Jim Lee Rd Tallahassee, FL | 2.0 | 2.0 | 1000 | $925 | $0.93 | 22d | 1 | 1.13mi |
| 2850 Apalachee Pkwy Tallahassee, FL | 1.0 | 1.0 | 750 | $1,395 | $1.86 | 15d | 46 | 1.15mi |
| 3700 Capital Cir SE Tallahassee, FL | 1.0–3.0 | 1.0–2.0 | 1113 | $1,653 | $1.48 | 15d | 52 | 1.22mi |
| 501 S Blair Stone Rd Tallahassee, FL | 1.0–3.0 | 1.0–2.0 | 1080 | $1,470 | $1.36 | 22d | 1 | 1.48mi |
Listing history 22 events
-
2026-06-22days on market $170,000 Active 27 DOM
-
2026-06-18days on market $170,000 Active 24 DOM
-
2026-06-17days on market $170,000 Active 23 DOM
-
2026-06-16days on market $170,000 Active 22 DOM
-
2026-06-15days on market $170,000 Active 21 DOM
-
2026-06-14days on market $170,000 Active 19 DOM
-
2026-06-10days on market $170,000 Active 16 DOM
-
2026-06-09days on market $170,000 Active 15 DOM
-
2026-06-08days on market $170,000 Active 14 DOM
-
2026-06-07days on market $170,000 Active 13 DOM
-
2026-06-05days on market $170,000 Active 10 DOM
-
2026-06-03days on market $170,000 Active 9 DOM
-
2026-06-02days on market $170,000 Active 8 DOM
-
2026-06-01days on market $170,000 Active 7 DOM
-
2026-05-31days on market $170,000 Active 6 DOM
-
2026-05-30days on market $170,000 Active 5 DOM
-
2026-05-25status Active
-
2026-05-21historical
-
2026-05-07$170,000
-
2004-05-21soldstatus $68,400
-
2001-04-01soldstatus $165,000
-
2001-04-01soldstatus $165,000
ⓘ Source: listings_history table (triggers on properties + properties_extension) + one-shot
backfill from property_details.listing_events for pre-trigger history.
Tax reassessment forecast FL · Resets to sale price
- Current annual tax
- $2,365 · $197/mo
- Projected year-2 tax
- $2,365 · $197/mo
- Expected delta
- $0/yr ($0/mo · 0.0%)
ⓘ Screening estimate from a state-policy table — verify with the county assessor before closing.
Climate risk First Street
- Flood 1/10 Low FEMA zone X (unshaded) · 0% chance over 30 yrs
- Wildfire 4/10 Moderate
- Heat 8/10 Severe 7 d/yr ≥108°F today · 20 d/yr by 30 yrs out
- Wind 9/10 Extreme 99% chance of damaging wind over 30 yrs
- Air quality 4/10 Moderate 6 unhealthy d/yr today · 7 by 30 yrs out
Nearby sold comps map
Loading sold comps map…
Walkable amenities ~0.75 mi
Loading nearby amenities…
Taxation est. · year 1
- Rental income
- $16,823
- − Mortgage interest
- −$9,523
- − Property taxes
- −$2,365
- − Insurance
- −$850
- − Repairs & maintenance
- −$1,346
- − Management
- −$1,346
- − Depreciation
- −$4,945
- Taxable loss
- −$3,552
- Est. tax savings @ 24.0%
- +$852
- After-tax cash flow
- $229/yr
For passive investors: Depreciation is non-cash, so a rental often shows a tax loss while cash-flowing — sheltering income. Rental losses are passive: they offset passive income freely, and up to $25,000/yr can offset ordinary (W-2) income if you actively participate and your MAGI is under $100k (phasing out to $0 by $150k); unused losses carry forward. On sale, claimed depreciation is recaptured at up to 25%, and gains may owe capital-gains tax (a 1031 exchange can defer both). Figures are a year-1 estimate at your 24.0% rate — not tax advice; consult a CPA.
Schools (NCES district)
- District
- Leon
- NCES district ID
- 1201110
- Math proficiency
- 48% ▼ -13.00%
- Reading proficiency
- 53% ▼ -5.00%
- Median HH income
- $46,339
- Composite
- 42.84/100
- National rank
- #3131
- State rank
- #33 of 73 in FL
Livability — Tallahassee
- Score
- 86/100
- State rank
- #19
- US rank
- #429
Category grades
Schools grade is shown separately in the Schools card above.
Census & demographics
- Census place
- Tallahassee, FL
- County
- Leon County · 294,472 people
- City population
- 294,472
- Metro
- Tallahassee, FL
- Population (ZIP)
- 32,017
- Household income
- $50,942
- Rent vs Own
- Severe rent burden
- 2625.0
Population outlook (Leon County) Hauer SSP2
- Today (2025)
- 315,507 people
- By 2030
- 330,677 · +4.8%
- By 2040
- 358,465 · +13.6%
- By 2050
- 386,804 · +22.6%
- By 2075
- 465,480 · +47.5%
- By 2100
- 519,959 · +64.8%
Race, ethnicity, and origin ACS 2023
- Neighborhood character
- Diverse neighborhood (Simpson 0.61)
- Race & ethnicity
- Black 49% White 38% Hispanic / Latino 6% Two or more races 6% Asian 3%
- Hispanic origin (detail)
- Puerto Rican 1% Cuban 1%
- Common ancestry
- Slovak 2% Romanian 1% Lithuanian 1%
- Foreign-born
- 7% · Canada, China, Vietnam
- Languages at home
- 91% English-only · Spanish 4% Other Indo-European 1% French/Haitian/Cajun 1%
Political lean MEDSL · Leon
- 2024 margin
- Strong D (+21.8) · D 60.3% · R 38.5% · Other 1.2%
- 2008→2024 swing
- -2.5pp toward R · 2008: 24.3pp · 2024: 21.8pp
- All cycles
- 2024: D+21.8 2020: D+28.3 2016: D+25.1 2012: D+23.6 2008: D+24.3
Not yet ingested
- Civics
- —
Market trends
- HPI YoY
- ▼ -231.50%
- Current HPI
- 231.103
- Rent YoY
- ▲ 4.16%
- Metro
- Tallahassee, FL
- State GDP YoY
- ▲ 3.28%
- F500 in state
- 36
Industry mix (Fortune 500 HQ in FL)
| Industry | F500 HQs | Revenue |
|---|---|---|
| Industrial Technology | 2 | $29B |
|
||
| Insurance | 2 | $17B |
|
||
| Retail | 1 | $60B |
|
||
| Technology Distribution | 1 | $58B |
|
||
| Homebuilding | 1 | $35B |
|
||
| Technology Manufacturing | 1 | $35B |
|
||
Price history
+3.0% since first listed6 events — show timeline
- 2026-05-25 Relisted — CATRS
- 2026-05-21 Listing Removed — CATRS
- 2026-05-07 Listed $170,000 CATRS
- 2004-05-21 Sold (Public Records) $68,400 Public Records
- 2001-04-01 Sold (Public Records) $165,000 Public Records
- 2001-04-01 Sold (Public Records) $165,000 Public Records
Property tax history
+6.5%/yrLatest (2025): $2,365 · +10.4% YoY. Source: county tax records.
Cash-flow waterfall
monthlySold comps — $/sqft
last 12 mo · ≤1 miLoading sold comps…