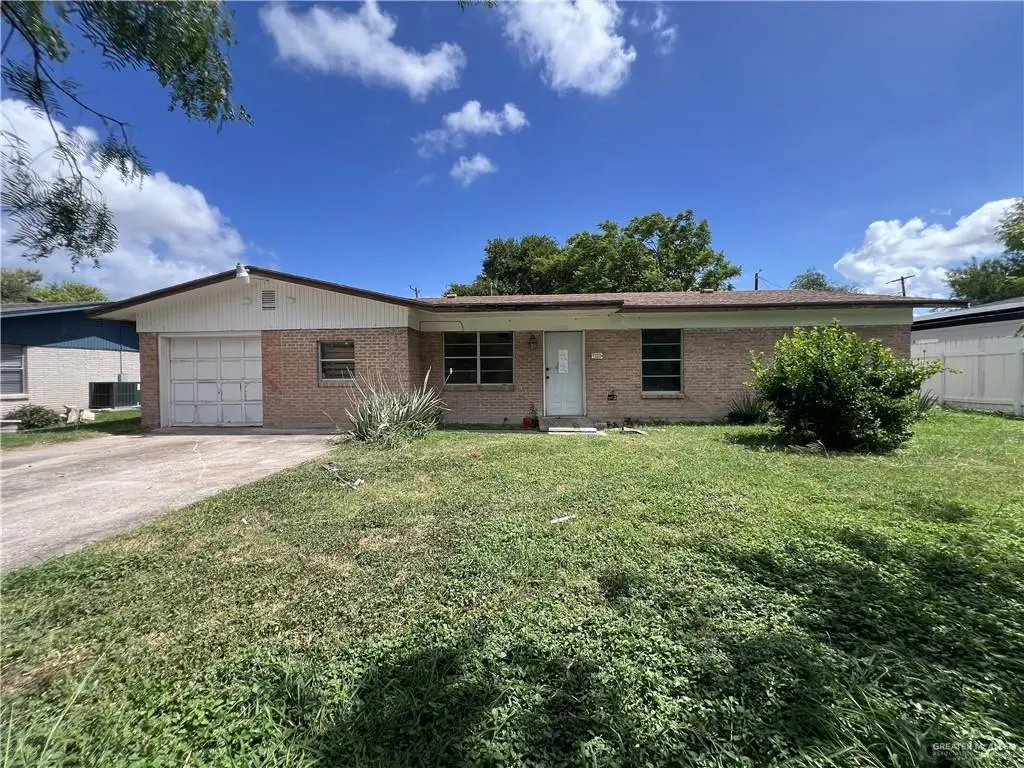
1920 Westway Ave · McAllen, TX
Flood risk 6/10 · Moderate
- FEMA flood zone
- X (shaded)
- Chance of flooding over 30 yrs
- 0.73%
- Est. flood insurance / yr
- $507 – $1,088
Fire risk 1/10 · Minimal
- Est. fire insurance / yr
- $1,222 – $2,270
Heat risk 9/10 · Severe
- Hot days now (above 111°F)
- 7 days/yr
- Hot days in 30 yrs
- 22 days/yr
Wind risk 8/10 · Major
- Chance of severe wind over 30 yrs
- 99.0%
Air-quality risk 3/10 · Minor
- Unhealthy air days now
- 1 days/yr
- Unhealthy air days in 30 yrs
- 4 days/yr
Risk factors via First Street. Map © Google.
Why this score? — see what drove the C+ grade
The composite is a weighted blend of 9 inputs, each scored 0–100. Each bar is that input's sub-score; the figure is the points it added to the 100-point composite (weight × sub-score).
- Cash flow +20.2/30.0
- ARV discount +15.0/15.0
- DSCR +6.4/10.0
- 1% rule +6.2/10.0
- Livability +3.8/5.0
- Schools +3.3/10.0
- Rent growth +2.9/5.0
- Condition / age +2.5/5.0
- Appreciation +0.0/10.0
$145,000
🖨 Deal sheet (PDF) 📄 Offer letter ✓ Due diligence
Listing remarks
SOLD AS IS! Unlock the potential of this 3-bedroom, 2-bathroom home conveniently located near Expressway 83 and just minutes from McAllen International Airport, La Plaza Mall, medical facilities, entertainment, shopping, and restaurants. Offering tremendous potential, this property is a great opportunity for investors or buyers looking to renovate and customize a home to their preferences. With the right vision and updates, this home can truly shine. Don't miss this opportunity!
Key facts
- 8,583 sq ft lot
- 2 garage spots
- Built 1986
Property features AI
Finance
- Other: Lot approximately 0.197 acre; Building area 1,545 square feet; Directions: From N 23rd St, turn east onto Westway Ave and proceed straight for a few blocks into the neighborhood. The property will be on the left (north) side before N Bicentennial Blvd.
- HOA & community: No homeowners association; Curbs in the community
Exterior
- Parking: Attached garage; 2 total parking spaces (2 covered, 2 garage spaces); Garage faces front
- Utilities: Public water; City sewer; Electric power
- Home design: Brick construction; Shingle roof; Slab foundation
- Construction: Brick exterior; Shingle roof; Slab foundation
- Exterior features: Chain link fencing; Alley access; Paved road; Other exterior features
Interior
- Kitchen: Electric water heater; No conveying appliances
- Bedrooms: Primary bedroom with sitting area; Two living areas
- Flooring: Tile
- Bathrooms: 2 full bathrooms
- Heating & cooling: Central heating (electric); Central air conditioning (electric)
- Interior features: Entrance foyer; Tile countertops; Ceiling fans; No window coverings
- Laundry & utility: Laundry room with washer/dryer connections
Neighborhood map
What this means for you Summary
Snapshot
- This is a 3-bed/2.0-bath single-family listed at $145k.
Deal economics
- At list price, monthly cash flow is $183 ($2k/yr) — positive.
- The deal already cash-flows at list — no discount required.
- Meets the 1% rule at list price ($2k rent vs $145k).
- Cap rate 7.8% vs local median 3.7% in McAllen — top-decile yield for the area; either an underpriced asset or a hidden risk that comps aren't pricing in. Stress-test before assuming the spread holds.
Location & tenants
- Location reads 76/100 on livability (#119 in TX, #3,771 nationally) — a middle-class / working-renter tenant base. Strengths: cost of living A+, housing A+, health & safety A+; Watch: employment D, amenities F, commute F.
- Mcallen ISD (urban): math 34% / reading 45% proficiency, ranked #440 of 826 in TX (top 53%) — families likely to look elsewhere, expect single-tenant / working-renter base with shorter leases.
- Zoned schools: Mcauliffe El (math 17% / reading 32%, grade F, #3,052 of 4,322 statewide, top 74%, 413 students, 84% FRL); Travis Middle (math 16% / reading 28%, grade F, #1,360 of 1,662 statewide, top 83%, 516 students, 96% FRL); Mcallen H S (math 30% / reading 57%, grade F, #704 of 1,632 statewide, top 43%, 2,133 students, 63% FRL) — zoned schools average 81% FRL vs 50% district-wide (31 pts higher); higher-poverty schools than district average — tighter screening recommended.
- Market conditions: Rents rising (+1.8%/yr); 390 active listings in the ZIP; 40 comparable units currently listed for rent nearby; rentals at typical pace (median 26d on market — plan ~3-4 weeks tenant-placement turnaround); 48% of comp listings sitting > 30 days — soft ceiling on asking rent; 7,378 units permitted in Hidalgo County in 2024 (641 in 5+ unit buildings).
- This rent runs 41% of the median local income ($48k/yr) — at the standard rent-burdened threshold; future hikes will face affordability resistance.
Forward outlook
- Local home prices are declining (-3.0%/yr); year-one equity from $1k of loan paydown is wiped out by about $4k of value loss. Plan a longer hold.
- Hidalgo County population projected at +28% by 2050 — long-run rental-demand tailwind backs the buy-and-hold thesis.
Negotiation context
- Only 9 days on market — expect competitive offers; lowballing is unlikely to land.
Risks & watch-outs
- Climate carrying-cost: major flood risk; severe wind risk, 99% chance of damaging wind over 30y; extreme-heat days projected 7→22/yr by 2055 (HVAC capex compounding) — expect insurance premiums to compound above CPI over the hold.
Questions for the listing agent
- Is there a deadline driving the sale (1031 exchange, divorce, estate, relocation)? That informs how much negotiation room exists.
- Schools are B-rated — typically a magnet for longer-tenancy family renters. What's the average tenant stay here, and is there a school-zone premium baked into asking?
- What's the average days-on-market for RENTAL listings here right now (not sales)? A rising rental-DOM trend means longer vacancies and softer asking-rent achievability than the comps imply.
- What's the recent tenant-quality profile in this submarket — average credit score on applications, eviction rate, late-payment / NSF rate, and stable-employment percentage? A property-management company in the area should have these aggregated.
- How much new for-sale + rental construction is in the pipeline within 1–3 miles? Heavy new supply typically softens prices + rents 12–24 months out; constrained supply supports both.
Investment metrics
- 1% rule
- 1.12% ✓
- Cap rate
- 7.81%
- Cash-on-cash
- 5.41%
- DSCR
- 1.24
- GRM
- 7.4
CMA / ARV
- ARV (on-the-fly)
- $227,115
- Comps found
- 12
Show comp detail 12 sales within ~0.75 mi
| Address | Dist | Beds/Ba | Sqft | Sold | Price | $/sf | Match |
|---|---|---|---|---|---|---|---|
| 2209 Harvey St | 0.27mi | 3/2.0 | 1,480 (-4%) | 3mo | $190,000 | $128 | 78 |
| 2213 Highland Ave | 0.24mi | 3/2.0 | 1,659 (+7%) | 2mo | $235,000 | $142 | 75 |
| 2120 Camilla Ln | 0.29mi | 3/2.0 | 1,622 (+5%) | 10mo | $220,000 | $136 | 70 |
| 2001 W Jonquil Ave | 0.69mi | 3/2.5 | 1,535 (-1%) | 2mo | $225,000 | $147 | 63 |
| 2208 Daffodil Ave | 0.36mi | 3/2.0 | 1,716 (+11%) | 5mo | $259,000 | $151 | 60 |
| 3101 N 27th St N | 0.74mi | 3/2.0 | 1,606 (+4%) | 0mo | $220,000 | $137 | 58 |
| 1117 Highland Ave | 0.56mi | 2/2.0 (-1) | 1,621 (+5%) | 12mo | $249,000 | $154 | 51 |
| 2108 W Hibiscus Ave | 0.56mi | 3/2.0 | 1,360 (-12%) | 11mo | $208,000 | $153 | 44 |
| 1412 W Gardenia Ave | 0.60mi | 3/2.0 | 1,364 (-12%) | 10mo | $229,000 | $168 | 44 |
| 1920 Iris Ave | 0.60mi | 3/2.0 | 1,759 (+14%) | 8mo | $215,000 | $122 | 42 |
| 1111 Sycamore Ave | 0.71mi | 3/2.0 | 1,364 (-12%) | 11mo | $120,000 | $88 | 38 |
| 1900 N 13th 1/2 St | 0.58mi | 2/1.0 (-1) | 1,319 (-15%) | 9mo | $199,900 | $152 | 32 |
Match score weights: distance 35% · size 25% · config 20% · recency 20%. Top-matched comps best support the ARV.
Projected returns pro-forma
-3.0% appreciation · 1.78% rent growth · sell at horizon
- IRR
- -9.4%
- Equity multiple
- 0.66×
- Total profit
- $-13,723
- Equity at exit
- $21,620
- IRR
- -1.7%
- Equity multiple
- 0.89×
- Total profit
- $-4,481
- Equity at exit
- $12,537
Cash invested: $40,600 (down + closing). Projections, not guarantees.
Landlord ↔ Tenant lean methodology
- Overall (STATE)
- 87 Strongly Landlord-Friendly
- State Texas
- 87 Strongly Landlord-Friendly · R+5
- County
- — inherits STATE
- City
- — inherits STATE
ZIP-level market 78501
- Home prices YoY
- -23.3%
- Rents YoY
- 1.8%
- Active inventory
- 390
- Price-to-rent
- 7.4×
Monthly cashflow live
- Estimated rent
- $1,624 high interval (Pro) →
- Mortgage (P&I)
- −$760
- Tax from tax record
- −$279 /mo · $3,354/yr
- Insurance
- −$60
- HOA
- −$0
- Vacancy / Maint / Mgmt
- −$341
- Net cashflow
- $183
Break-even live
Sensitivity live
| Price | -10% $265 | -5% $224 | +0% $183 | +5% $142 | +10% $101 |
|---|---|---|---|---|---|
| Rent | -10% $55 | -5% $119 | +0% $183 | +5% $247 | +10% $311 |
| Rate | -1.0pp $256 | -0.5pp $220 | base $183 | +0.5pp $145 | +1.0pp $107 |
UW: 25.0% down · 7.5% · 30yr · 1.5% tax · 5.0% vac · 8.0% maint · 8.0% mgmt
Financing live
Cash to close
- Down payment
- $36,250
- Closing costs
- $4,350
- Reserves months
- —
- Total cash needed
- —
Loan-product check · same deal, 3 products live
Conventional
25% down · 7.5% · 30yr
- Down + closing
- —
- Monthly P&I
- —
- Monthly cashflow
- —
- DSCR
- —
- Eligible?
- —
Personal DTI + credit; lowest rate.
DSCR
20% down · 8.5% · 30yr
- Down + closing
- —
- Monthly P&I
- —
- Monthly cashflow
- —
- DSCR
- —
- Eligible?
- —
No personal income docs; deal must DSCR.
Hard money
10% down · 12.0% · 12mo
- Down + closing
- —
- Monthly P&I
- —
- Monthly cashflow
- —
- DSCR
- —
- Eligible?
- —
Short-term bridge; refi at stabilization.
Rent comps 40 comps
| Address | Beds | Baths | Sqft | Rent | $/sqft | DOM | Units | Dist |
|---|---|---|---|---|---|---|---|---|
| 1900 La Vista Ave McAllen, TX | 4.0 | 2.0 | 1410 | $2,400 | $1.70 | 45d | 1 | 0.09mi |
| 1516 Walnut Ave McAllen, TX | 4.0 | 2.0 | 2188 | $1,495 | $0.68 | 45d | 1 | 0.31mi |
| 3207 N 20th St McAllen, TX | 3.0 | 2.0 | 1627 | $2,200 | $1.35 | 45d | 1 | 0.39mi |
| 2900 N 24th St McAllen, TX | 4.0 | 2.0 | 2009 | $1,900 | $0.95 | 45d | 1 | 0.43mi |
| 2421 Vine Ave Unit C McAllen, TX | 2.0 | 1.0 | 1050 | $800 | $0.76 | 16d | 1 | 0.46mi |
| 1209 Harvey St McAllen, TX | 2.0 | 1.0 | 1408 | $1,350 | $0.96 | 16d | 1 | 0.52mi |
| 1601 Redwood Ave McAllen, TX | 2.0 | 1.0 | 1292 | $1,100 | $0.85 | 45d | 1 | 0.56mi |
| 3101 N 25 1/2 St McAllen, TX | 3.0 | 2.0 | 1462 | $1,600 | $1.09 | 25d | 1 | 0.63mi |
| 1808 N Broadway St McAllen, TX | 4.0 | 3.0 | 1800 | $2,400 | $1.33 | 45d | 1 | 0.66mi |
| 2716 N 27th Ln McAllen, TX | 3.0 | 2.5 | 1458 | $1,750 | $1.20 | 16d | 1 | 0.70mi |
| 1104 Fern Ave W Unit C McAllen, TX | 2.0 | 2.0 | 1122 | $895 | $0.80 | 25d | 1 | 0.71mi |
| 1110 W Gardenia Ave McAllen, TX | 3.0 | 2.0 | 1310 | $1,300 | $0.99 | 45d | 1 | 0.72mi |
| 2616 Quince Ave McAllen, TX | 3.0 | 2.0 | 1134 | $1,450 | $1.28 | 25d | 1 | 0.77mi |
| 2432 W Iris Ave McAllen, TX | 4.0 | 2.0 | 1397 | $1,700 | $1.22 | 45d | 1 | 0.77mi |
| 2419 N 28th Ln McAllen, TX | 3.0 | 2.0 | 1510 | $1,250 | $0.83 | 45d | 1 | 0.77mi |
| 2419 N 28th Ln McAllen, TX | 3.0 | 2.0 | 1510 | $1,250 | $0.83 | 16d | 1 | 0.77mi |
| 2419 N 28th Ln McAllen, TX | 3.0 | 2.0 | 1510 | $1,250 | $0.83 | 25d | 1 | 0.77mi |
| 2604 Quince Ln McAllen, TX | 3.0 | 2.0 | 1800 | $1,450 | $0.81 | 45d | 1 | 0.79mi |
| 1210 W Jonquil Ave McAllen, TX | 4.0 | 3.0 | 1628 | $1,525 | $0.94 | 45d | 1 | 0.82mi |
| 2433 Kerria Ave McAllen, TX | 3.0 | 2.0 | 1286 | $1,500 | $1.17 | 45d | 1 | 0.84mi |
| 3101 N 8th St Apt H5 McAllen, TX | 2.0 | 2.0 | 1200 | $950 | $0.79 | 16d | 1 | 0.85mi |
| 2816 Gardenia Cir McAllen, TX | 3.0 | 2.0 | 1365 | $3,600 | $2.64 | 45d | 1 | 0.85mi |
| 710 Camellia Ave McAllen, TX | 2.0 | 2.0 | 1358 | $1,350 | $0.99 | 25d | 1 | 0.88mi |
| 619 Highland Ave McAllen, TX | 3.0 | 2.0 | 1511 | $1,500 | $0.99 | 23d | 1 | 0.90mi |
| 1101 Kerria Ave McAllen, TX | 3.0 | 2.0 | 1920 | $2,350 | $1.22 | 23d | 1 | 0.92mi |
| 609 Walnut Ave McAllen, TX | 3.0 | 2.0 | 1323 | $1,800 | $1.36 | 25d | 1 | 0.94mi |
| 700 W Fern Ave #4 McAllen, TX | 2.0 | 1.0 | 1215 | $1,050 | $0.86 | 45d | 1 | 0.96mi |
| 700 W Fern Ave #5 McAllen, TX | 2.0 | 2.0 | 1517 | $1,350 | $0.89 | 45d | 1 | 0.96mi |
| 701 Hibiscus Ave #12 McAllen, TX | 3.0 | 2.0 | 1685 | $1,800 | $1.07 | 46d | 1 | 0.98mi |
| 1024 Laurel Ave McAllen, TX | 3.0 | 2.0 | 1466 | $1,600 | $1.09 | 45d | 1 | 1.03mi |
| 3112 N 6th St McAllen, TX | 2.0 | 2.0 | 1610 | $1,750 | $1.09 | 45d | 1 | 1.05mi |
| 1016 Laurel Ave McAllen, TX | 2.0 | 1.0 | 1124 | $1,425 | $1.27 | 16d | 1 | 1.05mi |
| 1524 Primrose Ave McAllen, TX | 3.0 | 2.0 | 2002 | $1,750 | $0.87 | 25d | 1 | 1.07mi |
| 1203 Jasmine Ave McAllen, TX | 3.0 | 2.0 | 1588 | $1,500 | $0.94 | 45d | 1 | 1.10mi |
| 439 Quince Cir McAllen, TX | 2.0 | 1.0 | 1200 | $1,400 | $1.17 | 25d | 1 | 1.11mi |
| 3501 Westway Ave McAllen, TX | 3.0 | 2.0 | 1364 | $1,500 | $1.10 | 25d | 1 | 1.15mi |
| 3516 N 32nd St McAllen, TX | 3.0 | 2.0 | 1531 | $1,700 | $1.11 | 25d | 1 | 1.15mi |
| 4120 N 12th St Apt 14 McAllen, TX | 2.0 | 1.5 | 1514 | $1,250 | $0.83 | 21d | 1 | 1.19mi |
| 2912 N 36th St McAllen, TX | 3.0 | 2.0 | 1850 | $2,200 | $1.19 | 25d | 1 | 1.21mi |
| 200 Upas Ave McAllen, TX | 2.0 | 2.0 | 1212 | $950 | $0.78 | 16d | 1 | 1.25mi |
Listing history 7 events
-
2026-06-21days on market $145,000 Active 9 DOM
-
2026-06-18days on market $145,000 Active 6 DOM
-
2026-06-17days on market $145,000 Active 5 DOM
-
2026-06-16days on market $145,000 Active 4 DOM
-
2026-06-15days on market $145,000 Active 3 DOM
-
2026-06-14remarks 483-char remark
-
2026-06-14$145,000 Active 1 DOM
ⓘ Source: listings_history table (triggers on properties + properties_extension) + one-shot
backfill from property_details.listing_events for pre-trigger history.
Tax reassessment forecast TX · Resets to sale price
- Current annual tax
- $3,354 · $279/mo
- Projected year-2 tax
- $3,354 · $279/mo
- Expected delta
- $0/yr ($0/mo · 0.0%)
ⓘ Screening estimate from a state-policy table — verify with the county assessor before closing.
Climate risk First Street
- Flood 6/10 Major FEMA zone X (shaded) · 73% chance over 30 yrs
- Wildfire 1/10 Low
- Heat 9/10 Extreme 7 d/yr ≥111°F today · 22 d/yr by 30 yrs out
- Wind 8/10 Severe 99% chance of damaging wind over 30 yrs
- Air quality 3/10 Moderate 1 unhealthy d/yr today · 4 by 30 yrs out
Nearby sold comps map
Loading sold comps map…
Walkable amenities ~0.75 mi
Loading nearby amenities…
Taxation est. · year 1
- Rental income
- $19,494
- − Mortgage interest
- −$8,122
- − Property taxes
- −$3,354
- − Insurance
- −$725
- − Repairs & maintenance
- −$1,559
- − Management
- −$1,559
- − Depreciation
- −$4,218
- Taxable loss
- −$44
- Est. tax savings @ 24.0%
- +$11
- After-tax cash flow
- $2,207/yr
For passive investors: Depreciation is non-cash, so a rental often shows a tax loss while cash-flowing — sheltering income. Rental losses are passive: they offset passive income freely, and up to $25,000/yr can offset ordinary (W-2) income if you actively participate and your MAGI is under $100k (phasing out to $0 by $150k); unused losses carry forward. On sale, claimed depreciation is recaptured at up to 25%, and gains may owe capital-gains tax (a 1031 exchange can defer both). Figures are a year-1 estimate at your 24.0% rate — not tax advice; consult a CPA.
Schools (NCES district)
- District
- Mcallen ISD
- NCES district ID
- 4829670
- Math proficiency
- 34% ▼ -22.00%
- Reading proficiency
- 45% ▼ -5.00%
- Median HH income
- $40,805
- Composite
- 33.16/100
- National rank
- #5551
- State rank
- #440 of 826 in TX
Livability — McAllen
- Score
- 76/100
- State rank
- #119
- US rank
- #3771
Category grades
Schools grade is shown separately in the Schools card above.
Census & demographics
- Census place
- McAllen, TX
- County
- Hidalgo County · 623,128 people
- City population
- 144,650
- Metro
- McAllen-Edinburg-Mission, TX
- Population (ZIP)
- 58,935
- Household income
- $48,071
- Rent vs Own
- Severe rent burden
- 3043.0
Population outlook (Hidalgo County) Hauer SSP2
- Today (2025)
- 955,232 people
- By 2030
- 1,009,774 · +5.7%
- By 2040
- 1,120,332 · +17.3%
- By 2050
- 1,225,036 · +28.2%
- By 2075
- 1,439,189 · +50.7%
- By 2100
- 1,533,429 · +60.5%
Race, ethnicity, and origin ACS 2023
- Neighborhood character
- Predominantly Hispanic (89%)
- Race & ethnicity
- Hispanic / Latino 89% Two or more races 32% White 8% Asian 2%
- Hispanic origin (detail)
- Mexican 85%
- Foreign-born
- 28% · Canada, Vietnam
- Languages at home
- 22% English-only · Spanish 76%
Political lean MEDSL · Hidalgo
- 2024 margin
- Toss-up / Even · D 48.1% · R 51.0%
- 2008→2024 swing
- -41.6pp toward R · 2008: 38.7pp · 2024: -2.9pp
- All cycles
- 2024: R+2.9 2020: D+17.1 2016: D+40.5 2012: D+41.8 2008: D+38.7
Not yet ingested
- Civics
- —
Market trends
- HPI YoY
- ▼ -69.99%
- Current HPI
- 230.0213
- Rent YoY
- ▲ 1.78%
- Metro
- McAllen-Edinburg-Mission, TX
- State GDP YoY
- ▲ 3.95%
- F500 in state
- 110
Industry mix (Fortune 500 HQ in TX)
| Industry | F500 HQs | Revenue |
|---|---|---|
| Energy | 16 | $1,198B |
|
||
| Technology | 5 | $198B |
|
||
| Engineering / Construction | 4 | $72B |
|
||
| Energy Services | 3 | $60B |
|
||
| Utilities | 3 | $41B |
|
||
| Healthcare | 2 | $330B |
|
||
Price history
2 events — show timeline
- 2026-06-12 Listed $145,000 MCALLENMLS
- 2026-05-13 Sold (Public Records) — Public Records
Property tax history
+6.4%/yrLatest (2025): $3,354 · -11.1% YoY. Source: county tax records.
Cash-flow waterfall
monthlySold comps — $/sqft
last 12 mo · ≤1 miLoading sold comps…