 Duplex
1570 Los Alamos St · Brownsville, TX
Flood risk 6/10 · Moderate
- FEMA flood zone
- X (unshaded)
- Chance of flooding over 30 yrs
- 0.74%
- Est. flood insurance / yr
- $507 – $1,088
Fire risk 1/10 · Minimal
- Est. fire insurance / yr
- $1,222 – $2,270
Heat risk 9/10 · Severe
- Hot days now (above 111°F)
- 7 days/yr
- Hot days in 30 yrs
- 26 days/yr
Wind risk 9/10 · Severe
- Chance of severe wind over 30 yrs
- 99.0%
Air-quality risk 2/10 · Minimal
- Unhealthy air days now
- 1 days/yr
- Unhealthy air days in 30 yrs
- 1 days/yr
Risk factors via First Street. Map © Google.
Why this score? — see what drove the D+ grade
The composite is a weighted blend of 9 inputs, each scored 0–100. Each bar is that input's sub-score; the figure is the points it added to the 100-point composite (weight × sub-score).
- Cash flow +16.7/30.0
- ARV discount +7.5/15.0
- DSCR +5.2/10.0
- 1% rule +4.5/10.0
- Rent growth +4.5/5.0
- Livability +4.0/5.0
- Schools +2.2/10.0
- Condition / age +1.0/5.0
- Appreciation +0.0/10.0
$344,900
🖨 Deal sheet (PDF) 📄 Offer letter ✓ Due diligence
Multi-family units
County records classify this as Multi-Family (2-4 Unit). Listing-text estimate: 2 units. confirmed
Listing remarks MLS
NEW DUPLEX 3 BEDROOMS 2 BATHS TILE FLOORS GRANITE TOPS, 2 CAR DRIVEWAY, PRIVATE WOOD FENCE TO EACH UNIT, GRASS FRONT AND BACK. . STAINLESS STEAL APPLIANCES. THIS IS THE BIGGEST LOT IN THE THIS SUBDIVISTION AND CLOSE TO SPACE X. CONSTRUCTION COMPLETED BY APRIL 2026 OR SOONER.
Key facts
- Tile floors
- Granite tops
- Grass front and back
Tags
Neighborhood map
What this means for you Summary
Snapshot
- This is a 2 × 3-bed/2.0-bath units multifamily listed at $345k. Condition is rated poor.
Deal economics
- At list price, monthly cash flow is $215 ($3k/yr) — positive. Per door: $107/mo.
- The deal already cash-flows at list — no discount required.
- To meet the 1% rule (rent ≥ 1% of price), the offer needs to be $329k (4.6% below list).
- Recommended offer: $324k (6.0% below list) — sets the bar for market timing.
- Cap rate 7.0% vs local median 5.0% in Brownsville — top-decile yield for the area; either an underpriced asset or a hidden risk that comps aren't pricing in. Stress-test before assuming the spread holds.
Location & tenants
- Location reads 79/100 on livability (#62 in TX, #2,311 nationally) — a middle-class / working-renter tenant base. Strengths: commute A+, cost of living A+, housing A+; Watch: amenities D, crime D-, employment F.
- Brownsville ISD (urban): math 20% / reading 34% proficiency, ranked #710 of 826 in TX (top 86%) — low school quality limits family demand, transient renter base, plan for 1-2y turnover; 83% free/reduced lunch — lower-income household profile, screen leases tightly.
- Zoned schools: Garza El (math 32% / reading 32%, grade F, #2,268 of 4,322 statewide, top 55%, 238 students, 99% FRL); Besteiro Middle (math 14% / reading 28%, grade F, #1,387 of 1,662 statewide, top 85%, 575 students, 98% FRL); Lopez Early College H S (math 20% / reading 39%, grade F, #1,112 of 1,632 statewide, top 70%, 1,831 students, 95% FRL).
- Market conditions: Rents rising fast (+8.2%/yr); 366 active listings in the ZIP; lower-income renter base — watch delinquency; 2,326 units permitted in Cameron County in 2024 (503 in 5+ unit buildings).
- At $3,289/mo this rent would consume 89% of the median local household income ($45k/yr) (locally 2682% of renters already pay >50% of income on rent) — very limited rent-growth headroom before tenants either downsize or default.
Forward outlook
- Local home prices are declining (-3.0%/yr); year-one equity from $2k of loan paydown is wiped out by about $10k of value loss. Plan a longer hold.
- Cameron County population projected at +3% by 2050 — modest demand growth; plan on rents tracking national, not racing it.
- At projected returns (-3.0% appreciation + 8.0% rent growth), your $97k cash investment doubles in ~10 years — after that, you're playing with house money.
Negotiation context
- It's been on market 82 days — a 6% lower offer ($324k) is reasonable based on typical stale-listing flexibility.
Risks & watch-outs
- Climate carrying-cost: major flood risk; severe wind risk, 99% chance of damaging wind over 30y; extreme-heat days projected 7→26/yr by 2055 (HVAC capex compounding) — expect insurance premiums to compound above CPI over the hold.
Questions for the listing agent
- It's been on market 82 days. Have you received any prior offers? Is the seller open to a 6% concession, seller financing, or rate buy-down credit?
- Can we see the unit-by-unit rent roll, current vacancy, and any below-market leases? What's the average tenancy length?
- What capital expenditures (roof, boiler, parking lot, exteriors) have been made in the last 5 years, and what's planned in the next 2?
- Have any recent inspections been done? Can we get a copy of the seller's disclosures and any deferred-maintenance estimates?
- Why hasn't it sold? Are there any deal-killer items the seller is aware of (foundation, flood, title, zoning, code violations)?
- Is there a deadline driving the sale (1031 exchange, divorce, estate, relocation)? That informs how much negotiation room exists.
- Crime grade is D in this area — have there been break-ins, vandalism, or insurance claims at this property in the last 3 years? What carrier currently insures it and at what premium?
- The area grade is low — what's the realistic commute time and amenity access for the typical tenant pool here? Any planned neighborhood developments (good or bad) we should know about?
- What's the average days-on-market for RENTAL listings here right now (not sales)? A rising rental-DOM trend means longer vacancies and softer asking-rent achievability than the comps imply.
- What's the recent tenant-quality profile in this submarket — average credit score on applications, eviction rate, late-payment / NSF rate, and stable-employment percentage? A property-management company in the area should have these aggregated.
- How much new apartment / multifamily construction is in the pipeline within 1–3 miles? Heavy new supply (>2% of stock underway) typically softens rents 12–24 months out; light construction supports rent growth.
Investment metrics
- 1% rule
- 0.95% ✗
- Cap rate
- 7.04%
- Cash-on-cash
- 2.67%
- DSCR
- 1.12
- GRM
- 8.7
CMA / ARV
- ARV (median comp)
- $155,047
- List price
- $344,900
- Delta
- 122.45%
- Verdict
- OVERPRICED
- Comps
- 2 within 2.0 mi
Projected returns pro-forma
-3.0% appreciation · 8.0% rent growth · sell at horizon
- IRR
- -6.6%
- Equity multiple
- 0.74×
- Total profit
- $-24,778
- Equity at exit
- $51,426
- IRR
- 8.3%
- Equity multiple
- 1.78×
- Total profit
- $75,351
- Equity at exit
- $29,821
Cash invested: $96,572 (down + closing). Projections, not guarantees.
Landlord ↔ Tenant lean methodology
- Overall (STATE)
- 87 Strongly Landlord-Friendly
- State Texas
- 87 Strongly Landlord-Friendly · R+5
- County
- — inherits STATE
- City
- — inherits STATE
ZIP-level market 78521
- Home prices YoY
- -26.0%
- Rents YoY
- 8.2%
- Active inventory
- 366
- Price-to-rent
- 17.5×
Monthly cashflow live
- Estimated rent
- $3,289 high interval (Pro) →
- Mortgage (P&I)
- −$1,809
- Tax est. 1.5%
- −$431 /mo · $5,174/yr
- Insurance
- −$144
- HOA
- −$0
- Vacancy / Maint / Mgmt
- −$691
- Net cashflow
- $215
Break-even live
Sensitivity live
| Price | -10% $453 | -5% $334 | +0% $215 | +5% $96 | +10% $-24 |
|---|---|---|---|---|---|
| Rent | -10% $-45 | -5% $85 | +0% $215 | +5% $345 | +10% $475 |
| Rate | -1.0pp $388 | -0.5pp $303 | base $215 | +0.5pp $125 | +1.0pp $34 |
2-unit breakdown (identical units grouped — click to expand)
| Units | Beds | Baths | Est. rent |
|---|---|---|---|
| 2× units | 3 | 2 | $3,290 |
| #1 | 3 | 2 | $1,645 |
| #2 | 3 | 2 | $1,645 |
| Total (2 units) | $3,289 | ||
UW: 25.0% down · 7.5% · 30yr · 1.5% tax · 5.0% vac · 8.0% maint · 8.0% mgmt
Financing live
Cash to close
- Down payment
- $86,225
- Closing costs
- $10,347
- Reserves months
- —
- Total cash needed
- —
Loan-product check · same deal, 3 products live
Conventional
25% down · 7.5% · 30yr
- Down + closing
- —
- Monthly P&I
- —
- Monthly cashflow
- —
- DSCR
- —
- Eligible?
- —
Personal DTI + credit; lowest rate.
DSCR
20% down · 8.5% · 30yr
- Down + closing
- —
- Monthly P&I
- —
- Monthly cashflow
- —
- DSCR
- —
- Eligible?
- —
No personal income docs; deal must DSCR.
Hard money
10% down · 12.0% · 12mo
- Down + closing
- —
- Monthly P&I
- —
- Monthly cashflow
- —
- DSCR
- —
- Eligible?
- —
Short-term bridge; refi at stabilization.
Listing history 1 events
-
2026-03-08$344,900 Active 276-char remark
Show marketing remark (276 chars)
NEW DUPLEX 3 BEDROOMS 2 BATHS TILE FLOORS GRANITE TOPS, 2 CAR DRIVEWAY, PRIVATE WOOD FENCE TO EACH UNIT, GRASS FRONT AND BACK. . STAINLESS STEAL APPLIANCES. THIS IS THE BIGGEST LOT IN THE THIS SUBDIVISTION AND CLOSE TO SPACE X. CONSTRUCTION COMPLETED BY APRIL 2026 OR SOONER.
ⓘ Source: listings_history table (triggers on properties + properties_extension) + one-shot
backfill from property_details.listing_events for pre-trigger history.
Climate risk First Street
- Flood 6/10 Major FEMA zone X (unshaded) · 74% chance over 30 yrs
- Wildfire 1/10 Low
- Heat 9/10 Extreme 7 d/yr ≥111°F today · 26 d/yr by 30 yrs out
- Wind 9/10 Extreme 99% chance of damaging wind over 30 yrs
- Air quality 2/10 Low 1 unhealthy d/yr today · 1 by 30 yrs out
Nearby sold comps map
Loading sold comps map…
Walkable amenities ~0.75 mi
Loading nearby amenities…
Taxation est. · year 1
- Rental income
- $39,468
- − Mortgage interest
- −$19,320
- − Property taxes
- −$5,174
- − Insurance
- −$1,724
- − Repairs & maintenance
- −$3,157
- − Management
- −$3,157
- − Depreciation
- −$10,033
- Taxable loss
- −$3,098
- Est. tax savings @ 24.0%
- +$744
- After-tax cash flow
- $3,321/yr
For passive investors: Depreciation is non-cash, so a rental often shows a tax loss while cash-flowing — sheltering income. Rental losses are passive: they offset passive income freely, and up to $25,000/yr can offset ordinary (W-2) income if you actively participate and your MAGI is under $100k (phasing out to $0 by $150k); unused losses carry forward. On sale, claimed depreciation is recaptured at up to 25%, and gains may owe capital-gains tax (a 1031 exchange can defer both). Figures are a year-1 estimate at your 24.0% rate — not tax advice; consult a CPA.
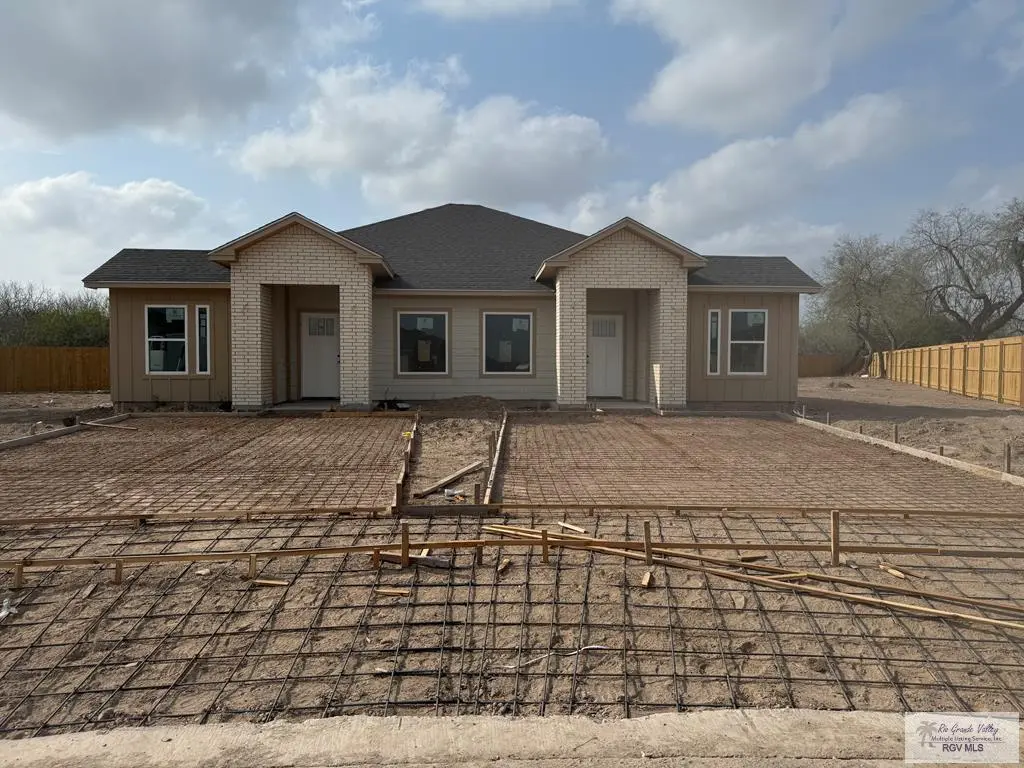
Condition & rehab AI · 1 photo
This property is in an extensive construction phase and requires full completion of all systems and finishes to become move-in ready.
Repairs flagged
- Major concrete foundation — Rebar and concrete are visible, indicating incomplete construction
- Major roof — No roof visible, suggesting it is not yet installed
- Major exterior siding — No exterior siding visible, indicating it is not yet installed
- Major interior walls — No interior walls visible, indicating they are not yet installed
- Major kitchen — No kitchen visible, indicating it is not yet installed
- Major bathrooms — No bathrooms visible, indicating they are not yet installed
- Major HVAC/mechanicals — No HVAC/mechanicals visible, indicating they are not yet installed
- Major landscaping — No landscaping visible, indicating it is not yet installed
Value-add opportunities
- Both Complete construction and installation of all systems and finishes — This would make the property move-in ready and fully functional
- Both Landscaping and curb appeal improvements — This would enhance the property's curb appeal and attract potential buyers/tenants
Renovation cost estimate screening
| Repair item | Severity | Est. cost |
|---|---|---|
| concrete foundation · Rebar and concrete are visible, indicating incomplete construction | Major | $15,000–50,000 |
| roof · No roof visible, suggesting it is not yet installed | Major | $15,000–50,000 |
| exterior siding · No exterior siding visible, indicating it is not yet installed | Major | $15,000–50,000 |
| interior walls · No interior walls visible, indicating they are not yet installed | Major | $15,000–50,000 |
| kitchen · No kitchen visible, indicating it is not yet installed | Major | $15,000–50,000 |
| bathrooms · No bathrooms visible, indicating they are not yet installed | Major | $15,000–50,000 |
| HVAC/mechanicals · No HVAC/mechanicals visible, indicating they are not yet installed | Major | $15,000–50,000 |
| landscaping · No landscaping visible, indicating it is not yet installed | Major | $15,000–50,000 |
| Total estimated repair cost · 8 items | $120,000–400,000 |
Value-add ROI direction
- Both Complete construction and installation of all systems and finishes — This would make the property move-in ready and fully functional ↑
- Both Landscaping and curb appeal improvements — This would enhance the property's curb appeal and attract potential buyers/tenants ↑
ⓘ Cost ranges are severity-bucket heuristics (US national rule-of-thumb). Get contractor quotes + a written scope before underwriting a rehab budget.
Schools (NCES district)
- District
- Brownsville ISD
- NCES district ID
- 4811680
- Math proficiency
- 20% ▼ -36.00%
- Reading proficiency
- 34% ▼ -13.00%
- Median HH income
- $30,490
- Composite
- 21.8/100
- National rank
- #8249
- State rank
- #710 of 826 in TX
Livability — Brownsville
- Score
- 79/100
- State rank
- #62
- US rank
- #2311
Category grades
Schools grade is shown separately in the Schools card above.
Census & demographics
- Census place
- Brownsville, TX
- County
- Cameron County · 310,734 people
- City population
- 212,132
- Metro
- Brownsville-Harlingen, TX
- Population (ZIP)
- 87,380
- Household income
- $44,509
- Rent vs Own
- Severe rent burden
- 2682.0
Population outlook (Cameron County) Hauer SSP2
- Today (2025)
- 441,603 people
- By 2030
- 448,113 · +1.5%
- By 2040
- 456,385 · +3.3%
- By 2050
- 456,294 · +3.3%
- By 2075
- 423,851 · -4.0%
- By 2100
- 342,787 · -22.4%
Race, ethnicity, and origin ACS 2023
- Neighborhood character
- Predominantly Hispanic (97%)
- Race & ethnicity
- Hispanic / Latino 97% Two or more races 45% White 3%
- Hispanic origin (detail)
- Mexican 91%
- Foreign-born
- 30% · Canada
- Languages at home
- 12% English-only · Spanish 88%
Political lean MEDSL · Cameron
- 2024 margin
- Lean R (+5.8) · D 46.7% · R 52.5%
- 2008→2024 swing
- -34.6pp toward R · 2008: 28.8pp · 2024: -5.8pp
- All cycles
- 2024: R+5.8 2020: D+13.2 2016: D+32.5 2012: D+32.4 2008: D+28.8
Not yet ingested
- Civics
- —
Market trends
- HPI YoY
- ▼ -81.45%
- Current HPI
- 232.1072
- Rent YoY
- ▲ 8.19%
- Metro
- Brownsville-Harlingen, TX
- State GDP YoY
- ▲ 3.95%
- F500 in state
- 110
Industry mix (Fortune 500 HQ in TX)
| Industry | F500 HQs | Revenue |
|---|---|---|
| Energy | 16 | $1,198B |
|
||
| Technology | 5 | $198B |
|
||
| Engineering / Construction | 4 | $72B |
|
||
| Energy Services | 3 | $60B |
|
||
| Utilities | 3 | $41B |
|
||
| Healthcare | 2 | $330B |
|
||
Price history
1 event — show timeline
- 2026-03-08 Listed $344,900 RGVMLS
Cash-flow waterfall
monthlySold comps — $/sqft
last 12 mo · ≤1 miLoading sold comps…