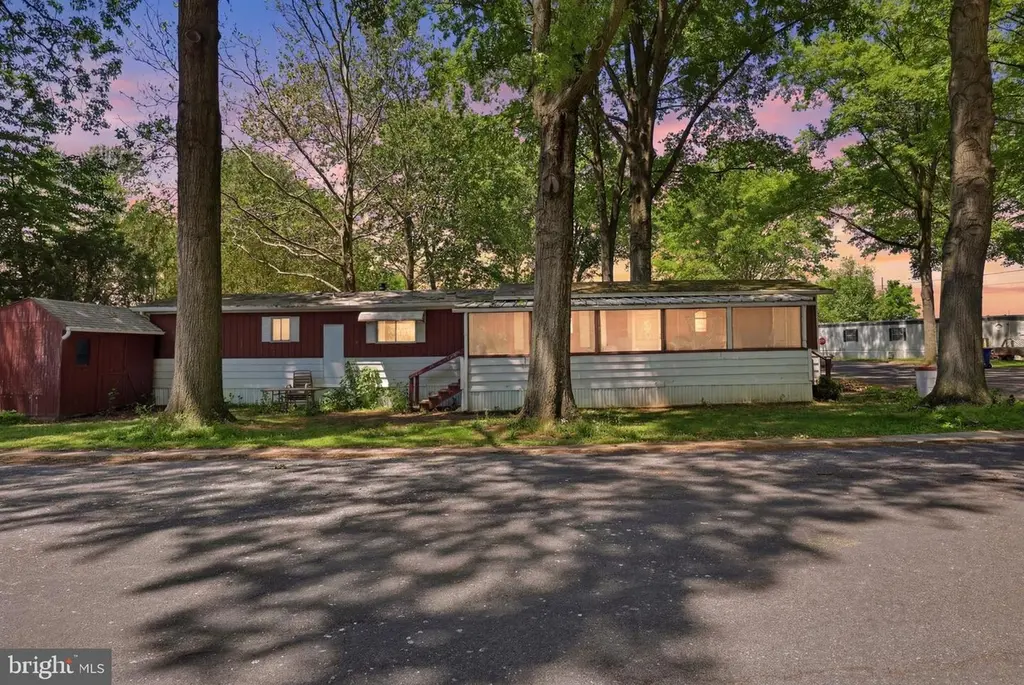
82 Malibu Blvd · Silver Spring, PA
Flood risk 4/10 · Minor
- FEMA flood zone
- X (unshaded)
- Chance of flooding over 30 yrs
- 0.22%
- Est. flood insurance / yr
- $507 – $1,088
Fire risk 1/10 · Minimal
- Est. fire insurance / yr
- $511 – $949
Heat risk 5/10 · Moderate
- Hot days now (above 101°F)
- 7 days/yr
- Hot days in 30 yrs
- 15 days/yr
Wind risk 3/10 · Minor
- Chance of severe wind over 30 yrs
- 5.0%
Air-quality risk 2/10 · Minimal
- Unhealthy air days now
- 1 days/yr
- Unhealthy air days in 30 yrs
- 3 days/yr
Risk factors via First Street. Map © Google.
Why this score? — see what drove the B grade
The composite is a weighted blend of 9 inputs, each scored 0–100. Each bar is that input's sub-score; the figure is the points it added to the 100-point composite (weight × sub-score).
- Cash flow +30.0/30.0
- ARV discount +11.0/15.0
- 1% rule +10.0/10.0
- DSCR +10.0/10.0
- Schools +5.6/10.0
- Rent growth +2.5/5.0
- Livability +2.5/5.0
- Condition / age +2.5/5.0
- Appreciation +0.0/10.0
$45,000
🖨 Deal sheet 📄 Offer letter ✓ Due diligence
Listing remarks MLS
Welcome to 82 Malibu Blvd. , Carlisle, PA! This delightful 3-bedroom, 1-bathroom home is conveniently located close to shops, restaurants, and offers easy access to I-81 and I-83, providing the perfect blend of comfort and convenience. As you step inside this nice (14X72) Single wide, you'll be greeted by an open floor plan that seamlessly connects the kitchen and living area, making it perfect for entertaining or spending quality time with family. The kitchen is designed for both functionality and style, while the tile flooring throughout the home adds a touch of elegance and ease of maintenance. One of the highlights of this property is the inviting front porch, ideal for relaxing with a morning coffee or enjoying the evening breeze. The spacious screened porch (14x30) that offers a comfortable outdoor space for all seasons. The home also boasts a spacious corner lot with ample parking, ensuring convenience for you and your guests. For outdoor enthusiasts, there's a public park located directly behind the home, providing a beautiful green space for recreation and leisure activities. This property is also pet-friendly, making it a great choice for animal lovers. The home features two well-sized bedrooms and a smaller room that can be used as a bedroom or transformed into a walk-in closet. There's also a convenient 10x10 shed for additional storage. Don’t miss out on this fantastic opportunity to live in a well-maintained single-wide mobile home in a prime location. Schedule your viewing today and experience the charm and convenience of 82 Malibu Blvd. for yourself!
Key facts
- Shaded corner lot
- Prime location
- Built 1976
Tags
Property features AI
Finance
- Other: Improvement assessed value reported; Annual ground rent listed in income/expense items
- Financial info: Ground rent $619 per month; Ownership interest is ground rent
Exterior
- Parking: On-street parking
- Utilities: Public water; Public sewer; Electric hot water
- Home design: Mobile home (pre-1976)
- Construction: Aluminum siding; Make: MARLETTE
- Exterior features: Not located in a federal flood zone; Ground rent applies (monthly payment)
Interior
- Bedrooms: Three bedrooms on the main level
- Bathrooms: One full bathroom on the main level
- Heating & cooling: Baseboard electric heating; Window air conditioning units (electric)
- Interior features: No basement; Finished above-grade living area reported by assessor
Neighborhood map
What this means for you Summary
Snapshot
- This is a 2-bed/1.0-bath manufactured listed at $45k.
Deal economics
- At list price, monthly cash flow is $1k ($13k/yr) — positive.
- The deal already cash-flows at list — no discount required.
- Meets the 1% rule at list price ($2k rent vs $45k).
Location & tenants
- Location reads: area grade B — affects rentability + tenant quality, not the cash-flow math above.
- Cumberland Valley SD (suburban): math 54% / reading 71% proficiency, ranked #52 of 539 in PA (top 10%) — acceptable for families but not a draw, mixed tenant base, ~2y average lease; only 13% free/reduced lunch — higher-income household profile.
- Zoned schools: Cumberland Valley Hs (math 66% / reading 24%, grade D-, #191 of 437 statewide, top 44%, 3,035 students, 25% FRL).
- Zoned-school proficiency averages 45% at this address vs 62% district-wide (-17 pts) — the specific schools serving this property underperform the Cumberland Valley SD average; the district grade overstates school quality for this exact location.
- Market conditions: 188 active listings in the ZIP; solid renter incomes; 1,052 units permitted in Cumberland County in 2024 (310 in 5+ unit buildings).
Forward outlook
- Local home prices are declining (-3.0%/yr); year-one equity from $311 of loan paydown is wiped out by about $1k of value loss. Plan a longer hold.
- Cumberland County population projected at +17% by 2050 — long-run rental-demand tailwind backs the buy-and-hold thesis.
- At projected returns (-3.0% appreciation + 3.0% rent growth), your $13k cash investment doubles in ~2 years — after that, you're playing with house money.
Negotiation context
- Only 12 days on market — expect competitive offers; lowballing is unlikely to land.
- 3 sale attempts since 2y ago with the ask held roughly flat each time — persistent listings suggest the price (not the market) is what's stuck; bring a comps-based counter.
Risks & watch-outs
- Climate carrying-cost: extreme-heat days projected 7→15/yr by 2055 (HVAC capex compounding) — expect insurance premiums to compound above CPI over the hold.
Questions for the listing agent
- Built in 1976 — when were the roof, HVAC, electrical panel, plumbing, and water heater last replaced?
- Is there a deadline driving the sale (1031 exchange, divorce, estate, relocation)? That informs how much negotiation room exists.
- What's the average days-on-market for RENTAL listings here right now (not sales)? A rising rental-DOM trend means longer vacancies and softer asking-rent achievability than the comps imply.
- What's the recent tenant-quality profile in this submarket — average credit score on applications, eviction rate, late-payment / NSF rate, and stable-employment percentage? A property-management company in the area should have these aggregated.
- How much new for-sale + rental construction is in the pipeline within 1–3 miles? Heavy new supply typically softens prices + rents 12–24 months out; constrained supply supports both.
Investment metrics
- 1% rule
- 3.91% ✓
- Cap rate
- 35.08%
- Cash-on-cash
- 102.82%
- DSCR
- 5.58
- GRM
- 2.1
CMA / ARV
- ARV (on-the-fly)
- $48,776
- Comps found
- 1
Show comp detail 1 sale within ~0.75 mi
| Address | Dist | Beds/Ba | Sqft | Sold | Price | $/sf | Match |
|---|---|---|---|---|---|---|---|
| 213 Key West Blvd | 0.04mi | 3/1.5 (+1) | 952 (+2%) | 17mo | $49,900 | $52 | 75 |
Match score weights: distance 35% · size 25% · config 20% · recency 20%. Top-matched comps best support the ARV.
Projected returns pro-forma
-3.0% appreciation · 3.0% rent growth · sell at horizon
- IRR
- —
- Equity multiple
- 5.88×
- Total profit
- $61,499
- Equity at exit
- $6,710
- IRR
- —
- Equity multiple
- 12.29×
- Total profit
- $142,205
- Equity at exit
- $3,891
Cash invested: $12,600 (down + closing). Projections, not guarantees.
Landlord ↔ Tenant lean methodology
- Overall (STATE)
- 62 Landlord-Friendly
- State Pennsylvania
- 62 Landlord-Friendly · EVEN
- County
- — inherits STATE
- City
- — inherits STATE
ZIP-level market 17015
- Home prices YoY
- -25.2%
- Active inventory
- 188
- Price-to-rent
- 2.1×
Monthly cashflow live
- Estimated rent
- $1,760 medium interval (Pro) →
- Mortgage (P&I)
- −$236
- Tax est. 1.5%
- −$56 /mo · $675/yr
- Insurance
- −$19
- HOA
- −$0
- Vacancy / Maint / Mgmt
- −$370
- Net cashflow
- $1,080
Break-even live
UW: 25.0% down · 7.5% · 30yr · 1.5% tax · 5.0% vac · 8.0% maint · 8.0% mgmt
Financing live
Cash to close
- Down payment
- $11,250
- Closing costs
- $1,350
- Reserves months
- —
- Total cash needed
- —
Loan-product check · same deal, 3 products live
Conventional
25% down · 7.5% · 30yr
- Down + closing
- —
- Monthly P&I
- —
- Monthly cashflow
- —
- DSCR
- —
- Eligible?
- —
Personal DTI + credit; lowest rate.
DSCR
20% down · 8.5% · 30yr
- Down + closing
- —
- Monthly P&I
- —
- Monthly cashflow
- —
- DSCR
- —
- Eligible?
- —
No personal income docs; deal must DSCR.
Hard money
10% down · 12.0% · 12mo
- Down + closing
- —
- Monthly P&I
- —
- Monthly cashflow
- —
- DSCR
- —
- Eligible?
- —
Short-term bridge; refi at stabilization.
Listing history 11 events
-
2026-06-18days on market $45,000 Active 12 DOM
-
2026-06-17days on market $45,000 Active 11 DOM
-
2026-06-16days on market $45,000 Active 10 DOM
-
2026-06-15days on market $45,000 Active 9 DOM
-
2026-06-14days on market $45,000 Active 7 DOM
-
2026-06-13days on market $45,000 Active 6 DOM
-
2026-06-10days on market $45,000 Active 4 DOM
-
2026-06-09days on market $45,000 Active 3 DOM
-
2026-06-08days on market $45,000 Active 2 DOM
-
2026-06-07remarks 699-char remark
-
2026-06-07$45,000 Active 1 DOM
ⓘ Source: listings_history table (triggers on properties + properties_extension) + one-shot
backfill from property_details.listing_events for pre-trigger history.
Climate risk First Street
- Flood 4/10 Moderate FEMA zone X (unshaded) · 22% chance over 30 yrs
- Wildfire 1/10 Low
- Heat 5/10 Major 7 d/yr ≥101°F today · 15 d/yr by 30 yrs out
- Wind 3/10 Moderate 5% chance of damaging wind over 30 yrs
- Air quality 2/10 Low 1 unhealthy d/yr today · 3 by 30 yrs out
Nearby sold comps map
Loading sold comps map…
Walkable amenities ~0.75 mi
Loading nearby amenities…
Taxation est. · year 1
- Rental income
- $21,124
- − Mortgage interest
- −$2,521
- − Property taxes
- −$675
- − Insurance
- −$225
- − Repairs & maintenance
- −$1,690
- − Management
- −$1,690
- − Depreciation
- −$1,309
- Taxable income
- $13,014
- Est. tax owed @ 24.0%
- −$3,123
- After-tax cash flow
- $9,833/yr
For passive investors: Depreciation is non-cash, so a rental often shows a tax loss while cash-flowing — sheltering income. Rental losses are passive: they offset passive income freely, and up to $25,000/yr can offset ordinary (W-2) income if you actively participate and your MAGI is under $100k (phasing out to $0 by $150k); unused losses carry forward. On sale, claimed depreciation is recaptured at up to 25%, and gains may owe capital-gains tax (a 1031 exchange can defer both). Figures are a year-1 estimate at your 24.0% rate — not tax advice; consult a CPA.
Schools (NCES district)
- District
- Cumberland Valley SD
- NCES district ID
- 4207110
- Math proficiency
- 54% ▼ -6.00%
- Reading proficiency
- 71% ▼ -7.00%
- Median HH income
- $78,135
- Composite
- 55.77/100
- National rank
- #1218
- State rank
- #52 of 539 in PA
Livability — Silver Spring
No livability data for this city. (Only ~50 U.S. cities are tracked.)
Census & demographics
- County
- Cumberland County · 257,673 people
- Metro
- Harrisburg-Carlisle, PA
- Population (ZIP)
- 24,385
- Household income
- $86,981
- Rent vs Own
- Severe rent burden
- 172.0
Population outlook (Cumberland County) Hauer SSP2
- Today (2025)
- 267,950 people
- By 2030
- 278,105 · +3.8%
- By 2040
- 296,552 · +10.7%
- By 2050
- 312,937 · +16.8%
- By 2075
- 349,233 · +30.3%
- By 2100
- 361,875 · +35.1%
Race, ethnicity, and origin ACS 2023
- Neighborhood character
- Predominantly White (94%)
- Race & ethnicity
- White 94% Two or more races 2% Hispanic / Latino 2%
- Common ancestry
- Romanian 3% Lithuanian 2% Slovak 2%
- Foreign-born
- 2% · Canada
- Languages at home
- 97% English-only · German/W. Germanic 1% Spanish 1% Other Indo-European 1%
Political lean MEDSL · Cumberland
- 2024 margin
- Lean R (+9.4) · D 44.6% · R 54.1% · Other 1.3%
- 2008→2024 swing
- +4.2pp toward D · 2008: -13.6pp · 2024: -9.4pp
- All cycles
- 2024: R+9.4 2020: R+10.6 2016: R+18.6 2012: R+18.5 2008: R+13.6
Not yet ingested
- Civics
- —
Market trends
- HPI YoY
- ▼ -89.66%
- Current HPI
- 265.9175
- Rent YoY
- —
- Metro
- Harrisburg-Carlisle, PA
- State GDP YoY
- ▲ 1.68%
- F500 in state
- 34
Industry mix (Fortune 500 HQ in PA)
| Industry | F500 HQs | Revenue |
|---|---|---|
| Healthcare | 2 | $309B |
|
||
| Insurance | 2 | $27B |
|
||
| Telecommunications / Media | 1 | $124B |
|
||
| Industrial Distribution | 1 | $22B |
|
||
| Financial Services | 1 | $20B |
|
||
| Chemicals / Materials | 1 | $18B |
|
||
Price history
-10.0% since first listed7 events — show timeline
- 2026-06-06 Listed $45,000 BRIGHT MLS
- 2025-10-09 Listing Removed — BRIGHT MLS
- 2025-07-18 Listed $45,000 BRIGHT MLS
- 2024-07-25 Sold (MLS) $45,000 BRIGHT MLS
- 2024-06-26 Contingent — BRIGHT MLS
- 2024-06-12 Price Changed $45,000 BRIGHT MLS
- 2024-05-21 Listed $50,000 BRIGHT MLS
Property tax history
+2.7%/yrLatest (2026): $70 · +3.0% YoY. Source: county tax records.
Cash-flow waterfall
monthlySold comps — $/sqft
last 12 mo · ≤1 miLoading sold comps…