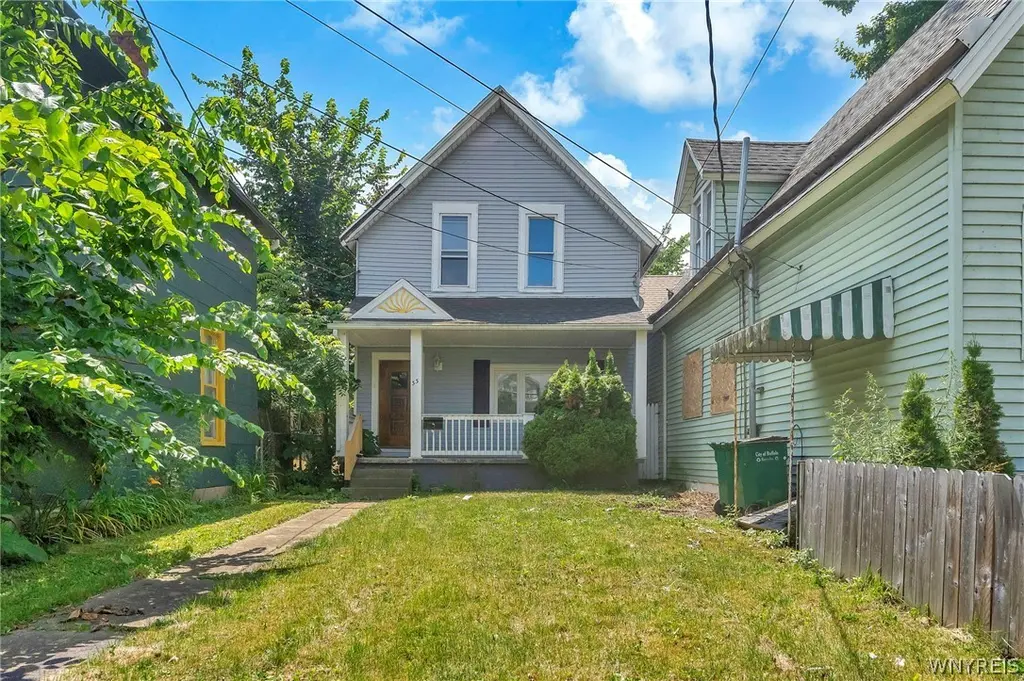
33 Lafayette Ave · Buffalo, NY
Flood risk 1/10 · Minimal
- FEMA flood zone
- X (unshaded)
- Chance of flooding over 30 yrs
- 0.0%
- Est. flood insurance / yr
- $507 – $1,088
Fire risk 1/10 · Minimal
- Est. fire insurance / yr
- $691 – $1,283
Heat risk 3/10 · Minor
- Hot days now (above 92°F)
- 7 days/yr
- Hot days in 30 yrs
- 14 days/yr
Wind risk 1/10 · Minimal
- Chance of severe wind over 30 yrs
- —
Air-quality risk 4/10 · Minor
- Unhealthy air days now
- 4 days/yr
- Unhealthy air days in 30 yrs
- 9 days/yr
Risk factors via First Street. Map © Google.
Why this score? — see what drove the A- grade
The composite is a weighted blend of 9 inputs, each scored 0–100. Each bar is that input's sub-score; the figure is the points it added to the 100-point composite (weight × sub-score).
- Cash flow +30.0/30.0
- ARV discount +15.0/15.0
- DSCR +10.0/10.0
- Appreciation +8.8/10.0
- 1% rule +8.3/10.0
- Livability +3.9/5.0
- Schools +3.3/10.0
- Condition / age +2.5/5.0
- Rent growth +2.4/5.0
$129,900
🖨 Deal sheet 📄 Offer letter ✓ Due diligence
Listing remarks
Beautiful single family home with 4 bedrooms, 2 full bathrooms along with many updates! The interior of the home features an updated eat in kitchen with magnificent wood cabinets, dishwasher and 1st floor laundry! Gleaming hardwood floors flow throughout the home, enhanced by abundant natural light that fills each room, creating a bright and spacious home. The updated bathrooms are radiantly exquisite offering comfort and elegance. Outside, enjoy a large front porch, perfect for relaxing, and a generous yard ideal for entertaining or play. Both the front and rear entrances feature stunning wooden doors that add warmth and character to this exceptional home.
Key facts
- Generous yard
- Large front porch
- 1st floor laundry
Tags
Property features AI
Exterior
- Parking: No garage; No driveway
- Utilities: Public water (connected); Sewer connected
- Home design: Single-story; Resale property
- Construction: Aluminum siding; Vinyl siding; Poured foundation; Existing (built prior to listing)
- Exterior features: Deck; Open porch
Interior
- Kitchen: Eat-in kitchen; Granite counters; Solid surface counters
- Flooring: Hardwood; Varies
- Bathrooms: 2 full bathrooms; 1 main-level bathroom
- Heating & cooling: Electric forced-air heating
- Interior features: Eat-in kitchen; Granite counters; Solid surface counters
- Laundry & utility: Main-level laundry; Gas water heater
Neighborhood map
What this means for you Summary
Snapshot
- This is a 3-bed/1.0-bath single-family listed at $130k.
Deal economics
- At list price, monthly cash flow is $592 ($7k/yr) — positive.
- The deal already cash-flows at list — no discount required.
- Meets the 1% rule at list price ($2k rent vs $130k).
- Recommended offer: $126k (3.0% below list) — sets the bar for market timing.
- Cap rate 11.8% vs local median 8.0% in Buffalo — top-decile yield for the area; either an underpriced asset or a hidden risk that comps aren't pricing in. Stress-test before assuming the spread holds.
Location & tenants
- Location reads 77/100 on livability (#195 in NY, #3,011 nationally) — a middle-class / working-renter tenant base. Strengths: commute A+, housing A+, health & safety A+; Watch: crime F, employment D-.
- Buffalo City School District (urban): math 41% / reading 40% proficiency, ranked #535 of 590 in NY (top 91%) — families likely to look elsewhere, expect single-tenant / working-renter base with shorter leases; 75% free/reduced lunch — lower-income household profile, screen leases tightly.
- Market conditions: Rents soft (-0.5%/yr); 137 active listings in the ZIP; 40 comparable units currently listed for rent nearby; rentals at typical pace (median 24d on market — plan ~3-4 weeks tenant-placement turnaround); 1,244 units permitted in Erie County in 2024 (563 in 5+ unit buildings).
- This rent runs 38% of the median local income ($54k/yr) — at the standard rent-burdened threshold; future hikes will face affordability resistance.
Forward outlook
- In year one you build about $11k of equity ($898 loan paydown + $10k appreciation (7.5% local appreciation)).
- At projected returns (7.5% appreciation + 0.0% rent growth), your $36k cash investment doubles in ~3 years — after that, you're playing with house money.
- By year 4, paydown + projected appreciation supports a ~$37k cash-out refi (75% LTV) — recoverable capital for the next deal without selling this one.
Negotiation context
- It's been on market 38 days — a 3% lower offer ($126k) is reasonable based on typical stale-listing flexibility.
- 5 sale attempts since 9y ago with the ask held roughly flat each time — persistent listings suggest the price (not the market) is what's stuck; bring a comps-based counter.
- Current owner paid $26k; list at $130k implies a 390% gain — meaningful room to come down on a strong offer.
Risks & watch-outs
- Watch-outs: built in 1890 — expect roof / HVAC / electrical / plumbing capex.
Questions for the listing agent
- It's been on market 38 days. Have you received any prior offers? Is the seller open to a 3% concession, seller financing, or rate buy-down credit?
- Built in 1890 — when were the roof, HVAC, electrical panel, plumbing, and water heater last replaced?
- Is there a deadline driving the sale (1031 exchange, divorce, estate, relocation)? That informs how much negotiation room exists.
- Crime grade is F in this area — have there been break-ins, vandalism, or insurance claims at this property in the last 3 years? What carrier currently insures it and at what premium?
- What's the average days-on-market for RENTAL listings here right now (not sales)? A rising rental-DOM trend means longer vacancies and softer asking-rent achievability than the comps imply.
- What's the recent tenant-quality profile in this submarket — average credit score on applications, eviction rate, late-payment / NSF rate, and stable-employment percentage? A property-management company in the area should have these aggregated.
- How much new for-sale + rental construction is in the pipeline within 1–3 miles? Heavy new supply typically softens prices + rents 12–24 months out; constrained supply supports both.
Investment metrics
- 1% rule
- 1.33% ✓
- Cap rate
- 11.76%
- Cash-on-cash
- 19.54%
- DSCR
- 1.87
- GRM
- 6.3
CMA / ARV
- ARV (median comp)
- $183,130
- List price
- $129,900
- Delta
- -29.07%
- Verdict
- UNDERPRICED
- Comps
- 20 within 1.0 mi
Show comp detail 12 sales within ~0.75 mi
| Address | Dist | Beds/Ba | Sqft | Sold | Price | $/sf | Match |
|---|---|---|---|---|---|---|---|
| 1193 West Ave | 0.22mi | 3/1.0 | 1,254 (+0%) | 8mo | $240,000 | $191 | 83 |
| 49 Gelston St | 0.22mi | 3/1.0 | 1,296 (+4%) | 5mo | $139,000 | $107 | 80 |
| 32 Lafayette Ave | 0.04mi | 3/1.5 | 1,390 (+11%) | 8mo | $105,000 | $76 | 72 |
| 95 Garner Ave | 0.47mi | 3/1.0 | 1,230 (-2%) | 4mo | $100,000 | $81 | 71 |
| 9 Congress St | 0.31mi | 4/1.0 (+1) | 1,200 (-4%) | 8mo | $130,000 | $108 | 67 |
| 19 Lawrence Pl | 0.63mi | 2/1.5 (-1) | 1,242 (-1%) | 0mo | $365,000 | $294 | 62 |
| 1061 Niagara St | 0.54mi | 3/1.0 | 1,183 (-6%) | 5mo | $135,500 | $115 | 62 |
| 187 Herkimer St | 0.28mi | 3/1.5 | 1,425 (+14%) | 4mo | $105,000 | $74 | 59 |
| 175 Garner Ave | 0.58mi | 4/2.0 (+1) | 1,265 (+1%) | 7mo | $105,000 | $83 | 56 |
| 855 West Ave | 0.43mi | 3/1.5 | 1,432 (+14%) | 3mo | $115,000 | $80 | 52 |
| 119 Albany St | 0.48mi | 3/1.0 | 1,408 (+12%) | 8mo | $180,000 | $128 | 50 |
| 74 Baynes St | 0.59mi | 4/2.0 (+1) | 1,075 (-14%) | 4mo | $195,925 | $182 | 37 |
Match score weights: distance 35% · size 25% · config 20% · recency 20%. Top-matched comps best support the ARV.
Projected returns pro-forma
7.51% appreciation · 0.0% rent growth · sell at horizon
- IRR
- 32.9%
- Equity multiple
- 3.26×
- Total profit
- $82,108
- Equity at exit
- $94,408
- IRR
- 28.5%
- Equity multiple
- 6.52×
- Total profit
- $200,812
- Equity at exit
- $183,457
Cash invested: $36,372 (down + closing). Projections, not guarantees.
Landlord ↔ Tenant lean methodology
- Overall (STATE)
- 15 Strongly Tenant-Friendly
- State New York
- 15 Strongly Tenant-Friendly · D+10
- County
- — inherits STATE
- City
- — inherits STATE
ZIP-level market 14213
- Home prices YoY
- 1.7%
- Rents YoY
- -0.5%
- Active inventory
- 137
- Price-to-rent
- 6.3×
Monthly cashflow live
- Estimated rent
- $1,723 high interval (Pro) →
- Mortgage (P&I)
- −$681
- Tax from tax record
- −$34 /mo · $403/yr
- Insurance
- −$54
- HOA
- −$0
- Vacancy / Maint / Mgmt
- −$362
- Net cashflow
- $592
Break-even live
UW: 25.0% down · 7.5% · 30yr · 1.5% tax · 5.0% vac · 8.0% maint · 8.0% mgmt
Financing live
Cash to close
- Down payment
- $32,475
- Closing costs
- $3,897
- Reserves months
- —
- Total cash needed
- —
Loan-product check · same deal, 3 products live
Conventional
25% down · 7.5% · 30yr
- Down + closing
- —
- Monthly P&I
- —
- Monthly cashflow
- —
- DSCR
- —
- Eligible?
- —
Personal DTI + credit; lowest rate.
DSCR
20% down · 8.5% · 30yr
- Down + closing
- —
- Monthly P&I
- —
- Monthly cashflow
- —
- DSCR
- —
- Eligible?
- —
No personal income docs; deal must DSCR.
Hard money
10% down · 12.0% · 12mo
- Down + closing
- —
- Monthly P&I
- —
- Monthly cashflow
- —
- DSCR
- —
- Eligible?
- —
Short-term bridge; refi at stabilization.
Rent comps 40 comps
| Address | Beds | Baths | Sqft | Rent | $/sqft | DOM | Units | Dist |
|---|---|---|---|---|---|---|---|---|
| 1360 Niagara St Buffalo, NY | 1.0–2.0 | 1.0–2.0 | 1252 | $2,396 | $1.91 | 1d | 2 | 0.13mi |
| 196 Auburn Ave Buffalo, NY | 3.0 | 1.0 | 1000 | $1,300 | $1.30 | 43d | 1 | 0.20mi |
| 163 W Delavan Ave Buffalo, NY | 3.0 | 1.0 | 1000 | $1,500 | $1.50 | 23d | 1 | 0.22mi |
| 232 Dewitt St Buffalo, NY | 3.0 | 1.0 | 1200 | $1,300 | $1.08 | 23d | 1 | 0.24mi |
| 311 Herkimer St #1 Buffalo, NY | 3.0 | 1.0 | 1272 | $1,400 | $1.10 | 14d | 1 | 0.25mi |
| 1485 Niagara St Buffalo, NY | 1.0–2.0 | 1.0 | 925 | $2,174 | $2.35 | 1d | 1 | 0.34mi |
| 185 Potomac Ave Buffalo, NY | 2.0 | 1.0 | 1200 | $1,300 | $1.08 | 23d | 1 | 0.35mi |
| 67 Herkimer St Buffalo, NY | 3.0 | 1.0 | 1000 | $1,300 | $1.30 | 14d | 1 | 0.43mi |
| 257 Lafayette Ave Unit 317 Buffalo, NY | 2.0 | 1.0 | 897 | $1,400 | $1.56 | 23d | 1 | 0.43mi |
| 257 Lafayette Ave Apt 319 Buffalo, NY | 2.0 | 1.0 | 900 | $1,395 | $1.55 | 23d | 1 | 0.44mi |
| 310 Hampshire St Apt 3 Buffalo, NY | 3.0 | 1.0 | 1200 | $1,500 | $1.25 | 43d | 1 | 0.53mi |
| 375 Hampshire St Buffalo, NY | 3.0 | 1.0 | 1200 | $1,100 | $0.92 | 43d | 1 | 0.57mi |
| 100 Forest Ave Buffalo, NY | 2.0–4.0 | 2.0–4.0 | 1304 | $1,600 | $1.23 | 1d | 14 | 0.62mi |
| 305 Bird Ave Unit 3 Buffalo, NY | 3.0 | 1.5 | 1128 | $2,300 | $2.04 | 43d | 1 | 0.62mi |
| 309 Bird Ave Unit 1 Buffalo, NY | 3.0 | 1.0 | 1100 | $2,200 | $2.00 | 43d | 1 | 0.62mi |
| 411 W Ferry St Buffalo, NY | 2.0 | 1.0 | 900 | $1,100 | $1.22 | 14d | 1 | 0.63mi |
| 40 Putnam St Buffalo, NY | 4.0 | 1.0 | 1600 | $2,100 | $1.31 | 23d | 1 | 0.64mi |
| 478 Breckenridge St Buffalo, NY | 3.0 | 1.0 | 1100 | $1,575 | $1.43 | 43d | 1 | 0.69mi |
| 340 Bird Ave #202 Buffalo, NY | 2.0 | 2.5 | 1505 | $2,950 | $1.96 | 10d | 1 | 0.70mi |
| 46 Hawley St #1 Buffalo, NY | 2.0 | 1.0 | 900 | $1,300 | $1.44 | 43d | 1 | 0.70mi |
| 374 Baynes St Buffalo, NY | 3.0 | 1.0 | 1126 | $1,550 | $1.38 | 43d | 1 | 0.73mi |
| 460 Rhode Island St Buffalo, NY | 2.0 | 1.0 | 1089 | $1,500 | $1.38 | 14d | 1 | 0.82mi |
| 37 Abbottsford Pl Buffalo, NY | 3.0 | 1.0 | 1130 | $1,650 | $1.46 | 43d | 1 | 0.85mi |
| 318 14th St Buffalo, NY | 2.0 | 1.0 | 1619 | $1,300 | $0.80 | 11d | 1 | 0.86mi |
| 57 Abbottsford Pl Buffalo, NY | 2.0 | 1.0 | 1000 | $1,550 | $1.55 | 23d | 1 | 0.87mi |
| 891 Richmond Ave Buffalo, NY | 3.0 | 1.0 | 1176 | $1,800 | $1.53 | 43d | 1 | 0.98mi |
| 161 16th St Buffalo, NY | 3.0 | 1.5 | 1500 | $2,000 | $1.33 | 23d | 1 | 0.99mi |
| 117 Bidwell Pkwy Unit 3 Buffalo, NY | 2.0 | 1.0 | 1192 | $1,500 | $1.26 | 3d | 1 | 1.00mi |
| 102 17th St Buffalo, NY | 2.0 | 1.0 | 1086 | $1,290 | $1.19 | 23d | 1 | 1.01mi |
| 664 Auburn Ave Unit 2 Buffalo, NY | 2.0 | 1.0 | 900 | $2,200 | $2.44 | 43d | 1 | 1.07mi |
| 217 Norwood Ave Apt 1 Buffalo, NY | 2.0 | 1.0 | 1500 | $2,700 | $1.80 | 43d | 1 | 1.07mi |
| 1015 Elmwood Ave Unit 3 Buffalo, NY | 2.0 | 2.0 | 1000 | $1,400 | $1.40 | 43d | 1 | 1.08mi |
| 367 Connecticut St Unit 2 Buffalo, NY | 2.0 | 2.0 | 1150 | $3,000 | $2.61 | 10d | 1 | 1.09mi |
| 685 Auburn Ave Buffalo, NY | 2.0 | 1.0 | 1200 | $1,600 | $1.33 | 44d | 1 | 1.11mi |
| 685 Auburn Ave Unit 2 Buffalo, NY | 3.0 | 1.0 | 1200 | $1,750 | $1.46 | 14d | 1 | 1.11mi |
| 305 W Utica St Unit B302 Buffalo, NY | 2.0 | 2.0 | 1180 | $2,060 | $1.75 | 14d | 1 | 1.12mi |
| 569 Elmwood Ave Buffalo, NY | 2.0 | 1.0 | 1500 | $1,750 | $1.17 | 11d | 1 | 1.15mi |
| 118 Ashland Ave Buffalo, NY | 3.0 | 1.0 | 1326 | $1,850 | $1.40 | 14d | 1 | 1.23mi |
| 124 Normal Ave Unit 2 Buffalo, NY | 3.0 | 1.0 | 1727 | $2,000 | $1.16 | 23d | 1 | 1.24mi |
| 451 Elmwood Ave Buffalo, NY | 2.0 | 1.0 | 1633 | $3,305 | $2.02 | 43d | 1 | 1.25mi |
Listing history 27 events
-
2026-06-18days on market $129,900 Active 38 DOM
-
2026-06-17days on market $129,900 Active 37 DOM
-
2026-06-16days on market $129,900 Active 36 DOM
-
2026-06-15days on market $129,900 Active 35 DOM
-
2026-06-13days on market $129,900 Active 33 DOM
-
2026-06-13days on market $129,900 Active 32 DOM
-
2026-06-10days on market $129,900 Active 30 DOM
-
2026-06-09days on market $129,900 Active 29 DOM
-
2026-06-08days on market $129,900 Active 28 DOM
-
2026-06-07days on market $129,900 Active 27 DOM
-
2026-06-03days on market $129,900 Active 23 DOM
-
2026-06-02days on market $129,900 Active 22 DOM
-
2026-06-01days on market $129,900 Active 21 DOM
-
2026-05-31days on market $129,900 Active 20 DOM
-
2026-05-11$129,900 Active 665-char remark
-
2025-08-21status Pending
-
2025-08-21historical
-
2025-07-23status Active
-
2025-07-22historical Active Under Contract
-
2025-07-14$129,900 Active
-
2020-11-05historical
-
2020-09-22$179,900 Active
-
2017-12-15soldstatus $26,500 Closed Sale or Rented
-
2017-09-19status Under Contract- Do Not Show
-
2017-09-05price $24,900
-
2017-08-28$30,000 Active
-
2009-11-20soldstatus $19,000
ⓘ Source: listings_history table (triggers on properties + properties_extension) + one-shot
backfill from property_details.listing_events for pre-trigger history.
Tax reassessment forecast NY · Partial reset (capped growth)
- Current annual tax
- $403 · $34/mo
- Projected year-2 tax
- $1,299 · $108/mo
- Expected delta
- +$896/yr (+$75/mo · 222.5%)
ⓘ Screening estimate from a state-policy table — verify with the county assessor before closing.
Climate risk First Street
- Flood 1/10 Low FEMA zone X (unshaded) · 0% chance over 30 yrs
- Wildfire 1/10 Low
- Heat 3/10 Moderate 7 d/yr ≥92°F today · 14 d/yr by 30 yrs out
- Wind 1/10 Low
- Air quality 4/10 Moderate 4 unhealthy d/yr today · 9 by 30 yrs out
Nearby sold comps map
Loading sold comps map…
Walkable amenities ~0.75 mi
Loading nearby amenities…
Taxation est. · year 1
- Rental income
- $20,676
- − Mortgage interest
- −$7,276
- − Property taxes
- −$403
- − Insurance
- −$650
- − Repairs & maintenance
- −$1,654
- − Management
- −$1,654
- − Depreciation
- −$3,779
- Taxable income
- $5,260
- Est. tax owed @ 24.0%
- −$1,263
- After-tax cash flow
- $5,845/yr
For passive investors: Depreciation is non-cash, so a rental often shows a tax loss while cash-flowing — sheltering income. Rental losses are passive: they offset passive income freely, and up to $25,000/yr can offset ordinary (W-2) income if you actively participate and your MAGI is under $100k (phasing out to $0 by $150k); unused losses carry forward. On sale, claimed depreciation is recaptured at up to 25%, and gains may owe capital-gains tax (a 1031 exchange can defer both). Figures are a year-1 estimate at your 24.0% rate — not tax advice; consult a CPA.
Schools (NCES district)
- District
- Buffalo City School District
- NCES district ID
- 3605850
- Math proficiency
- 41% ▲ 11.00%
- Reading proficiency
- 40% ▲ 7.00%
- Median HH income
- $31,665
- Composite
- 33.17/100
- National rank
- #5544
- State rank
- #535 of 590 in NY
Livability — Buffalo
- Score
- 77/100
- State rank
- #195
- US rank
- #3011
Category grades
Schools grade is shown separately in the Schools card above.
Census & demographics
- Census place
- Buffalo, NY
- County
- Erie County · 714,559 people
- City population
- 440,021
- Metro
- Buffalo-Cheektowaga, NY
- Population (ZIP)
- 24,107
- Household income
- $53,870
- Rent vs Own
- Severe rent burden
- 1501.0
Population outlook (Erie County) Hauer SSP2
- Today (2025)
- 933,037 people
- By 2030
- 935,181 · +0.2%
- By 2040
- 928,531 · -0.5%
- By 2050
- 905,725 · -2.9%
- By 2075
- 834,037 · -10.6%
- By 2100
- 708,033 · -24.1%
Race, ethnicity, and origin ACS 2023
- Neighborhood character
- Highly diverse neighborhood (Simpson 0.70)
- Race & ethnicity
- White 46% Hispanic / Latino 20% Black 18% Asian 12% Two or more races 10%
- Hispanic origin (detail)
- Mexican 1% Puerto Rican 16% Dominican 1%
- Common ancestry
- Romanian 6% Slovak 3% Lithuanian 3%
- Foreign-born
- 16% · Philippines, Canada, India
- Languages at home
- 68% English-only · Spanish 12% Other Asian/Pacific 7% Arabic 3%
Political lean MEDSL · Erie
- 2024 margin
- Lean D (+9.7) · D 54.8% · R 45.2%
- 2008→2024 swing
- -7.9pp toward R · 2008: 17.5pp · 2024: 9.7pp
- All cycles
- 2024: D+9.7 2020: D+14.7 2016: D+4.8 2012: D+15.6 2008: D+17.5
Not yet ingested
- Civics
- —
Market trends
- HPI YoY
- ▲ 7.51%
- Current HPI
- 448.4879
- Rent YoY
- ▼ -0.49%
- Metro
- Buffalo-Cheektowaga, NY
- State GDP YoY
- ▲ 2.60%
- F500 in state
- 92
Industry mix (Fortune 500 HQ in NY)
| Industry | F500 HQs | Revenue |
|---|---|---|
| Financial Services | 10 | $950B |
|
||
| Consumer Goods | 9 | $162B |
|
||
| Insurance | 4 | $225B |
|
||
| Telecommunications | 2 | $144B |
|
||
| Pharmaceuticals | 2 | $112B |
|
||
| Media / Entertainment | 2 | $69B |
|
||
Price history
+583.7% since first listed13 events — show timeline
- 2026-05-11 Listed $129,900 WNYREIS
- 2025-08-21 Pending — WNYREIS
- 2025-08-21 Listing Removed — WNYREIS
- 2025-07-23 Relisted — WNYREIS
- 2025-07-22 Contingent — WNYREIS
- 2025-07-14 Listed $129,900 WNYREIS
- 2020-11-05 Listing Removed — WNYREIS
- 2020-09-22 Listed $179,900 WNYREIS
- 2017-12-15 Sold (MLS) $26,500 WNYREIS
- 2017-09-19 Pending — WNYREIS
- 2017-09-05 Price Changed $24,900 WNYREIS
- 2017-08-28 Listed $30,000 WNYREIS
- 2009-11-20 Sold (Public Records) $19,000 Public Records
Property tax history
+9.1%/yrLatest (2025): $403 · +26.1% YoY. Source: county tax records.
Cash-flow waterfall
monthlySold comps — $/sqft
last 12 mo · ≤1 miLoading sold comps…