 Multi-family
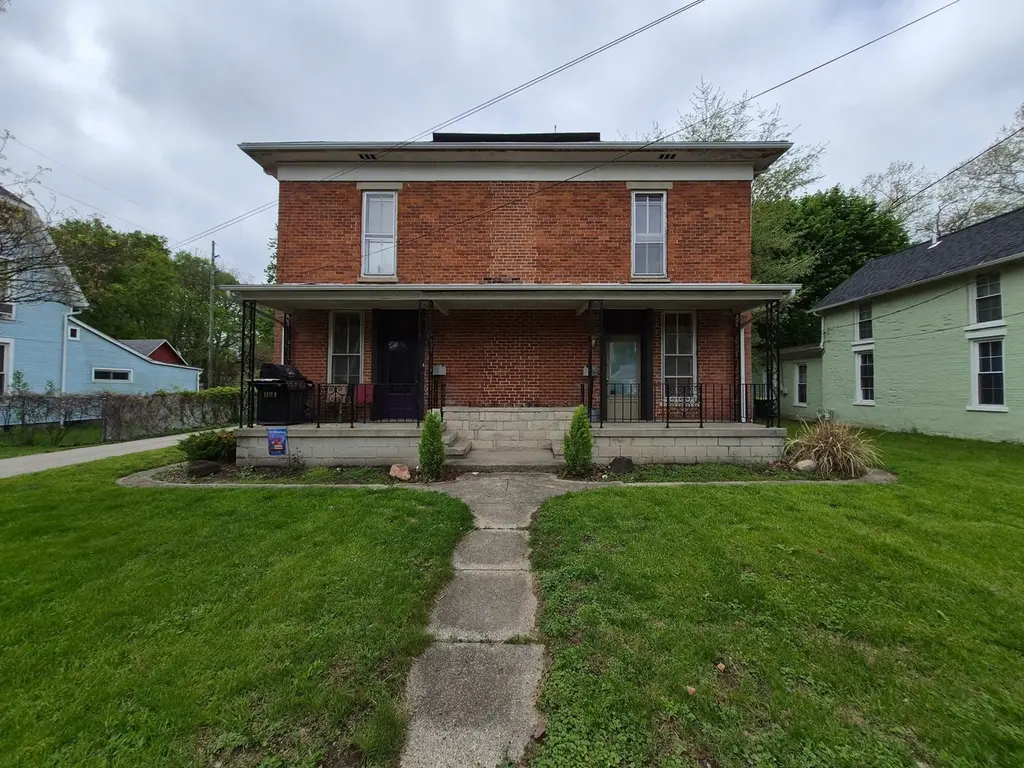
226 Lafontaine St · Huntington, IN
Flood risk 6/10 · Moderate
- FEMA flood zone
- X (unshaded)
- Chance of flooding over 30 yrs
- 0.72%
- Est. flood insurance / yr
- $473 – $860
Fire risk 1/10 · Minimal
- Est. fire insurance / yr
- $717 – $1,331
Heat risk 3/10 · Minor
- Hot days now (above 101°F)
- 7 days/yr
- Hot days in 30 yrs
- 17 days/yr
Wind risk 2/10 · Minimal
- Chance of severe wind over 30 yrs
- —
Air-quality risk 3/10 · Minor
- Unhealthy air days now
- 1 days/yr
- Unhealthy air days in 30 yrs
- 3 days/yr
Risk factors via First Street. Map © Google.
Why this score? — see what drove the C- grade
The composite is a weighted blend of 9 inputs, each scored 0–100. Each bar is that input's sub-score; the figure is the points it added to the 100-point composite (weight × sub-score).
- Cash flow +27.1/30.0
- DSCR +9.4/10.0
- 1% rule +6.5/10.0
- Livability +3.5/5.0
- Schools +3.1/10.0
- Rent growth +2.5/5.0
- Condition / age +2.5/5.0
- ARV discount +0.0/15.0
- Appreciation +0.0/10.0
$185,000
🖨 Deal sheet 📄 Offer letter ✓ Due diligence
Multi-family units
County records classify this as Multi-Family (2-4 Unit). Listing-text estimate: 1 unit. estimate disagrees with records
Listing remarks
Excellent investment opportunity in Huntington! This tenant-occupied duplex features two spacious units, each offering 2 bedrooms, 1.5 bathrooms, and approximately 1,100 square feet of living space. Both tenants currently pay all utilities, making this a strong income-producing property with low owner expenses. Whether you’re looking to expand your rental portfolio or begin investing in multifamily properties, this duplex offers solid rental potential and steady occupancy.
Key facts
- 6,098 sq ft lot
- Built 1900
- Listed 20 days
Property features AI
Finance
- Other: Directions available: From downtown Huntington, head south on Jefferson St toward Market St, then turn left (east) onto Market St. Continue a few blocks and turn right onto S. Lafontaine St. The property will be on your left; Cross street: Fedrick St
- Financial info: Annual taxes listed
- HOA & community: Subdivision: Drover(s)
Exterior
- Parking: Off-street parking
- Security: Security details not specified
- Utilities: Public water; Public sewer
- Home design: Single-family residence; Site-built home; 2-story
- Construction: Brick construction
- Exterior features: Lot approximately 50 x 125 (0.14 acres); Off-street parking
Interior
- Kitchen: Kitchen details not specified
- Bedrooms: Bedrooms not specified
- Flooring: Flooring details not specified
- Bathrooms: 2 full bathrooms; 2 half bathrooms; 2 main-level bathrooms
- Heating & cooling: Central air conditioning; Forced air heating
- Interior features: Partial basement; Total of 8 rooms
- Laundry & utility: Laundry on main level
Neighborhood map
What this means for you Summary
Snapshot
- This is a 4-bed/3.0-bath multifamily listed at $185k.
Deal economics
- At list price, monthly cash flow is $522 ($6k/yr) — positive.
- The deal already cash-flows at list — no discount required.
- Meets the 1% rule at list price ($2k rent vs $185k).
- Recommended offer: $182k (1.5% below list) — sets the bar for market timing.
- Cap rate 9.7% vs local median 4.3% in Huntington — top-decile yield for the area; either an underpriced asset or a hidden risk that comps aren't pricing in. Stress-test before assuming the spread holds.
Location & tenants
- Location reads 69/100 on livability (#193 in IN) — a middle-class / working-renter tenant base. Strengths: crime A+, cost of living A+, housing A+; Watch: health & safety C-, employment D, amenities F.
- Huntington County Community School Corporation (rural): math 34% / reading 39% proficiency, ranked #176 of 301 in IN (top 58%) — families likely to look elsewhere, expect single-tenant / working-renter base with shorter leases.
- Zoned schools: Horace Mann Elementary (math 38% / reading 29%, grade F, #631 of 994 statewide, top 64%, 458 students, 68% FRL); Riverview School (math 29% / reading 40%, grade F, #167 of 330 statewide, top 52%, 503 students, 54% FRL); Huntington North High School (math 30% / reading 55%, grade F, #195 of 369 statewide, top 53%, 1,424 students, 42% FRL) — zoned schools average 54% FRL vs 37% district-wide (17 pts higher); higher-poverty schools than district average — tighter screening recommended.
- Market conditions: 112 active listings in the ZIP; 79 units permitted in Huntington County in 2024 (0 in 5+ unit buildings).
Forward outlook
- Local home prices are declining (-3.0%/yr); year-one equity from $1k of loan paydown is wiped out by about $6k of value loss. Plan a longer hold.
- Huntington County population projected at -14% by 2050 — secular population decline; favor cash flow + early exit over multi-decade hold.
- At projected returns (-3.0% appreciation + 3.0% rent growth), your $52k cash investment doubles in ~10 years — after that, you're playing with house money.
Negotiation context
- It's been on market 20 days — a 2% lower offer ($182k) is reasonable based on typical stale-listing flexibility.
Risks & watch-outs
- Watch-outs: built in 1900 — expect roof / HVAC / electrical / plumbing capex.
- Climate carrying-cost: major flood risk — expect insurance premiums to compound above CPI over the hold.
Questions for the listing agent
- Built in 1900 — when were the roof, HVAC, electrical panel, plumbing, and water heater last replaced?
- Is there a deadline driving the sale (1031 exchange, divorce, estate, relocation)? That informs how much negotiation room exists.
- Schools are D-rated, which usually means shorter tenancies and higher turnover. Who's the typical renter profile here, and what's been the actual vacancy rate?
- What's the average days-on-market for RENTAL listings here right now (not sales)? A rising rental-DOM trend means longer vacancies and softer asking-rent achievability than the comps imply.
- What's the recent tenant-quality profile in this submarket — average credit score on applications, eviction rate, late-payment / NSF rate, and stable-employment percentage? A property-management company in the area should have these aggregated.
- How much new apartment / multifamily construction is in the pipeline within 1–3 miles? Heavy new supply (>2% of stock underway) typically softens rents 12–24 months out; light construction supports rent growth.
Investment metrics
- 1% rule
- 1.15% ✓
- Cap rate
- 9.68%
- Cash-on-cash
- 12.10%
- DSCR
- 1.54
- GRM
- 7.2
CMA / ARV
- ARV (on-the-fly)
- $127,872
- Comps found
- 1
Show comp detail 1 sale within ~0.75 mi
| Address | Dist | Beds/Ba | Sqft | Sold | Price | $/sf | Match |
|---|---|---|---|---|---|---|---|
| 904 N Jefferson St | 0.50mi | 4/2.0 | 2,522 (-5%) | 22mo | $120,000 | $48 | 46 |
Match score weights: distance 35% · size 25% · config 20% · recency 20%. Top-matched comps best support the ARV.
Projected returns pro-forma
-3.0% appreciation · 3.0% rent growth · sell at horizon
- IRR
- 1.6%
- Equity multiple
- 1.06×
- Total profit
- $3,238
- Equity at exit
- $27,584
- IRR
- 11.2%
- Equity multiple
- 1.88×
- Total profit
- $45,478
- Equity at exit
- $15,995
Cash invested: $51,800 (down + closing). Projections, not guarantees.
Landlord ↔ Tenant lean methodology
- Overall (STATE)
- 90 Strongly Landlord-Friendly
- State Indiana
- 90 Strongly Landlord-Friendly · R+11
- County
- — inherits STATE
- City
- — inherits STATE
ZIP-level market 46750
- Home prices YoY
- -33.0%
- Active inventory
- 112
- Price-to-rent
- 14.5×
Monthly cashflow live
- Estimated rent
- $2,129 medium interval (Pro) →
- Mortgage (P&I)
- −$970
- Tax from tax record
- −$112 /mo · $1,350/yr
- Insurance
- −$77
- HOA
- −$0
- Vacancy / Maint / Mgmt
- −$447
- Net cashflow
- $522
Break-even live
2-unit breakdown (identical units grouped — click to expand)
| Units | Beds | Baths | Est. rent |
|---|---|---|---|
| 2× units | 2 | 1.5 | $2,130 |
| #1 | 2 | 1.5 | $1,065 |
| #2 | 2 | 1.5 | $1,065 |
| Total (2 units) | $2,129 | ||
UW: 25.0% down · 7.5% · 30yr · 1.5% tax · 5.0% vac · 8.0% maint · 8.0% mgmt
Financing live
Cash to close
- Down payment
- $46,250
- Closing costs
- $5,550
- Reserves months
- —
- Total cash needed
- —
Loan-product check · same deal, 3 products live
Conventional
25% down · 7.5% · 30yr
- Down + closing
- —
- Monthly P&I
- —
- Monthly cashflow
- —
- DSCR
- —
- Eligible?
- —
Personal DTI + credit; lowest rate.
DSCR
20% down · 8.5% · 30yr
- Down + closing
- —
- Monthly P&I
- —
- Monthly cashflow
- —
- DSCR
- —
- Eligible?
- —
No personal income docs; deal must DSCR.
Hard money
10% down · 12.0% · 12mo
- Down + closing
- —
- Monthly P&I
- —
- Monthly cashflow
- —
- DSCR
- —
- Eligible?
- —
Short-term bridge; refi at stabilization.
Listing history 7 events
-
2026-06-05statusdays on market $185,000 Pending 20 DOM
-
2026-06-03days on market $185,000 Active 19 DOM
-
2026-06-02days on market $185,000 Active 18 DOM
-
2026-06-01days on market $185,000 Active 17 DOM
-
2026-05-31days on market $185,000 Active 16 DOM
-
2026-05-30days on market $185,000 Active 15 DOM
-
2026-05-15$185,000 Active
ⓘ Source: listings_history table (triggers on properties + properties_extension) + one-shot
backfill from property_details.listing_events for pre-trigger history.
Tax reassessment forecast IN · Partial reset (capped growth)
- Current annual tax
- $1,350 · $112/mo
- Projected year-2 tax
- $1,461 · $122/mo
- Expected delta
- +$111/yr (+$9/mo · 8.2%)
ⓘ Screening estimate from a state-policy table — verify with the county assessor before closing.
Climate risk First Street
- Flood 6/10 Major FEMA zone X (unshaded) · 72% chance over 30 yrs
- Wildfire 1/10 Low
- Heat 3/10 Moderate 7 d/yr ≥101°F today · 17 d/yr by 30 yrs out
- Wind 2/10 Low
- Air quality 3/10 Moderate 1 unhealthy d/yr today · 3 by 30 yrs out
Nearby sold comps map
Loading sold comps map…
Walkable amenities ~0.75 mi
Loading nearby amenities…
Taxation est. · year 1
- Rental income
- $25,548
- − Mortgage interest
- −$10,363
- − Property taxes
- −$1,350
- − Insurance
- −$925
- − Repairs & maintenance
- −$2,044
- − Management
- −$2,044
- − Depreciation
- −$5,382
- Taxable income
- $3,441
- Est. tax owed @ 24.0%
- −$826
- After-tax cash flow
- $5,440/yr
For passive investors: Depreciation is non-cash, so a rental often shows a tax loss while cash-flowing — sheltering income. Rental losses are passive: they offset passive income freely, and up to $25,000/yr can offset ordinary (W-2) income if you actively participate and your MAGI is under $100k (phasing out to $0 by $150k); unused losses carry forward. On sale, claimed depreciation is recaptured at up to 25%, and gains may owe capital-gains tax (a 1031 exchange can defer both). Figures are a year-1 estimate at your 24.0% rate — not tax advice; consult a CPA.
Schools (NCES district)
- District
- Huntington County Community School Corporation
- NCES district ID
- 1804710
- Math proficiency
- 34% ▼ -6.00%
- Reading proficiency
- 39% ▼ -10.00%
- Median HH income
- $47,010
- Composite
- 31.29/100
- National rank
- #6013
- State rank
- #176 of 301 in IN
Livability — Huntington
- Score
- 69/100
- State rank
- #193
- US rank
- #8771
Category grades
Schools grade is shown separately in the Schools card above.
Census & demographics
- Census place
- Huntington, IN
- City population
- 27,341
- Population (ZIP)
- 27,341
Population outlook (Huntington County) Hauer SSP2
- Today (2025)
- 35,613 people
- By 2030
- 34,759 · -2.4%
- By 2040
- 32,682 · -8.2%
- By 2050
- 30,495 · -14.4%
- By 2075
- 26,298 · -26.2%
- By 2100
- 22,653 · -36.4%
Race, ethnicity, and origin ACS 2023
- Neighborhood character
- Predominantly White (93%)
- Race & ethnicity
- White 93% Hispanic / Latino 3% Two or more races 2% Black 1%
- Common ancestry
- Italian 2% Slovak 2% Romanian 2%
- Foreign-born
- 2% · China, Canada
- Languages at home
- 96% English-only · Spanish 2% Chinese 1% German/W. Germanic 1%
Political lean MEDSL · Huntington
- 2024 margin
- Solid R (+48.4) · D 24.9% · R 73.3% · Other 1.8%
- 2008→2024 swing
- -21.2pp toward R · 2008: -27.2pp · 2024: -48.4pp
- All cycles
- 2024: R+48.4 2020: R+49.9 2016: R+51.0 2012: R+39.8 2008: R+27.2
Not yet ingested
- Civics
- —
Market trends
- HPI YoY
- ▼ -106.89%
- Current HPI
- 216.5969
- Rent YoY
- —
- Metro
- —
- State GDP YoY
- ▲ 2.90%
- F500 in state
- 18
Industry mix (Fortune 500 HQ in IN)
| Industry | F500 HQs | Revenue |
|---|---|---|
| Industrial Machinery | 2 | $37B |
|
||
| Healthcare | 1 | $177B |
|
||
| Pharmaceuticals | 1 | $45B |
|
||
| Metals / Steel | 1 | $18B |
|
||
| Agriculture | 1 | $17B |
|
||
| Packaging | 1 | $12B |
|
||
Price history
1 event — show timeline
- 2026-05-15 Listed $185,000 IRMLS
Property tax history
+5.7%/yrLatest (2024): $1,350 · -42.3% YoY. Source: county tax records.
Cash-flow waterfall
monthlySold comps — $/sqft
last 12 mo · ≤1 miLoading sold comps…