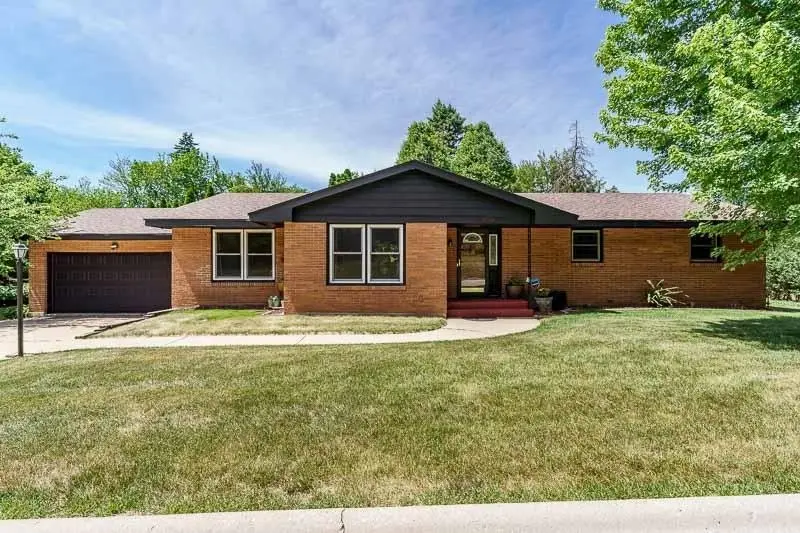
2734 Edgewood Dr · Rockford, IL
Flood risk 1/10 · Minimal
- FEMA flood zone
- X (unshaded)
- Chance of flooding over 30 yrs
- 0.0%
- Est. flood insurance / yr
- $473 – $860
Fire risk 1/10 · Minimal
- Est. fire insurance / yr
- $804 – $1,492
Heat risk 2/10 · Minimal
- Hot days now (above 101°F)
- 7 days/yr
- Hot days in 30 yrs
- 14 days/yr
Wind risk 2/10 · Minimal
- Chance of severe wind over 30 yrs
- —
Air-quality risk 2/10 · Minimal
- Unhealthy air days now
- 1 days/yr
- Unhealthy air days in 30 yrs
- 2 days/yr
Risk factors via First Street. Map © Google.
Why this score? — see what drove the C+ grade
The composite is a weighted blend of 9 inputs, each scored 0–100. Each bar is that input's sub-score; the figure is the points it added to the 100-point composite (weight × sub-score).
- Cash flow +28.1/30.0
- DSCR +10.0/10.0
- ARV discount +9.3/15.0
- 1% rule +7.8/10.0
- Livability +3.1/5.0
- Rent growth +2.5/5.0
- Condition / age +2.5/5.0
- Schools +1.2/10.0
- Appreciation +0.0/10.0
$269,000
🖨 Deal sheet (PDF) 📄 Offer letter ✓ Due diligence
Listing remarks MLS
Feast your eyes on this large Brick Ranch home with much to offer! 3 generously sized bedrooms and 2 full baths on the main floor including an ensuite for the master bed. 2 large living spaces, a formal dining area, and an eat-in kitchen offers plenty of eating and entertainment options in the home. Sliding doors out to the back patio with a privacy fence to the rear yard & mature landscaping. Let's not forget that this home has 1st-floor laundry as well! Downstairs offers a plethora of options with 2 bonus rooms, another finished area with bamboo floors and a large partially finished rec room area, and large storage areas too! 98% efficient furnace, central air, and location! Location! Location! This home is just by the Forest Hills County Club.
Key facts
- 0.23 acre lot
- 2 garage spots
- Built 1960
Property features AI
Finance
- Other: Residential property listed by Gambino Realtors
Exterior
- Parking: Attached garage; Approximately 2.5 garage spaces; Asphalt driveway
- Utilities: Public water; Public sewer
- Home design: Single-family residence (house)
- Construction: Brick exterior; Shingle roof; Below-grade finished area
- Exterior features: Shingle roof; Brick construction; Lot about 0.23 acres
Interior
- Kitchen: Electric cooktop; Oven; Dishwasher; Refrigerator
- Bathrooms: Two full bathrooms (both on main level)
- Heating & cooling: Forced air heating; Central air conditioning
- Interior features: Wood-burning fireplace (1); Full basement
- Laundry & utility: Gas water heater
Neighborhood map
What this means for you Summary
Snapshot
- This is a 3-bed/2.0-bath single-family listed at $269k.
Deal economics
- At list price, monthly cash flow is $841 ($10k/yr) — positive.
- The deal already cash-flows at list — no discount required.
- Meets the 1% rule at list price ($3k rent vs $269k).
- Cap rate 10.0% vs local median 6.1% in Rockford — top-decile yield for the area; either an underpriced asset or a hidden risk that comps aren't pricing in. Stress-test before assuming the spread holds.
Location & tenants
- Location reads 62/100 on livability (#876 in IL) — a middle-class / working-renter tenant base. Strengths: cost of living A+, housing A+, health & safety A+; Watch: crime F, amenities F, commute F.
- Rockford SD 205 (urban): math 12% / reading 16% proficiency, ranked #533 of 620 in IL (top 86%) — low school quality limits family demand, transient renter base, plan for 1-2y turnover; 73% free/reduced lunch — lower-income household profile, screen leases tightly.
- Zoned schools: Clifford P Carlson Elem School (math 12% / reading 12%, grade F, #1,403 of 2,056 statewide, top 71%, 347 students, 0% FRL); Eisenhower Middle School (math 9% / reading 17%, grade F, #540 of 665 statewide, top 82%, 961 students, 0% FRL); Guilford High School (math 15% / reading 28%, grade F, #345 of 693 statewide, top 50%, 2,071 students, 0% FRL) — zoned schools average 0% FRL vs 73% district-wide (73 pts lower); this property's tenant base skews higher-income than the district average.
- Market conditions: 74 active listings in the ZIP; 2 comparable units currently listed for rent nearby; 285 units permitted in Winnebago County in 2024 (0 in 5+ unit buildings).
Forward outlook
- Local home prices are declining (-3.0%/yr); year-one equity from $2k of loan paydown is wiped out by about $8k of value loss. Plan a longer hold.
- Winnebago County population projected at -20% by 2050 — secular population decline; favor cash flow + early exit over multi-decade hold.
- At projected returns (-3.0% appreciation + 3.0% rent growth), your $75k cash investment doubles in ~9 years — after that, you're playing with house money.
Negotiation context
- Only 4 days on market — expect competitive offers; lowballing is unlikely to land.
- 4 sale attempts since 4y ago with the ask held roughly flat each time — persistent listings suggest the price (not the market) is what's stuck; bring a comps-based counter.
- Current owner paid $181k; 49% above their basis — modest negotiation headroom, anchor on the comps not their cost.
Questions for the listing agent
- Built in 1960 — when were the roof, HVAC, electrical panel, plumbing, and water heater last replaced?
- Is there a deadline driving the sale (1031 exchange, divorce, estate, relocation)? That informs how much negotiation room exists.
- Schools are F-rated, which usually means shorter tenancies and higher turnover. Who's the typical renter profile here, and what's been the actual vacancy rate?
- Crime grade is F in this area — have there been break-ins, vandalism, or insurance claims at this property in the last 3 years? What carrier currently insures it and at what premium?
- What's the average days-on-market for RENTAL listings here right now (not sales)? A rising rental-DOM trend means longer vacancies and softer asking-rent achievability than the comps imply.
- What's the recent tenant-quality profile in this submarket — average credit score on applications, eviction rate, late-payment / NSF rate, and stable-employment percentage? A property-management company in the area should have these aggregated.
- How much new for-sale + rental construction is in the pipeline within 1–3 miles? Heavy new supply typically softens prices + rents 12–24 months out; constrained supply supports both.
Investment metrics
- 1% rule
- 1.28% ✓
- Cap rate
- 10.05%
- Cash-on-cash
- 13.41%
- DSCR
- 1.60
- GRM
- 6.5
CMA / ARV
- ARV (on-the-fly)
- $280,250
- Comps found
- 12
Show comp detail 12 sales within ~0.75 mi
| Address | Dist | Beds/Ba | Sqft | Sold | Price | $/sf | Match |
|---|---|---|---|---|---|---|---|
| 4902 Forest Hills Rd | 0.11mi | 4/2.0 (+1) | 2,087 (-7%) | 15mo | $215,000 | $103 | 66 |
| 2615 E Chickadee Trl | 0.21mi | 3/1.5 | 2,038 (-9%) | 10mo | $280,000 | $137 | 64 |
| 2303 Rock Ter | 0.63mi | 3/3.0 | 2,231 (-0%) | 3mo | $525,000 | $235 | 63 |
| 3319 Landstrom Rd | 0.46mi | 4/2.0 (+1) | 2,136 (-5%) | 18mo | $286,000 | $134 | 51 |
| 4903 Illinois St | 0.40mi | 4/2.0 (+1) | 2,062 (-8%) | 15mo | $191,500 | $93 | 50 |
| 3107 Sunnyside Dr | 0.66mi | 3/2.5 | 2,120 (-5%) | 11mo | $202,000 | $95 | 49 |
| 2404 Rock Ter | 0.62mi | 2/3.0 (-1) | 2,213 (-1%) | 15mo | $284,000 | $128 | 48 |
| 2433 Oxford St | 0.74mi | 3/1.5 | 2,059 (-8%) | 4mo | $215,000 | $104 | 47 |
| 5523 Forest Hills Rd | 0.62mi | 3/1.0 | 2,080 (-7%) | 10mo | $175,000 | $84 | 47 |
| 4015 Coventry Dr | 0.74mi | 4/2.5 (+1) | 2,408 (+7%) | 8mo | $299,999 | $125 | 40 |
| 1928 Bradley Rd | 0.70mi | 3/3.5 | 2,450 (+9%) | 7mo | $305,000 | $124 | 40 |
| 2516 Starkweather Rd | 0.68mi | 3/3.0 | 1,920 (-14%) | 8mo | $315,000 | $164 | 34 |
Match score weights: distance 35% · size 25% · config 20% · recency 20%. Top-matched comps best support the ARV.
Projected returns pro-forma
-3.0% appreciation · 3.0% rent growth · sell at horizon
- IRR
- 3.5%
- Equity multiple
- 1.13×
- Total profit
- $10,066
- Equity at exit
- $40,109
- IRR
- 13.0%
- Equity multiple
- 2.04×
- Total profit
- $78,031
- Equity at exit
- $23,258
Cash invested: $75,320 (down + closing). Projections, not guarantees.
Landlord ↔ Tenant lean methodology
- Overall (STATE)
- 43 Moderately Tenant-Leaning
- State Illinois
- 43 Moderately Tenant-Leaning · D+7
- County
- — inherits STATE
- City
- — inherits STATE
ZIP-level market 61114
- Home prices YoY
- -27.1%
- Active inventory
- 74
- Price-to-rent
- 6.5×
Monthly cashflow live
- Estimated rent
- $3,441 medium interval (Pro) →
- Mortgage (P&I)
- −$1,411
- Tax from tax record
- −$354 /mo · $4,250/yr
- Insurance
- −$112
- HOA
- −$0
- Vacancy / Maint / Mgmt
- −$723
- Net cashflow
- $841
Break-even live
Sensitivity live
| Price | -10% $994 | -5% $918 | +0% $841 | +5% $765 | +10% $689 |
|---|---|---|---|---|---|
| Rent | -10% $570 | -5% $706 | +0% $841 | +5% $977 | +10% $1,113 |
| Rate | -1.0pp $977 | -0.5pp $910 | base $841 | +0.5pp $772 | +1.0pp $701 |
UW: 25.0% down · 7.5% · 30yr · 1.5% tax · 5.0% vac · 8.0% maint · 8.0% mgmt
Financing live
Cash to close
- Down payment
- $67,250
- Closing costs
- $8,070
- Reserves months
- —
- Total cash needed
- —
Loan-product check · same deal, 3 products live
Conventional
25% down · 7.5% · 30yr
- Down + closing
- —
- Monthly P&I
- —
- Monthly cashflow
- —
- DSCR
- —
- Eligible?
- —
Personal DTI + credit; lowest rate.
DSCR
20% down · 8.5% · 30yr
- Down + closing
- —
- Monthly P&I
- —
- Monthly cashflow
- —
- DSCR
- —
- Eligible?
- —
No personal income docs; deal must DSCR.
Hard money
10% down · 12.0% · 12mo
- Down + closing
- —
- Monthly P&I
- —
- Monthly cashflow
- —
- DSCR
- —
- Eligible?
- —
Short-term bridge; refi at stabilization.
Rent comps 2 comps
| Address | Beds | Baths | Sqft | Rent | $/sqft | DOM | Units | Dist |
|---|---|---|---|---|---|---|---|---|
| 3121 Carefree Dr Rockford, IL | 4.0 | 2.5 | 3000 | $2,800 | $0.93 | 44d | 1 | 0.68mi |
| 4016 Eaton Dr Unit 1232695P Rockford, IL | 3.0 | 3.0 | 1722 | $4,169 | $2.42 | 14d | 1 | 0.80mi |
Listing history 4 events
-
2026-06-09status $269,000 Pending 4 DOM
-
2026-06-08days on market $269,000 Active 4 DOM
-
2026-06-07remarks 409-char remark
-
2026-06-07$269,000 Active 3 DOM
ⓘ Source: listings_history table (triggers on properties + properties_extension) + one-shot
backfill from property_details.listing_events for pre-trigger history.
Tax reassessment forecast IL · Partial reset (capped growth)
- Current annual tax
- $4,250 · $354/mo
- Projected year-2 tax
- $5,178 · $432/mo
- Expected delta
- +$928/yr (+$77/mo · 21.8%)
ⓘ Screening estimate from a state-policy table — verify with the county assessor before closing.
Climate risk First Street
- Flood 1/10 Low FEMA zone X (unshaded) · 0% chance over 30 yrs
- Wildfire 1/10 Low
- Heat 2/10 Low 7 d/yr ≥101°F today · 14 d/yr by 30 yrs out
- Wind 2/10 Low
- Air quality 2/10 Low 1 unhealthy d/yr today · 2 by 30 yrs out
Nearby sold comps map
Loading sold comps map…
Walkable amenities ~0.75 mi
Loading nearby amenities…
Taxation est. · year 1
- Rental income
- $41,292
- − Mortgage interest
- −$15,068
- − Property taxes
- −$4,250
- − Insurance
- −$1,345
- − Repairs & maintenance
- −$3,303
- − Management
- −$3,303
- − Depreciation
- −$7,825
- Taxable income
- $6,196
- Est. tax owed @ 24.0%
- −$1,487
- After-tax cash flow
- $8,610/yr
For passive investors: Depreciation is non-cash, so a rental often shows a tax loss while cash-flowing — sheltering income. Rental losses are passive: they offset passive income freely, and up to $25,000/yr can offset ordinary (W-2) income if you actively participate and your MAGI is under $100k (phasing out to $0 by $150k); unused losses carry forward. On sale, claimed depreciation is recaptured at up to 25%, and gains may owe capital-gains tax (a 1031 exchange can defer both). Figures are a year-1 estimate at your 24.0% rate — not tax advice; consult a CPA.
Schools (NCES district)
- District
- Rockford SD 205
- NCES district ID
- 1734510
- Math proficiency
- 12% ▼ -2.00%
- Reading proficiency
- 16% ▼ -3.00%
- Median HH income
- $42,533
- Composite
- 12.21/100
- National rank
- #9649
- State rank
- #533 of 620 in IL
Livability — Rockford
- Score
- 62/100
- State rank
- #876
- US rank
- #17035
Category grades
Schools grade is shown separately in the Schools card above.
Census & demographics
- Census place
- Rockford, IL
- City population
- 147,297
- Population (ZIP)
- 15,026
Population outlook (Winnebago County) Hauer SSP2
- Today (2025)
- 271,080 people
- By 2030
- 260,684 · -3.8%
- By 2040
- 238,405 · -12.1%
- By 2050
- 216,129 · -20.3%
- By 2075
- 172,882 · -36.2%
- By 2100
- 135,336 · -50.1%
Race, ethnicity, and origin ACS 2023
- Neighborhood character
- Predominantly White (72%)
- Race & ethnicity
- White 72% Hispanic / Latino 11% Black 10% Two or more races 6% Asian 4%
- Hispanic origin (detail)
- Mexican 10%
- Common ancestry
- Romanian 5% Portuguese 3% Lithuanian 2%
- Foreign-born
- 10% · Canada, Vietnam
- Languages at home
- 85% English-only · Spanish 7% Russian/Polish/Slavic 2% Other Indo-European 2%
Political lean MEDSL · Winnebago
- 2024 margin
- Toss-up / Even · D 49.5% · R 49.0% · Other 1.5%
- 2008→2024 swing
- -12.2pp toward R · 2008: 12.8pp · 2024: 0.6pp
- All cycles
- 2024: D+0.6 2020: D+2.5 2016: R+1.2 2012: D+5.7 2008: D+12.8
Not yet ingested
- Civics
- —
Market trends
- HPI YoY
- ▼ -84.00%
- Current HPI
- 225.8485
- Rent YoY
- —
- Metro
- —
- State GDP YoY
- ▲ 1.59%
- F500 in state
- 60
Industry mix (Fortune 500 HQ in IL)
| Industry | F500 HQs | Revenue |
|---|---|---|
| Insurance | 4 | $201B |
|
||
| Consumer Goods | 4 | $87B |
|
||
| Industrial Machinery | 3 | $64B |
|
||
| Healthcare | 2 | $55B |
|
||
| Retail / Pharmacy | 1 | $148B |
|
||
| Agriculture / Food | 1 | $86B |
|
||
Price history
+202.2% since first listed10 events — show timeline
- 2026-06-04 Listed $269,000 NWIAR
- 2022-06-02 Sold (Public Records) $181,000 Public Records
- 2022-05-31 Sold (MLS) $181,000 NWIAR
- 2022-05-31 Sold (MLS) $181,000 MRED as Distributed by MLS Grid
- 2022-05-04 Pending — MRED as Distributed by MLS Grid
- 2022-05-01 Relisted — MRED as Distributed by MLS Grid
- 2022-05-01 Pending — MRED as Distributed by MLS Grid
- 2022-04-29 Listed $160,000 NWIAR
- 2022-04-28 Listed $160,000 MRED as Distributed by MLS Grid
- 2000-11-06 Sold (Public Records) $89,000 Public Records
Property tax history
+0.2%/yrLatest (2025): $4,250 · +6.6% YoY. Source: county tax records.
Cash-flow waterfall
monthlySold comps — $/sqft
last 12 mo · ≤1 miLoading sold comps…