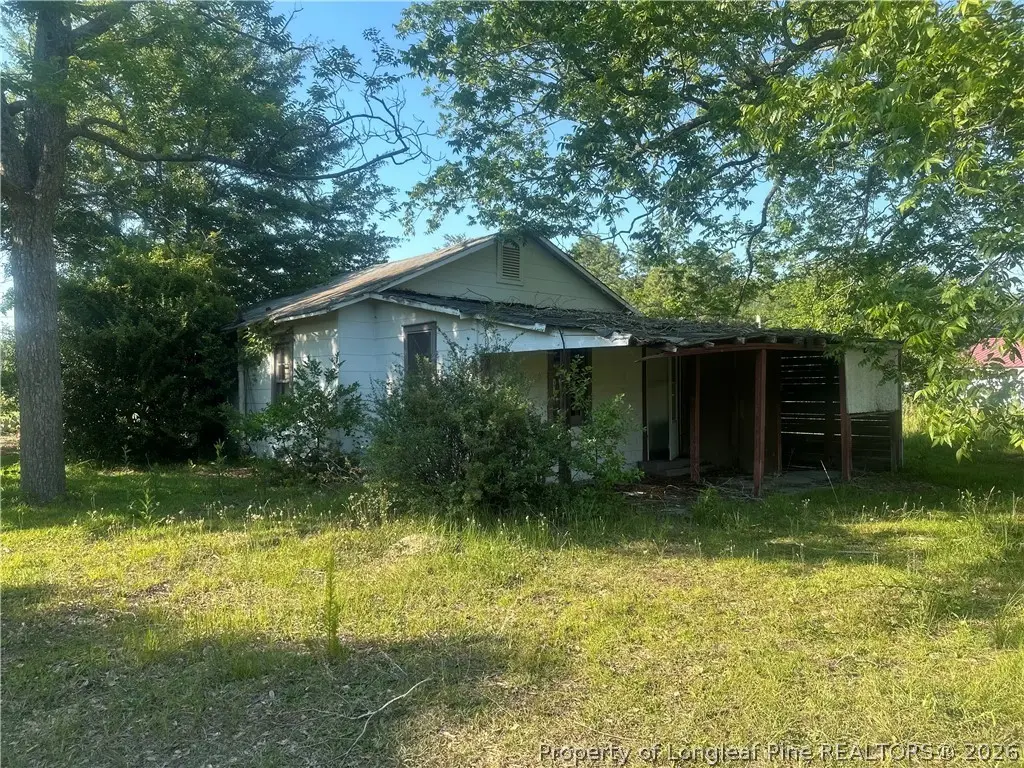
1302 Spring Ave Ave · Spring Lake, NC
Flood risk 1/10 · Minimal
- FEMA flood zone
- X (unshaded)
- Chance of flooding over 30 yrs
- 0.0%
- Est. flood insurance / yr
- $507 – $1,088
Fire risk 7/10 · Major
- Est. fire insurance / yr
- $906 – $1,684
Heat risk 7/10 · Major
- Hot days now (above 106°F)
- 7 days/yr
- Hot days in 30 yrs
- 16 days/yr
Wind risk 6/10 · Moderate
- Chance of severe wind over 30 yrs
- 73.0%
Air-quality risk 1/10 · Minimal
- Unhealthy air days now
- 0 days/yr
- Unhealthy air days in 30 yrs
- 0 days/yr
Risk factors via First Street. Map © Google.
Why this score? — see what drove the B+ grade
The composite is a weighted blend of 9 inputs, each scored 0–100. Each bar is that input's sub-score; the figure is the points it added to the 100-point composite (weight × sub-score).
- Cash flow +30.0/30.0
- ARV discount +15.0/15.0
- 1% rule +10.0/10.0
- DSCR +10.0/10.0
- Rent growth +3.6/5.0
- Schools +3.1/10.0
- Livability +3.0/5.0
- Condition / age +2.5/5.0
- Appreciation +0.0/10.0
$65,000
🖨 Deal sheet (PDF) 📄 Offer letter ✓ Due diligence
Listing remarks
Investor Special – Endless Potential! Located in the heart of Spring Lake, this 3-bedroom, 1 bath home sits on a generous 0.61-acre lot and offers a prime opportunity for investors, flippers, or buyers looking for their next renovation project. Conveniently located just a few minutes from shopping, dining, and everyday amenities, and minutes from Fort Bragg. Property requires significant repairs and is being sold as-is. With its large lot and excellent location, this property is full of potential for the right buyer.
Key facts
- 0.61-acre lot
- Excellent location
- 0.61 acre lot
Tags
Property features AI
Exterior
- Utilities: Public water; Public sewer
- Home design: Single family residence; Residential property
- Construction: Built with other construction materials
- Exterior features: Cleared lot
Interior
- Bedrooms: Total of 4 rooms (bedrooms included)
- Flooring: Other flooring
- Bathrooms: 1 full bathroom
- Heating & cooling: No heating listed
- Interior features: Fireplace (other type); Other flooring
Neighborhood map
What this means for you Summary
Snapshot
- This is a 3-bed/1.0-bath single-family listed at $65k.
Deal economics
- At list price, monthly cash flow is $656 ($8k/yr) — positive.
- The deal already cash-flows at list — no discount required.
- Meets the 1% rule at list price ($1k rent vs $65k).
- Cap rate 18.4% vs local median 4.5% in Spring Lake — top-decile yield for the area; either an underpriced asset or a hidden risk that comps aren't pricing in. Stress-test before assuming the spread holds.
Location & tenants
- Location reads 59/100 on livability (#543 in NC) — a working-class tenant base; expect higher turnover. Strengths: cost of living A+, housing A+; Watch: schools D, crime F, amenities F.
- Cumberland County Schools (urban): math 32% / reading 41% proficiency, ranked #126 of 178 in NC (top 71%) — families likely to look elsewhere, expect single-tenant / working-renter base with shorter leases.
- Market conditions: Rents rising fast (+4.5%/yr); 348 active listings in the ZIP; 16 comparable units currently listed for rent nearby; rentals at typical pace (median 24d on market — plan ~3-4 weeks tenant-placement turnaround); 1,125 units permitted in Cumberland County in 2024 (104 in 5+ unit buildings).
Forward outlook
- Local home prices are declining (-3.0%/yr); year-one equity from $449 of loan paydown is wiped out by about $2k of value loss. Plan a longer hold.
- At projected returns (-3.0% appreciation + 4.5% rent growth), your $18k cash investment doubles in ~3 years — after that, you're playing with house money.
Negotiation context
- Only 12 days on market — expect competitive offers; lowballing is unlikely to land.
Risks & watch-outs
- Watch-outs: built in 1937 — expect roof / HVAC / electrical / plumbing capex.
- Climate carrying-cost: major wind risk, 73% chance of damaging wind over 30y; major wildfire risk; extreme-heat days projected 7→16/yr by 2055 (HVAC capex compounding) — expect insurance premiums to compound above CPI over the hold.
Questions for the listing agent
- Built in 1937 — when were the roof, HVAC, electrical panel, plumbing, and water heater last replaced?
- Is there a deadline driving the sale (1031 exchange, divorce, estate, relocation)? That informs how much negotiation room exists.
- Schools are D-rated, which usually means shorter tenancies and higher turnover. Who's the typical renter profile here, and what's been the actual vacancy rate?
- Crime grade is F in this area — have there been break-ins, vandalism, or insurance claims at this property in the last 3 years? What carrier currently insures it and at what premium?
- What's the average days-on-market for RENTAL listings here right now (not sales)? A rising rental-DOM trend means longer vacancies and softer asking-rent achievability than the comps imply.
- What's the recent tenant-quality profile in this submarket — average credit score on applications, eviction rate, late-payment / NSF rate, and stable-employment percentage? A property-management company in the area should have these aggregated.
- How much new for-sale + rental construction is in the pipeline within 1–3 miles? Heavy new supply typically softens prices + rents 12–24 months out; constrained supply supports both.
Investment metrics
- 1% rule
- 2.07% ✓
- Cap rate
- 18.40%
- Cash-on-cash
- 43.24%
- DSCR
- 2.92
- GRM
- 4.0
CMA / ARV
- ARV (on-the-fly)
- $119,280
- Comps found
- 5
Show comp detail 5 sales within ~0.75 mi
| Address | Dist | Beds/Ba | Sqft | Sold | Price | $/sf | Match |
|---|---|---|---|---|---|---|---|
| 625 Eva Cir | 0.71mi | 2/1.0 (-1) | 842 (-1%) | 1mo | $132,000 | $157 | 59 |
| 1404 Faye Ave | 0.36mi | 3/1.5 | 926 (+9%) | 10mo | $118,000 | $127 | 58 |
| 511 Eva Cir | 0.69mi | 2/1.0 (-1) | 798 (-6%) | 3mo | $112,000 | $140 | 49 |
| 207 S 5th St | 0.57mi | 2/1.0 (-1) | 792 (-7%) | 13mo | $139,000 | $176 | 46 |
| 1611 Bliss Ave | 0.53mi | 3/1.0 | 936 (+10%) | 21mo | $95,000 | $101 | 41 |
Match score weights: distance 35% · size 25% · config 20% · recency 20%. Top-matched comps best support the ARV.
Projected returns pro-forma
-3.0% appreciation · 4.49% rent growth · sell at horizon
- IRR
- 41.7%
- Equity multiple
- 2.83×
- Total profit
- $33,275
- Equity at exit
- $9,692
- IRR
- 48.5%
- Equity multiple
- 6.02×
- Total profit
- $91,384
- Equity at exit
- $5,620
Cash invested: $18,200 (down + closing). Projections, not guarantees.
Landlord ↔ Tenant lean methodology
- Overall (STATE)
- 85 Strongly Landlord-Friendly
- State North Carolina
- 85 Strongly Landlord-Friendly · R+3
- County
- — inherits STATE
- City
- — inherits STATE
ZIP-level market 28390
- Home prices YoY
- -15.2%
- Rents YoY
- 4.5%
- Active inventory
- 348
- Price-to-rent
- 4.0×
Monthly cashflow live
- Estimated rent
- $1,344 high interval (Pro) →
- Mortgage (P&I)
- −$341
- Tax from tax record
- −$38 /mo · $456/yr
- Insurance
- −$27
- HOA
- −$0
- Vacancy / Maint / Mgmt
- −$282
- Net cashflow
- $656
Break-even live
Sensitivity live
| Price | -10% $693 | -5% $674 | +0% $656 | +5% $637 | +10% $619 |
|---|---|---|---|---|---|
| Rent | -10% $550 | -5% $603 | +0% $656 | +5% $709 | +10% $762 |
| Rate | -1.0pp $689 | -0.5pp $672 | base $656 | +0.5pp $639 | +1.0pp $622 |
UW: 25.0% down · 7.5% · 30yr · 1.5% tax · 5.0% vac · 8.0% maint · 8.0% mgmt
Financing live
Cash to close
- Down payment
- $16,250
- Closing costs
- $1,950
- Reserves months
- —
- Total cash needed
- —
Loan-product check · same deal, 3 products live
Conventional
25% down · 7.5% · 30yr
- Down + closing
- —
- Monthly P&I
- —
- Monthly cashflow
- —
- DSCR
- —
- Eligible?
- —
Personal DTI + credit; lowest rate.
DSCR
20% down · 8.5% · 30yr
- Down + closing
- —
- Monthly P&I
- —
- Monthly cashflow
- —
- DSCR
- —
- Eligible?
- —
No personal income docs; deal must DSCR.
Hard money
10% down · 12.0% · 12mo
- Down + closing
- —
- Monthly P&I
- —
- Monthly cashflow
- —
- DSCR
- —
- Eligible?
- —
Short-term bridge; refi at stabilization.
Rent comps 16 comps
| Address | Beds | Baths | Sqft | Rent | $/sqft | DOM | Units | Dist |
|---|---|---|---|---|---|---|---|---|
| 201 Stonebriar Cir Spring Lake, NC | 1.0–3.0 | 1.0–2.0 | 1150 | $1,875 | $1.63 | 14d | 25 | 0.22mi |
| 116 Calvin St Unit A Spring Lake, NC | 2.0 | 1.0 | 634 | $1,025 | $1.62 | 24d | 1 | 0.44mi |
| 118 Calvin St Unit B Spring Lake, NC | 2.0 | 1.0 | 634 | $1,025 | $1.62 | 24d | 1 | 0.44mi |
| 120 Calvin St Unit B Spring Lake, NC | 2.0 | 1.0 | 634 | $1,025 | $1.62 | 24d | 1 | 0.44mi |
| 1306 King St Spring Lake, NC | 2.0 | 1.0 | 968 | $1,047 | $1.08 | 24d | 1 | 0.48mi |
| 1401 Morrison Ave Spring Lake, NC | 3.0 | 1.0 | 1026 | $1,400 | $1.36 | 24d | 1 | 0.48mi |
| 206 S Seventh St Spring Lake, NC | 3.0 | 1.0 | 900 | $1,000 | $1.11 | 24d | 1 | 0.48mi |
| 502 Spring Ave Spring Lake, NC | 3.0 | 1.0 | 950 | $1,150 | $1.21 | 24d | 1 | 0.54mi |
| 401 Spring Ave Spring Lake, NC | 2.0 | 2.0 | 868 | $1,200 | $1.38 | 24d | 1 | 0.64mi |
| 1000 Riverbank Dr Spring Lake, NC | 1.0–3.0 | 1.0–2.0 | 1072 | $1,440 | $1.34 | 14d | 9 | 0.68mi |
| 501 Weaver St #4 Spring Lake, NC | 2.0 | 1.0 | 900 | $850 | $0.94 | 24d | 1 | 0.86mi |
| 100 Spring Ave Unit B Spring Lake, NC | 2.0 | 1.0 | 800 | $825 | $1.03 | 24d | 1 | 0.88mi |
| 310 Elizabeth St Spring Lake, NC | 2.0 | 1.5 | 940 | $1,197 | $1.27 | 24d | 2 | 1.37mi |
| 204 McKenzie Rd Spring Lake, NC | 1.0–3.0 | 1.0–2.0 | 980 | $1,390 | $1.42 | 14d | 17 | 1.41mi |
| 503 Warfield St Spring Lake, NC | 2.0 | 1.5 | 920 | $1,197 | $1.30 | 24d | 1 | 1.42mi |
| 505 Warfield St Spring Lake, NC | 2.0 | 1.5 | 960 | $1,197 | $1.25 | 24d | 1 | 1.42mi |
Listing history 11 events
-
2026-06-18days on market $65,000 Active 12 DOM
-
2026-06-17days on market $65,000 Active 11 DOM
-
2026-06-16days on market $65,000 Active 10 DOM
-
2026-06-15days on market $65,000 Active 9 DOM
-
2026-06-14days on market $65,000 Active 7 DOM
-
2026-06-13days on market $65,000 Active 6 DOM
-
2026-06-10days on market $65,000 Active 4 DOM
-
2026-06-09days on market $65,000 Active 3 DOM
-
2026-06-08days on market $65,000 Active 2 DOM
-
2026-06-07remarks 525-char remark
-
2026-06-07$65,000 Active 1 DOM
ⓘ Source: listings_history table (triggers on properties + properties_extension) + one-shot
backfill from property_details.listing_events for pre-trigger history.
Tax reassessment forecast NC · Resets to sale price
- Current annual tax
- $456 · $38/mo
- Projected year-2 tax
- $533 · $44/mo
- Expected delta
- +$77/yr (+$6/mo · 16.8%)
ⓘ Screening estimate from a state-policy table — verify with the county assessor before closing.
Climate risk First Street
- Flood 1/10 Low FEMA zone X (unshaded) · 0% chance over 30 yrs
- Wildfire 7/10 Severe
- Heat 7/10 Severe 7 d/yr ≥106°F today · 16 d/yr by 30 yrs out
- Wind 6/10 Major 73% chance of damaging wind over 30 yrs
- Air quality 1/10 Low 0 unhealthy d/yr today · 0 by 30 yrs out
Nearby sold comps map
Loading sold comps map…
Walkable amenities ~0.75 mi
Loading nearby amenities…
Taxation est. · year 1
- Rental income
- $16,128
- − Mortgage interest
- −$3,641
- − Property taxes
- −$456
- − Insurance
- −$325
- − Repairs & maintenance
- −$1,290
- − Management
- −$1,290
- − Depreciation
- −$1,891
- Taxable income
- $7,235
- Est. tax owed @ 24.0%
- −$1,736
- After-tax cash flow
- $6,133/yr
For passive investors: Depreciation is non-cash, so a rental often shows a tax loss while cash-flowing — sheltering income. Rental losses are passive: they offset passive income freely, and up to $25,000/yr can offset ordinary (W-2) income if you actively participate and your MAGI is under $100k (phasing out to $0 by $150k); unused losses carry forward. On sale, claimed depreciation is recaptured at up to 25%, and gains may owe capital-gains tax (a 1031 exchange can defer both). Figures are a year-1 estimate at your 24.0% rate — not tax advice; consult a CPA.
Schools (NCES district)
- District
- Cumberland County Schools
- NCES district ID
- 3700011
- Math proficiency
- 32% ▼ -2.00%
- Reading proficiency
- 41% ▼ -1.00%
- Median HH income
- $44,168
- Composite
- 31.0/100
- National rank
- #6096
- State rank
- #126 of 178 in NC
Livability — Spring Lake
- Score
- 59/100
- State rank
- #543
- US rank
- #19811
Category grades
Schools grade is shown separately in the Schools card above.
Census & demographics
- County
- Harnett County · 125,715 people
- City population
- 24,000
- Metro
- Fayetteville, NC
- Population (ZIP)
- 24,000
- Household income
- $62,972
- Rent vs Own
- Severe rent burden
- 811.0
Population outlook (Cumberland County) Hauer SSP2
- Today (2025)
- 330,855 people
- By 2030
- 333,523 · +0.8%
- By 2040
- 335,583 · +1.4%
- By 2050
- 335,325 · +1.4%
- By 2075
- 342,853 · +3.6%
- By 2100
- 340,698 · +3.0%
Race, ethnicity, and origin ACS 2023
- Neighborhood character
- Diverse neighborhood (Simpson 0.70)
- Race & ethnicity
- White 41% Black 33% Hispanic / Latino 14% Two or more races 12% Asian 2% Native American 1%
- Hispanic origin (detail)
- Mexican 6% Puerto Rican 4%
- Common ancestry
- Italian 1% Slovak 1% Romanian 1%
- Foreign-born
- 7% · Canada, South Korea, Jamaica
- Languages at home
- 88% English-only · Spanish 8% German/W. Germanic 1% Korean 1%
Political lean MEDSL · Cumberland
- 2024 margin
- D (+13.4) · D 56.1% · R 42.7% · Other 1.2%
- 2008→2024 swing
- -4.3pp toward R · 2008: 17.7pp · 2024: 13.4pp
- All cycles
- 2024: D+13.4 2020: D+16.6 2016: D+16.0 2012: D+19.7 2008: D+17.7
Not yet ingested
- Civics
- —
Market trends
- HPI YoY
- ▼ -37.43%
- Current HPI
- 207.9349
- Rent YoY
- ▲ 4.49%
- Metro
- Fayetteville, NC
- State GDP YoY
- ▲ 3.28%
- F500 in state
- 26
Industry mix (Fortune 500 HQ in NC)
| Industry | F500 HQs | Revenue |
|---|---|---|
| Financial Services | 2 | $213B |
|
||
| Retail | 2 | $95B |
|
||
| Industrial Conglomerate | 1 | $38B |
|
||
| Metals / Steel | 1 | $35B |
|
||
| Utilities | 1 | $30B |
|
||
| Industrial Machinery | 1 | $19B |
|
||
Price history
1 event — show timeline
- 2026-06-05 Listed $65,000 LPRMLS
Property tax history
+2.2%/yrLatest (2025): $456 · -4.3% YoY. Source: county tax records.
Cash-flow waterfall
monthlySold comps — $/sqft
last 12 mo · ≤1 miLoading sold comps…