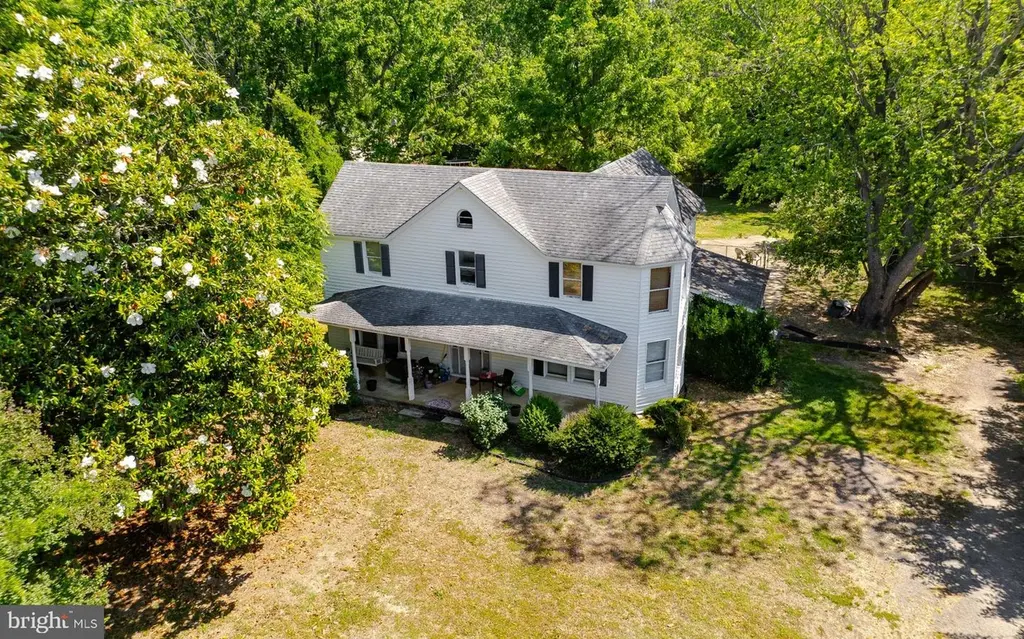
15240 Point Lookout · St. George Island, MD
Flood risk 1/10 · Minimal
- FEMA flood zone
- X (unshaded)
- Chance of flooding over 30 yrs
- 0.0%
- Est. flood insurance / yr
- $507 – $1,088
Fire risk 4/10 · Minor
- Est. fire insurance / yr
- $755 – $1,403
Heat risk 9/10 · Severe
- Hot days now (above 101°F)
- 7 days/yr
- Hot days in 30 yrs
- 18 days/yr
Wind risk 6/10 · Moderate
- Chance of severe wind over 30 yrs
- 75.0%
Air-quality risk 2/10 · Minimal
- Unhealthy air days now
- 1 days/yr
- Unhealthy air days in 30 yrs
- 1 days/yr
Risk factors via First Street. Map © Google.
Why this score? — see what drove the D grade
The composite is a weighted blend of 9 inputs, each scored 0–100. Each bar is that input's sub-score; the figure is the points it added to the 100-point composite (weight × sub-score).
- Cash flow +12.7/30.0
- ARV discount +7.5/15.0
- Appreciation +6.3/10.0
- DSCR +3.8/10.0
- Schools +3.0/10.0
- 1% rule +2.8/10.0
- Rent growth +2.5/5.0
- Livability +2.5/5.0
- Condition / age +2.5/5.0
$333,300
🖨 Deal sheet (PDF) 📄 Offer letter ✓ Due diligence
Listing remarks
A RARE FIND! Vintage Historic 1920 Victorian Styled Home on a terrific level 1.5-acre lot minutes from NESEA and just south of Saint Mary's City. All systems go! Newer roof, 2-year-old updated septic, 2-year-old heating/ac system. Extra-large rooms. Pleasantly Liveable but available for 21st Century updates and restoration. Three original Chimneys are blocked but easily revived. Beautiful lot with quiet setback from Route 5 adjoining large farmland on south side. Propane heat and stove for cooking. Terrific opportunity for FRBO or Bed and Breakfast. Lots of ways to go. Partial rear fenced yard and storage shed.
Key facts
- 1.5 acre lot
- 8 parking spots
- Built 1920
Property features AI
Finance
- Other: Fee simple ownership; Not in a federal flood zone; Ground rent paid annually; Pets allowed with no restrictions; Property condition listed as below average
Exterior
- Parking: Total 8 garage/parking spaces; Driveway with 4 spaces (gravel/crushed stone, unpaved); 4 off-street spaces; Private parking
- Utilities: Private well water; On-site septic; Electric available; Propane available; Cable TV available; Broadband internet
- Home design: Detached structure; Historic property; Building not winterized
- Construction: Vinyl siding; Architectural shingle roof; Foundation: block, pillar/post/pier and concrete perimeter; Double-hung, insulated vinyl-clad windows with screens
- Exterior features: Outbuilding(s) and shed; Chain link partial fencing; Backs to trees, rear yard; Cleared, level and secluded lot in a rural setting; Not in development, unrestricted
Interior
- Kitchen: Dishwasher; Gas range/oven; Refrigerator; Eat-in kitchen
- Bedrooms: One bedroom on the main level; Three bedrooms on the upper level
- Flooring: Carpet; Ceramic tile; Hardwood; Laminate plank/vinyl/laminated wood
- Bathrooms: Three full bathrooms (one on main level, two on upper level)
- Heating & cooling: Forced air heating; Propane (leased) fuel for heating; Electric hot water; Electric cooling (other type listed)
- Interior features: Attic; Stall shower; Tub/shower; Ceiling fans; Combination kitchen/dining; Traditional floor plan; Eat-in kitchen; Walk-in closets; Wood floors; Insulated doors; Drywall and paneled/wood walls
- Laundry & utility: Washer and dryer included; Main floor laundry
Neighborhood map
What this means for you Summary
Snapshot
- This is a 4-bed/2.0-bath single-family listed at $333k.
Deal economics
- At list price, monthly cash flow is $-36 ($-430/yr) — negative.
- To cash-flow at today's rent, offer at most $327k (1.9% below list).
- To meet the 1% rule (rent ≥ 1% of price), the offer needs to be $260k (22.0% below list).
- Recommended offer: $260k (22.0% below list) — sets the bar for 1% rule.
- Cap rate 6.2% vs local median 1.6% in St. George Island — top-decile yield for the area; either an underpriced asset or a hidden risk that comps aren't pricing in. Stress-test before assuming the spread holds.
Location & tenants
- Location reads: area grade D — affects rentability + tenant quality, not the cash-flow math above.
- St. Mary'S County Public Schools (rural): math 23% / reading 38% proficiency, ranked #8 of 24 in MD (top 33%) — families likely to look elsewhere, expect single-tenant / working-renter base with shorter leases.
- Zoned schools: Ridge Elementary (math 17% / reading 22%, grade F, #353 of 860 statewide, top 45%, 216 students, 51% FRL); Spring Ridge Middle (math 15% / reading 39%, grade F, #81 of 225 statewide, top 38%, 987 students, 60% FRL); Great Mills High (math 42% / reading 55%, grade D, #111 of 222 statewide, top 50%, 1,779 students, 55% FRL) — zoned schools average 55% FRL vs 28% district-wide (28 pts higher); higher-poverty schools than district average — tighter screening recommended.
- Market conditions: 8 active listings in the ZIP; 1 comparable units currently listed for rent nearby; 265 units permitted in St. Mary's County in 2024 (0 in 5+ unit buildings).
Forward outlook
- In year one you build about $11k of equity ($2k loan paydown + $9k appreciation (2.6% local appreciation)).
- St. Mary's County population projected at +16% by 2050 — long-run rental-demand tailwind backs the buy-and-hold thesis.
- At projected returns (2.6% appreciation + 3.0% rent growth), your $93k cash investment doubles in ~7 years — after that, you're playing with house money.
- By year 4, paydown + projected appreciation supports a ~$38k cash-out refi (75% LTV) — recoverable capital for the next deal without selling this one.
Negotiation context
- It's been on market 24 days — a 2% lower offer ($328k) is reasonable based on typical stale-listing flexibility.
- Current owner paid $126k; list at $333k implies a 165% gain — meaningful room to come down on a strong offer.
Risks & watch-outs
- Watch-outs: built in 1920 — expect roof / HVAC / electrical / plumbing capex.
- Climate carrying-cost: major wind risk, 75% chance of damaging wind over 30y; extreme-heat days projected 7→18/yr by 2055 (HVAC capex compounding) — expect insurance premiums to compound above CPI over the hold.
Questions for the listing agent
- What do current leases actually rent for vs. the listed asking? Can we see a recent rent roll and the last 12 months of T-12 income?
- Built in 1920 — when were the roof, HVAC, electrical panel, plumbing, and water heater last replaced?
- Is there a deadline driving the sale (1031 exchange, divorce, estate, relocation)? That informs how much negotiation room exists.
- The area grade is low — what's the realistic commute time and amenity access for the typical tenant pool here? Any planned neighborhood developments (good or bad) we should know about?
- What's the average days-on-market for RENTAL listings here right now (not sales)? A rising rental-DOM trend means longer vacancies and softer asking-rent achievability than the comps imply.
- What's the recent tenant-quality profile in this submarket — average credit score on applications, eviction rate, late-payment / NSF rate, and stable-employment percentage? A property-management company in the area should have these aggregated.
- How much new for-sale + rental construction is in the pipeline within 1–3 miles? Heavy new supply typically softens prices + rents 12–24 months out; constrained supply supports both.
Investment metrics
- 1% rule
- 0.78% ✗
- Cap rate
- 6.16%
- Cash-on-cash
- -0.46%
- DSCR
- 0.98
- GRM
- 10.7
CMA / ARV
No comps found within radius.
Projected returns pro-forma
2.64% appreciation · 3.0% rent growth · sell at horizon
- IRR
- 6.0%
- Equity multiple
- 1.34×
- Total profit
- $31,388
- Equity at exit
- $143,072
- IRR
- 9.1%
- Equity multiple
- 2.32×
- Total profit
- $122,923
- Equity at exit
- $215,348
Cash invested: $93,324 (down + closing). Projections, not guarantees.
Landlord ↔ Tenant lean methodology
- Overall (STATE)
- 27 Tenant-Leaning
- State Maryland
- 27 Tenant-Leaning · D+14
- County
- — inherits STATE
- City
- — inherits STATE
ZIP-level market 20684
- Home prices YoY
- 1.1%
- Active inventory
- 8
- Price-to-rent
- 10.7×
Monthly cashflow live
- Estimated rent
- $2,600 medium interval (Pro) →
- Mortgage (P&I)
- −$1,748
- Tax from tax record
- −$203 /mo · $2,438/yr
- Insurance
- −$139
- HOA
- −$0
- Vacancy / Maint / Mgmt
- −$546
- Net cashflow
- $-36
Break-even live
Sensitivity live
| Price | -10% $153 | -5% $58 | +0% $-36 | +5% $-130 | +10% $-225 |
|---|---|---|---|---|---|
| Rent | -10% $-241 | -5% $-139 | +0% $-36 | +5% $67 | +10% $170 |
| Rate | -1.0pp $132 | -0.5pp $49 | base $-36 | +0.5pp $-122 | +1.0pp $-210 |
UW: 25.0% down · 7.5% · 30yr · 1.5% tax · 5.0% vac · 8.0% maint · 8.0% mgmt
Financing live
Cash to close
- Down payment
- $83,325
- Closing costs
- $9,999
- Reserves months
- —
- Total cash needed
- —
Loan-product check · same deal, 3 products live
Conventional
25% down · 7.5% · 30yr
- Down + closing
- —
- Monthly P&I
- —
- Monthly cashflow
- —
- DSCR
- —
- Eligible?
- —
Personal DTI + credit; lowest rate.
DSCR
20% down · 8.5% · 30yr
- Down + closing
- —
- Monthly P&I
- —
- Monthly cashflow
- —
- DSCR
- —
- Eligible?
- —
No personal income docs; deal must DSCR.
Hard money
10% down · 12.0% · 12mo
- Down + closing
- —
- Monthly P&I
- —
- Monthly cashflow
- —
- DSCR
- —
- Eligible?
- —
Short-term bridge; refi at stabilization.
Rent comps 1 comps
| Address | Beds | Baths | Sqft | Rent | $/sqft | DOM | Units | Dist |
|---|---|---|---|---|---|---|---|---|
| 47898 Waterview Dr Saint Inigoes, MD | 3.0 | 2.5 | 1944 | $2,600 | $1.34 | 23d | 1 | 1.13mi |
Listing history 20 events
-
2026-06-22days on market $333,300 Active 24 DOM
-
2026-06-21days on market $333,300 Active 23 DOM
-
2026-06-19days on market $333,300 Active 21 DOM
-
2026-06-18days on market $333,300 Active 20 DOM
-
2026-06-17price $333,300 Active 19 DOM
-
2026-06-17days on market $349,900 Active 19 DOM
-
2026-06-16days on market $349,900 Active 18 DOM
-
2026-06-15days on market $349,900 Active 17 DOM
-
2026-06-14days on market $349,900 Active 15 DOM
-
2026-06-12days on market $349,900 Active 14 DOM
-
2026-06-09days on market $349,900 Active 11 DOM
-
2026-06-08days on market $349,900 Active 10 DOM
-
2026-06-07days on market $349,900 Active 9 DOM
-
2026-06-05days on market $349,900 Active 6 DOM
-
2026-06-02days on market $349,900 Active 4 DOM
-
2026-06-01days on market $349,900 Active 3 DOM
-
2026-05-31days on market $349,900 Active 2 DOM
-
2026-05-30$349,900 Active
-
2026-05-29historical $349,900
-
1996-06-25soldstatus $125,800
ⓘ Source: listings_history table (triggers on properties + properties_extension) + one-shot
backfill from property_details.listing_events for pre-trigger history.
Tax reassessment forecast MD · Partial reset (capped growth)
- Current annual tax
- $2,438 · $203/mo
- Projected year-2 tax
- $3,035 · $253/mo
- Expected delta
- +$598/yr (+$50/mo · 24.5%)
ⓘ Screening estimate from a state-policy table — verify with the county assessor before closing.
Climate risk First Street
- Flood 1/10 Low FEMA zone X (unshaded) · 0% chance over 30 yrs
- Wildfire 4/10 Moderate
- Heat 9/10 Extreme 7 d/yr ≥101°F today · 18 d/yr by 30 yrs out
- Wind 6/10 Major 75% chance of damaging wind over 30 yrs
- Air quality 2/10 Low 1 unhealthy d/yr today · 1 by 30 yrs out
Nearby sold comps map
Loading sold comps map…
Walkable amenities ~0.75 mi
Loading nearby amenities…
Taxation est. · year 1
- Rental income
- $31,200
- − Mortgage interest
- −$18,670
- − Property taxes
- −$2,438
- − Insurance
- −$1,666
- − Repairs & maintenance
- −$2,496
- − Management
- −$2,496
- − Depreciation
- −$9,696
- Taxable loss
- −$6,262
- Est. tax savings @ 24.0%
- +$1,503
- After-tax cash flow
- $1,072/yr
For passive investors: Depreciation is non-cash, so a rental often shows a tax loss while cash-flowing — sheltering income. Rental losses are passive: they offset passive income freely, and up to $25,000/yr can offset ordinary (W-2) income if you actively participate and your MAGI is under $100k (phasing out to $0 by $150k); unused losses carry forward. On sale, claimed depreciation is recaptured at up to 25%, and gains may owe capital-gains tax (a 1031 exchange can defer both). Figures are a year-1 estimate at your 24.0% rate — not tax advice; consult a CPA.
Schools (NCES district)
- District
- St. Mary'S County Public Schools
- NCES district ID
- 2400600
- Math proficiency
- 23% ▼ -23.00%
- Reading proficiency
- 38% ▼ -12.00%
- Median HH income
- $83,240
- Composite
- 29.74/100
- National rank
- #6444
- State rank
- #8 of 24 in MD
Livability — St. George Island
No livability data for this city. (Only ~50 U.S. cities are tracked.)
Census & demographics
- Population (ZIP)
- 825
Population outlook (St. Mary's County) Hauer SSP2
- Today (2025)
- 123,125 people
- By 2030
- 128,374 · +4.3%
- By 2040
- 137,305 · +11.5%
- By 2050
- 143,065 · +16.2%
- By 2075
- 153,408 · +24.6%
- By 2100
- 151,790 · +23.3%
Race, ethnicity, and origin ACS 2023
- Neighborhood character
- Predominantly White (88%)
- Race & ethnicity
- White 88% Two or more races 11% Black 1%
- Common ancestry
- Italian 4% Subsaharan African 3% Lithuanian 2%
- Foreign-born
- 4%
Political lean MEDSL · St. Mary's
- 2024 margin
- R (+17.2) · D 40.2% · R 57.4% · Other 2.4%
- 2008→2024 swing
- -4.4pp toward R · 2008: -12.8pp · 2024: -17.2pp
- All cycles
- 2024: R+17.2 2020: R+13.8 2016: R+24.6 2012: R+16.1 2008: R+12.8
Not yet ingested
- Civics
- —
Market trends
- HPI YoY
- ▲ 2.64%
- Current HPI
- 239.7784
- Rent YoY
- —
- Metro
- —
- State GDP YoY
- ▲ 2.97%
- F500 in state
- 12
Industry mix (Fortune 500 HQ in MD)
| Industry | F500 HQs | Revenue |
|---|---|---|
| Aerospace / Defense | 1 | $71B |
|
||
| Utilities | 1 | $25B |
|
||
| Hotels | 1 | $24B |
|
||
| Consumer Goods | 1 | $7B |
|
||
| Real Estate | 1 | $6B |
|
||
| Chemicals | 1 | $2B |
|
||
Price history
+178.1% since first listed3 events — show timeline
- 2026-05-30 Listed $349,900 BRIGHT MLS
- 2026-05-29 Coming Soon $349,900 BRIGHT MLS
- 1996-06-25 Sold (Public Records) $125,800 Public Records
Property tax history
+3.7%/yrLatest (2025): $2,438 · +3.0% YoY. Source: county tax records.
Cash-flow waterfall
monthlySold comps — $/sqft
last 12 mo · ≤1 miLoading sold comps…