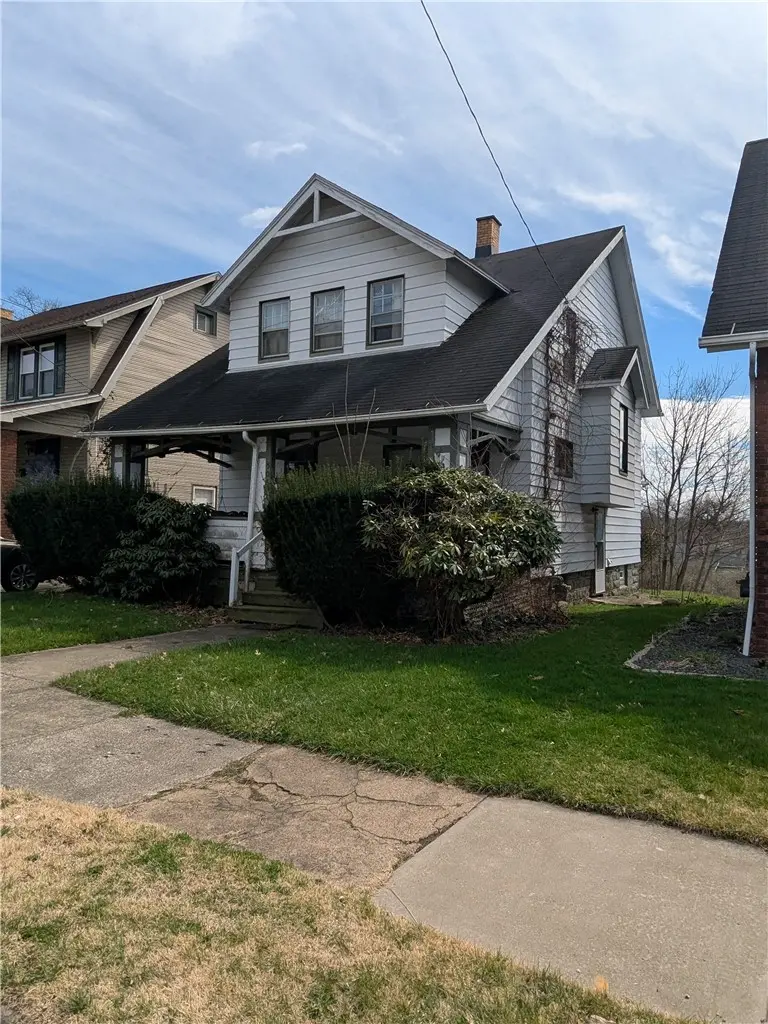
506 E Moody Ave · New Castle, PA
Flood risk 1/10 · Minimal
- FEMA flood zone
- X (unshaded)
- Chance of flooding over 30 yrs
- 0.0%
- Est. flood insurance / yr
- $473 – $860
Fire risk 1/10 · Minimal
- Est. fire insurance / yr
- $511 – $949
Heat risk 3/10 · Minor
- Hot days now (above 96°F)
- 7 days/yr
- Hot days in 30 yrs
- 18 days/yr
Wind risk 1/10 · Minimal
- Chance of severe wind over 30 yrs
- —
Air-quality risk 2/10 · Minimal
- Unhealthy air days now
- 1 days/yr
- Unhealthy air days in 30 yrs
- 3 days/yr
Risk factors via First Street. Map © Google.
Why this score? — see what drove the B+ grade
The composite is a weighted blend of 9 inputs, each scored 0–100. Each bar is that input's sub-score; the figure is the points it added to the 100-point composite (weight × sub-score).
- Cash flow +30.0/30.0
- ARV discount +15.0/15.0
- 1% rule +10.0/10.0
- DSCR +10.0/10.0
- Livability +4.1/5.0
- Rent growth +2.5/5.0
- Condition / age +2.5/5.0
- Schools +1.1/10.0
- Appreciation +0.0/10.0
$72,000
🖨 Deal sheet (PDF) 📄 Offer letter ✓ Due diligence
Listing remarks MLS
This home has a lot of character and charm, especially with the oak woodwork, built-ins, pocket doors, and other vintage features! If you enjoy older homes with architectural details and have the time and budget for renovations, it could definitely be a great investment or fixer-upper opportunity. The home is selling "As-Is".
Key facts
- Pocket doors
- Vintage features
- Oak woodwork
Tags
Neighborhood map
What this means for you Summary
Snapshot
- This is a 3-bed/1.0-bath single-family listed at $72k.
Deal economics
- At list price, monthly cash flow is $542 ($7k/yr) — positive.
- The deal already cash-flows at list — no discount required.
- Meets the 1% rule at list price ($1k rent vs $72k).
- Recommended offer: $68k (6.0% below list) — sets the bar for market timing.
- Cap rate 15.3% vs local median 8.9% in New Castle — top-decile yield for the area; either an underpriced asset or a hidden risk that comps aren't pricing in. Stress-test before assuming the spread holds.
Location & tenants
- Location reads 82/100 on livability (#137 in PA, #1,120 nationally) — a professional / high-income tenant draw. Strengths: crime A+, commute A+, cost of living A+; Watch: amenities F, employment F.
- New Castle Area SD (town): math 9% / reading 19% proficiency, ranked #519 of 539 in PA (top 96%) — low school quality limits family demand, transient renter base, plan for 1-2y turnover; 66% free/reduced lunch — lower-income household profile, screen leases tightly.
- Zoned schools: Harry W Lockley Early Learning Center (775 students, 100% FRL); New Castle Jhs (math 6% / reading 21%, grade F, #482 of 512 statewide, top 94%, 706 students, 100% FRL); New Castle Shs (math 47% / reading 30%, grade F, #280 of 437 statewide, top 64%, 771 students, 100% FRL) — zoned schools average 100% FRL vs 66% district-wide (33 pts higher); higher-poverty schools than district average — tighter screening recommended.
- Zoned-school proficiency averages 26% at this address vs 14% district-wide (+12 pts) — the actual schools serving this property are materially stronger than the New Castle Area SD average implies; a family-tenant draw the district grade alone would hide.
- Market conditions: 107 active listings in the ZIP; 1 comparable units currently listed for rent nearby; 51 units permitted in Lawrence County in 2024 (0 in 5+ unit buildings).
Forward outlook
- Local home prices are declining (-3.0%/yr); year-one equity from $498 of loan paydown is wiped out by about $2k of value loss. Plan a longer hold.
- Lawrence County population projected at -25% by 2050 — secular population decline; favor cash flow + early exit over multi-decade hold.
- At projected returns (-3.0% appreciation + 3.0% rent growth), your $20k cash investment doubles in ~4 years — after that, you're playing with house money.
Negotiation context
- It's been on market 83 days — a 6% lower offer ($68k) is reasonable based on typical stale-listing flexibility.
- 4 sale attempts since 14y ago; this cycle's ask has dropped $13k (15%) from the opening price — seller is motivated, your offer sets the floor, not the list.
- Current owner paid $49k; 47% above their basis — modest negotiation headroom, anchor on the comps not their cost.
Risks & watch-outs
- Watch-outs: built in 1913 — expect roof / HVAC / electrical / plumbing capex.
Questions for the listing agent
- It's been on market 83 days. Have you received any prior offers? Is the seller open to a 6% concession, seller financing, or rate buy-down credit?
- Built in 1913 — when were the roof, HVAC, electrical panel, plumbing, and water heater last replaced?
- Why hasn't it sold? Are there any deal-killer items the seller is aware of (foundation, flood, title, zoning, code violations)?
- Is there a deadline driving the sale (1031 exchange, divorce, estate, relocation)? That informs how much negotiation room exists.
- What's the average days-on-market for RENTAL listings here right now (not sales)? A rising rental-DOM trend means longer vacancies and softer asking-rent achievability than the comps imply.
- What's the recent tenant-quality profile in this submarket — average credit score on applications, eviction rate, late-payment / NSF rate, and stable-employment percentage? A property-management company in the area should have these aggregated.
- How much new for-sale + rental construction is in the pipeline within 1–3 miles? Heavy new supply typically softens prices + rents 12–24 months out; constrained supply supports both.
Investment metrics
- 1% rule
- 1.91% ✓
- Cap rate
- 15.32%
- Cash-on-cash
- 32.24%
- DSCR
- 2.43
- GRM
- 4.4
CMA / ARV
- ARV (median comp)
- $98,834
- List price
- $72,000
- Delta
- -27.15%
- Verdict
- UNDERPRICED
- Comps
- 20 within 1.0 mi
Show comp detail 12 sales within ~0.75 mi
| Address | Dist | Beds/Ba | Sqft | Sold | Price | $/sf | Match |
|---|---|---|---|---|---|---|---|
| 510 Laurel Blvd | 0.08mi | 3/1.0 | 1,401 (+7%) | 3mo | $101,510 | $72 | 83 |
| 902 Delaware Ave | 0.02mi | 3/1.0 | 1,188 (-10%) | 2mo | $109,000 | $92 | 81 |
| 228 E Sheridan Ave | 0.46mi | 3/1.5 | 1,288 (-2%) | 2mo | $140,000 | $109 | 72 |
| 142 E Garfield Ave | 0.52mi | 3/1.0 | 1,359 (+3%) | 3mo | $150,000 | $110 | 68 |
| 1013 Becker St | 0.55mi | 3/2.0 | 1,332 (+1%) | 1mo | $140,000 | $105 | 67 |
| 313 Norwood Ave | 0.63mi | 3/1.0 | 1,344 (+2%) | 2mo | $147,000 | $109 | 65 |
| 511 E Garfield Ave | 0.27mi | 3/2.0 | 1,142 (-13%) | 2mo | $160,000 | $140 | 60 |
| 212 E Garfield Ave | 0.47mi | 3/1.5 | 1,450 (+10%) | 1mo | $103,200 | $71 | 58 |
| 406 N Cascade St | 0.70mi | 2/1.5 (-1) | 1,368 (+4%) | 5mo | $38,000 | $28 | 50 |
| 116 E Euclid Ave | 0.66mi | 3/1.0 | 1,481 (+13%) | 2mo | $167,500 | $113 | 47 |
| 229 E Euclid | 0.53mi | 4/1.5 (+1) | 1,460 (+11%) | 4mo | $189,900 | $130 | 47 |
| 7 W Edison Ave | 0.73mi | 4/1.0 (+1) | 1,144 (-13%) | 1mo | $157,000 | $137 | 39 |
Match score weights: distance 35% · size 25% · config 20% · recency 20%. Top-matched comps best support the ARV.
Projected returns pro-forma
-3.0% appreciation · 3.0% rent growth · sell at horizon
- IRR
- 27.3%
- Equity multiple
- 2.14×
- Total profit
- $22,885
- Equity at exit
- $10,735
- IRR
- 34.9%
- Equity multiple
- 4.20×
- Total profit
- $64,556
- Equity at exit
- $6,225
Cash invested: $20,160 (down + closing). Projections, not guarantees.
Landlord ↔ Tenant lean methodology
- Overall (STATE)
- 62 Landlord-Friendly
- State Pennsylvania
- 62 Landlord-Friendly · EVEN
- County
- — inherits STATE
- City
- — inherits STATE
ZIP-level market 16105
- Home prices YoY
- -26.5%
- Active inventory
- 107
- Price-to-rent
- 4.4×
Monthly cashflow live
- Estimated rent
- $1,375 medium interval (Pro) →
- Mortgage (P&I)
- −$378
- Tax from tax record
- −$137 /mo · $1,644/yr
- Insurance
- −$30
- HOA
- −$0
- Vacancy / Maint / Mgmt
- −$289
- Net cashflow
- $542
Break-even live
Sensitivity live
| Price | -10% $582 | -5% $562 | +0% $542 | +5% $521 | +10% $501 |
|---|---|---|---|---|---|
| Rent | -10% $433 | -5% $487 | +0% $542 | +5% $596 | +10% $650 |
| Rate | -1.0pp $578 | -0.5pp $560 | base $542 | +0.5pp $523 | +1.0pp $504 |
UW: 25.0% down · 7.5% · 30yr · 1.5% tax · 5.0% vac · 8.0% maint · 8.0% mgmt
Financing live
Cash to close
- Down payment
- $18,000
- Closing costs
- $2,160
- Reserves months
- —
- Total cash needed
- —
Loan-product check · same deal, 3 products live
Conventional
25% down · 7.5% · 30yr
- Down + closing
- —
- Monthly P&I
- —
- Monthly cashflow
- —
- DSCR
- —
- Eligible?
- —
Personal DTI + credit; lowest rate.
DSCR
20% down · 8.5% · 30yr
- Down + closing
- —
- Monthly P&I
- —
- Monthly cashflow
- —
- DSCR
- —
- Eligible?
- —
No personal income docs; deal must DSCR.
Hard money
10% down · 12.0% · 12mo
- Down + closing
- —
- Monthly P&I
- —
- Monthly cashflow
- —
- DSCR
- —
- Eligible?
- —
Short-term bridge; refi at stabilization.
Rent comps 1 comps
| Address | Beds | Baths | Sqft | Rent | $/sqft | DOM | Units | Dist |
|---|---|---|---|---|---|---|---|---|
| 932 Morton St New Castle, PA | 3.0 | 1.0 | 1440 | $1,375 | $0.95 | 45d | 1 | 1.43mi |
Listing history 30 events
-
2026-06-21days on market $72,000 Active 83 DOM
-
2026-06-19days on market $72,000 Active 81 DOM
-
2026-06-18days on market $72,000 Active 80 DOM
-
2026-06-17days on market $72,000 Active 79 DOM
-
2026-06-16days on market $72,000 Active 78 DOM
-
2026-06-15days on market $72,000 Active 77 DOM
-
2026-06-14days on market $72,000 Active 75 DOM
-
2026-06-12days on market $72,000 Active 74 DOM
-
2026-06-09days on market $72,000 Active 71 DOM
-
2026-06-08days on market $72,000 Active 70 DOM
-
2026-06-07days on market $72,000 Active 69 DOM
-
2026-06-03days on market $72,000 Active 65 DOM
-
2026-06-02days on market $72,000 Active 64 DOM
-
2026-06-01days on market $72,000 Active 63 DOM
-
2026-05-31days on market $72,000 Active 62 DOM
-
2026-05-30days on market $72,000 Active 61 DOM
-
2026-05-16price $72,000 337-char remark
Show marketing remark (337 chars)
This home has a lot of character and charm, especially with the oak woodwork, built-ins, pocket doors, and other vintage features! If you enjoy older homes with architectural details and have the time and budget for renovations, it could definitely be a great investment or fixer-upper opportunity. The home is selling "As-Is".
-
2026-04-17price $75,000 337-char remark
Show marketing remark (337 chars)
This home has a lot of character and charm, especially with the oak woodwork, built-ins, pocket doors, and other vintage features! If you enjoy older homes with architectural details and have the time and budget for renovations, it could definitely be a great investment or fixer-upper opportunity. The home is selling "As-Is".
-
2026-04-12price $79,000 337-char remark
Show marketing remark (337 chars)
This home has a lot of character and charm, especially with the oak woodwork, built-ins, pocket doors, and other vintage features! If you enjoy older homes with architectural details and have the time and budget for renovations, it could definitely be a great investment or fixer-upper opportunity. The home is selling "As-Is".
-
2026-03-26$85,000 Active 337-char remark
Show marketing remark (337 chars)
This home has a lot of character and charm, especially with the oak woodwork, built-ins, pocket doors, and other vintage features! If you enjoy older homes with architectural details and have the time and budget for renovations, it could definitely be a great investment or fixer-upper opportunity. The home is selling "As-Is".
-
2020-03-18historical Expired 101-char remark
Show marketing remark (101 chars)
Great starter home or investment property. Large bedrooms, finished basement area, hardwood flooring.
-
2019-03-19$49,900 Active 101-char remark
Show marketing remark (101 chars)
Great starter home or investment property. Large bedrooms, finished basement area, hardwood flooring.
-
2017-11-27historical Expired
-
2017-07-27price $49,500
-
2017-05-27$55,000 Active
-
2013-06-10soldstatus $49,000
-
2013-03-21price $47,500
-
2013-03-20soldstatus $49,000
-
2012-04-29$49,000
-
1994-03-07soldstatus $19,000
ⓘ Source: listings_history table (triggers on properties + properties_extension) + one-shot
backfill from property_details.listing_events for pre-trigger history.
Tax reassessment forecast PA · Partial reset (capped growth)
- Current annual tax
- $1,644 · $137/mo
- Projected year-2 tax
- $1,644 · $137/mo
- Expected delta
- $0/yr ($0/mo · 0.0%)
ⓘ Screening estimate from a state-policy table — verify with the county assessor before closing.
Climate risk First Street
- Flood 1/10 Low FEMA zone X (unshaded) · 0% chance over 30 yrs
- Wildfire 1/10 Low
- Heat 3/10 Moderate 7 d/yr ≥96°F today · 18 d/yr by 30 yrs out
- Wind 1/10 Low
- Air quality 2/10 Low 1 unhealthy d/yr today · 3 by 30 yrs out
Nearby sold comps map
Loading sold comps map…
Walkable amenities ~0.75 mi
Loading nearby amenities…
Taxation est. · year 1
- Rental income
- $16,500
- − Mortgage interest
- −$4,033
- − Property taxes
- −$1,644
- − Insurance
- −$360
- − Repairs & maintenance
- −$1,320
- − Management
- −$1,320
- − Depreciation
- −$2,095
- Taxable income
- $5,729
- Est. tax owed @ 24.0%
- −$1,375
- After-tax cash flow
- $5,126/yr
For passive investors: Depreciation is non-cash, so a rental often shows a tax loss while cash-flowing — sheltering income. Rental losses are passive: they offset passive income freely, and up to $25,000/yr can offset ordinary (W-2) income if you actively participate and your MAGI is under $100k (phasing out to $0 by $150k); unused losses carry forward. On sale, claimed depreciation is recaptured at up to 25%, and gains may owe capital-gains tax (a 1031 exchange can defer both). Figures are a year-1 estimate at your 24.0% rate — not tax advice; consult a CPA.
Schools (NCES district)
- District
- New Castle Area SD
- NCES district ID
- 4216620
- Math proficiency
- 9% ▼ -13.00%
- Reading proficiency
- 19% ▼ -23.00%
- Median HH income
- $30,967
- Composite
- 11.08/100
- National rank
- #9736
- State rank
- #519 of 539 in PA
Livability — New Castle
- Score
- 82/100
- State rank
- #137
- US rank
- #1120
Category grades
Schools grade is shown separately in the Schools card above.
Census & demographics
- Census place
- New Castle, PA
- City population
- 30,767
- Population (ZIP)
- 15,195
Population outlook (Lawrence County) Hauer SSP2
- Today (2025)
- 81,781 people
- By 2030
- 77,978 · -4.7%
- By 2040
- 69,522 · -15.0%
- By 2050
- 61,344 · -25.0%
- By 2075
- 45,027 · -44.9%
- By 2100
- 31,305 · -61.7%
Race, ethnicity, and origin ACS 2023
- Neighborhood character
- Predominantly White (93%)
- Race & ethnicity
- White 93% Black 3% Hispanic / Latino 2% Two or more races 1%
- Common ancestry
- Romanian 9% Serbian 3% Lithuanian 3%
- Foreign-born
- 2% · Canada
- Languages at home
- 96% English-only · Other Indo-European 1% Spanish 1% German/W. Germanic 1%
Political lean MEDSL · Lawrence
- 2024 margin
- Solid R (+33.8) · D 32.8% · R 66.5%
- 2008→2024 swing
- -28.7pp toward R · 2008: -5.1pp · 2024: -33.8pp
- All cycles
- 2024: R+33.8 2020: R+29.6 2016: R+28.1 2012: R+9.0 2008: R+5.1
Not yet ingested
- Civics
- —
Market trends
- HPI YoY
- ▼ -62.26%
- Current HPI
- 173.0332
- Rent YoY
- —
- Metro
- —
- State GDP YoY
- ▲ 1.68%
- F500 in state
- 34
Industry mix (Fortune 500 HQ in PA)
| Industry | F500 HQs | Revenue |
|---|---|---|
| Healthcare | 2 | $309B |
|
||
| Insurance | 2 | $27B |
|
||
| Telecommunications / Media | 1 | $124B |
|
||
| Industrial Distribution | 1 | $22B |
|
||
| Financial Services | 1 | $20B |
|
||
| Chemicals / Materials | 1 | $18B |
|
||
Price history
+278.9% since first listed14 events — show timeline
- 2026-05-16 Price Changed $72,000 West Penn MLS
- 2026-04-17 Price Changed $75,000 West Penn MLS
- 2026-04-12 Price Changed $79,000 West Penn MLS
- 2026-03-26 Listed $85,000 West Penn MLS
- 2020-03-18 Delisted — West Penn MLS
- 2019-03-19 Listed $49,900 West Penn MLS
- 2017-11-27 Delisted — West Penn MLS
- 2017-07-27 Price Changed $49,500 West Penn MLS
- 2017-05-27 Listed $55,000 West Penn MLS
- 2013-06-10 Sold (Public Records) $49,000 Public Records
- 2013-03-21 Price Changed $47,500 West Penn MLS
- 2013-03-20 Sold (MLS) $49,000 West Penn MLS
- 2012-04-29 Listed $49,000 West Penn MLS
- 1994-03-07 Sold (Public Records) $19,000 Public Records
Property tax history
+1.3%/yrLatest (2025): $1,644 · -0.5% YoY. Source: county tax records.
Cash-flow waterfall
monthlySold comps — $/sqft
last 12 mo · ≤1 miLoading sold comps…