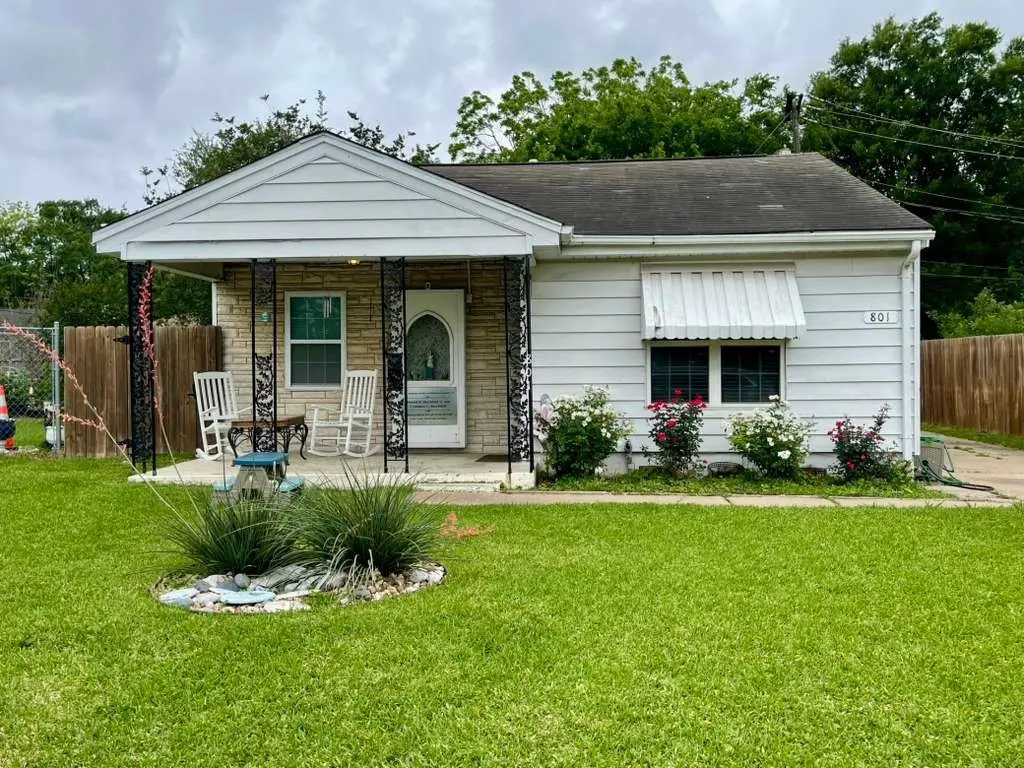
801 Westway St · Galena Park, TX
Flood risk 1/10 · Minimal
- FEMA flood zone
- X (unshaded)
- Chance of flooding over 30 yrs
- 0.0%
- Est. flood insurance / yr
- $507 – $1,088
Fire risk 3/10 · Minor
- Est. fire insurance / yr
- $1,222 – $2,270
Heat risk 9/10 · Severe
- Hot days now (above 109°F)
- 7 days/yr
- Hot days in 30 yrs
- 23 days/yr
Wind risk 9/10 · Severe
- Chance of severe wind over 30 yrs
- 99.0%
Air-quality risk 2/10 · Minimal
- Unhealthy air days now
- 2 days/yr
- Unhealthy air days in 30 yrs
- 2 days/yr
Risk factors via First Street. Map © Google.
Why this score? — see what drove the C grade
The composite is a weighted blend of 9 inputs, each scored 0–100. Each bar is that input's sub-score; the figure is the points it added to the 100-point composite (weight × sub-score).
- Cash flow +13.5/30.0
- ARV discount +13.4/15.0
- Appreciation +7.5/10.0
- 1% rule +5.9/10.0
- DSCR +4.1/10.0
- Livability +3.4/5.0
- Schools +2.8/10.0
- Rent growth +2.5/5.0
- Condition / age +2.5/5.0
$140,000
🖨 Deal sheet (PDF) 📄 Offer letter ✓ Due diligence
Listing remarks
This charming 3-bedroom, 2 full bathroom home boasts a spacious backyard, making it ideal for first-time buyers or investors. A new roof will be installed this weekend, ensuring peace of mind for the future. Complete with its own laundry room, and a front porch where, you can sit and relax, this affordable property is a must-see.
Key facts
- Spacious backyard
- Laundry room
- Front porch
Tags
Property features AI
Finance
- Financial info: Lease not considered
Exterior
- Parking: 2-car garage
- Utilities: Public water; Public sewer
- Home design: Residential property; Single-story (first-floor living/entry level)
- Construction: Built in 1947; Brick and vinyl siding exterior; Composition roof; Slab foundation
- Exterior features: Subdivision lot; Lot approximately 0.224 acres
Interior
- Kitchen: Kitchen on the first floor (11.2 x 10.1)
- Bedrooms: Primary bedroom on the first floor (13.8 x 13.5); Bedroom on the first floor (11.5 x 14.3); Bedroom on the first floor (13.1 x 9.11)
- Bathrooms: 2 full bathrooms
- Heating & cooling: Central heating (gas); Central air conditioning (electric)
- Interior features: 6 total rooms; First-floor living areas
Neighborhood map
What this means for you Summary
Snapshot
- This is a 3-bed/2.0-bath single-family listed at $140k.
Deal economics
- At list price, monthly cash flow is $5 ($58/yr) — positive.
- The deal already cash-flows at list — no discount required.
- Meets the 1% rule at list price ($2k rent vs $140k).
- Cap rate 6.3% vs local median 4.1% in Galena Park — top-decile yield for the area; either an underpriced asset or a hidden risk that comps aren't pricing in. Stress-test before assuming the spread holds.
Location & tenants
- Location reads 68/100 on livability (#456 in TX) — a middle-class / working-renter tenant base. Strengths: crime A+, cost of living A+, housing A+; Watch: amenities F, commute F, employment D-.
- Galena Park ISD (suburban): math 32% / reading 33% proficiency, ranked #578 of 826 in TX (top 70%) — families likely to look elsewhere, expect single-tenant / working-renter base with shorter leases; 74% free/reduced lunch — lower-income household profile, screen leases tightly.
- Zoned schools: Macarthur El (math 40% / reading 33%, grade F, #1,883 of 4,322 statewide, top 44%, 614 students, 89% FRL); Galena Park Middle (math 28% / reading 31%, grade F, #1,077 of 1,662 statewide, top 66%, 943 students, 88% FRL); Galena Park H S (math 37% / reading 36%, grade F, #924 of 1,632 statewide, top 57%, 1,914 students, 87% FRL).
- Market conditions: 38 active listings in the ZIP; 10 comparable units currently listed for rent nearby; rentals at typical pace (median 26d on market — plan ~3-4 weeks tenant-placement turnaround); 40% of comp listings sitting > 30 days — soft ceiling on asking rent; 29,883 units permitted in Harris County in 2024 (8,621 in 5+ unit buildings).
Forward outlook
- In year one you build about $8k of equity ($968 loan paydown + $7k appreciation (5.0% local appreciation)).
- Harris County population projected at +47% by 2050 — long-run rental-demand tailwind backs the buy-and-hold thesis.
- At projected returns (5.0% appreciation + 3.0% rent growth), your $39k cash investment doubles in ~5 years — after that, you're playing with house money.
- By year 5, paydown + projected appreciation supports a ~$34k cash-out refi (75% LTV) — recoverable capital for the next deal without selling this one.
Negotiation context
- Only 7 days on market — expect competitive offers; lowballing is unlikely to land.
Risks & watch-outs
- Watch-outs: property tax is 3.5% of price; built in 1947 — expect roof / HVAC / electrical / plumbing capex.
- Climate carrying-cost: severe wind risk, 99% chance of damaging wind over 30y; extreme-heat days projected 7→23/yr by 2055 (HVAC capex compounding) — expect insurance premiums to compound above CPI over the hold.
Questions for the listing agent
- Built in 1947 — when were the roof, HVAC, electrical panel, plumbing, and water heater last replaced?
- Property tax is high relative to price — has the assessment been appealed recently, and will the sale trigger a re-assessment?
- Is there a deadline driving the sale (1031 exchange, divorce, estate, relocation)? That informs how much negotiation room exists.
- Schools are D-rated, which usually means shorter tenancies and higher turnover. Who's the typical renter profile here, and what's been the actual vacancy rate?
- What's the average days-on-market for RENTAL listings here right now (not sales)? A rising rental-DOM trend means longer vacancies and softer asking-rent achievability than the comps imply.
- What's the recent tenant-quality profile in this submarket — average credit score on applications, eviction rate, late-payment / NSF rate, and stable-employment percentage? A property-management company in the area should have these aggregated.
- How much new for-sale + rental construction is in the pipeline within 1–3 miles? Heavy new supply typically softens prices + rents 12–24 months out; constrained supply supports both.
Investment metrics
- 1% rule
- 1.09% ✓
- Cap rate
- 6.33%
- Cash-on-cash
- 0.15%
- DSCR
- 1.01
- GRM
- 7.6
CMA / ARV
- ARV (on-the-fly)
- $161,160
- Comps found
- 12
Show comp detail 12 sales within ~0.75 mi
| Address | Dist | Beds/Ba | Sqft | Sold | Price | $/sf | Match |
|---|---|---|---|---|---|---|---|
| 2224 11th St | 0.24mi | 3/2.0 | 1,120 (-6%) | 2mo | $179,900 | $161 | 79 |
| 2113 10th St | 0.09mi | 2/2.0 (-1) | 1,103 (-7%) | 7mo | $135,000 | $122 | 74 |
| 2222 8th St | 0.19mi | 3/1.0 | 1,246 (+5%) | 7mo | $149,950 | $120 | 73 |
| 2220 7th St | 0.19mi | 4/2.0 (+1) | 1,114 (-6%) | 7mo | $179,990 | $162 | 70 |
| 2219 15th St | 0.39mi | 3/1.0 | 1,213 (+2%) | 7mo | $94,000 | $77 | 68 |
| 2204 Benson Dr | 0.49mi | 3/2.0 | 1,242 (+5%) | 1mo | $199,999 | $161 | 68 |
| 2515 7th St | 0.51mi | 2/2.0 (-1) | 1,171 (-1%) | 2mo | $169,900 | $145 | 67 |
| 2513 13th St | 0.56mi | 3/1.5 | 1,258 (+6%) | 1mo | $139,999 | $111 | 60 |
| 1512 12th St | 0.57mi | 3/1.0 | 1,052 (-11%) | 2mo | $185,000 | $176 | 49 |
| 1204 Sage Dr | 0.48mi | 3/1.0 | 1,336 (+13%) | 8mo | $160,000 | $120 | 46 |
| 1405 9th St | 0.60mi | 3/1.0 | 1,301 (+10%) | 9mo | $129,000 | $99 | 44 |
| 506 Sage Dr | 0.43mi | 2/1.0 (-1) | 1,008 (-15%) | 4mo | $137,000 | $136 | 43 |
Match score weights: distance 35% · size 25% · config 20% · recency 20%. Top-matched comps best support the ARV.
Projected returns pro-forma
4.96% appreciation · 3.0% rent growth · sell at horizon
- IRR
- 13.0%
- Equity multiple
- 1.83×
- Total profit
- $32,434
- Equity at exit
- $79,007
- IRR
- 14.0%
- Equity multiple
- 3.51×
- Total profit
- $98,277
- Equity at exit
- $136,084
Cash invested: $39,200 (down + closing). Projections, not guarantees.
Landlord ↔ Tenant lean methodology
- Overall (STATE)
- 87 Strongly Landlord-Friendly
- State Texas
- 87 Strongly Landlord-Friendly · R+5
- County
- — inherits STATE
- City
- — inherits STATE
ZIP-level market 77547
- Home prices YoY
- 2.0%
- Active inventory
- 38
- Price-to-rent
- 7.6×
Monthly cashflow live
- Estimated rent
- $1,529 high interval (Pro) →
- Mortgage (P&I)
- −$734
- Tax from tax record
- −$411 /mo · $4,927/yr
- Insurance
- −$58
- HOA
- −$0
- Vacancy / Maint / Mgmt
- −$321
- Net cashflow
- $5
Break-even live
Sensitivity live
| Price | -10% $84 | -5% $44 | +0% $5 | +5% $-35 | +10% $-74 |
|---|---|---|---|---|---|
| Rent | -10% $-116 | -5% $-56 | +0% $5 | +5% $65 | +10% $126 |
| Rate | -1.0pp $75 | -0.5pp $40 | base $5 | +0.5pp $-31 | +1.0pp $-68 |
UW: 25.0% down · 7.5% · 30yr · 1.5% tax · 5.0% vac · 8.0% maint · 8.0% mgmt
Financing live
Cash to close
- Down payment
- $35,000
- Closing costs
- $4,200
- Reserves months
- —
- Total cash needed
- —
Loan-product check · same deal, 3 products live
Conventional
25% down · 7.5% · 30yr
- Down + closing
- —
- Monthly P&I
- —
- Monthly cashflow
- —
- DSCR
- —
- Eligible?
- —
Personal DTI + credit; lowest rate.
DSCR
20% down · 8.5% · 30yr
- Down + closing
- —
- Monthly P&I
- —
- Monthly cashflow
- —
- DSCR
- —
- Eligible?
- —
No personal income docs; deal must DSCR.
Hard money
10% down · 12.0% · 12mo
- Down + closing
- —
- Monthly P&I
- —
- Monthly cashflow
- —
- DSCR
- —
- Eligible?
- —
Short-term bridge; refi at stabilization.
Rent comps 10 comps
| Address | Beds | Baths | Sqft | Rent | $/sqft | DOM | Units | Dist |
|---|---|---|---|---|---|---|---|---|
| 2216 3rd St Galena Park, TX | 3.0 | 2.0 | 1500 | $1,400 | $0.93 | 45d | 1 | 0.30mi |
| 423 Armstrong St Houston, TX | 3.0 | 2.0 | 1090 | $1,499 | $1.38 | 0d | 1 | 0.54mi |
| 403 Armstrong St Houston, TX | 3.0 | 2.0 | 909 | $1,399 | $1.54 | 0d | 1 | 0.61mi |
| 335 Delaware St Houston, TX | 2.0 | 1.0 | 784 | $940 | $1.20 | 14d | 1 | 0.63mi |
| 311 Massachusetts St Unit A Houston, TX | 3.0 | 2.0 | 1184 | $1,700 | $1.44 | 14d | 1 | 0.72mi |
| 205 Bolden St Unit A Houston, TX | 3.0 | 2.0 | 1200 | $2,500 | $2.08 | 45d | 1 | 0.86mi |
| 9743 Veyblum St Unit B Houston, TX | 3.0 | 2.0 | 872 | $1,145 | $1.31 | 6d | 1 | 1.06mi |
| 9821 Turnbow St Unit C Houston, TX | 3.0 | 2.0 | 1140 | $1,720 | $1.51 | 45d | 1 | 1.06mi |
| 9713 Stedman St Unit b Houston, TX | 3.0 | 2.0 | 872 | $1,095 | $1.26 | 45d | 1 | 1.20mi |
| 9710 Tuffly St Houston, TX | 3.0 | 2.0 | 1275 | $1,795 | $1.41 | 25d | 1 | 1.38mi |
Listing history 7 events
-
2026-06-21statusdays on market $140,000 Pending 7 DOM
-
2026-06-18days on market $140,000 Active 6 DOM
-
2026-06-17days on market $140,000 Active 5 DOM
-
2026-06-16days on market $140,000 Active 4 DOM
-
2026-06-15days on market $140,000 Active 3 DOM
-
2026-06-13remarks 331-char remark
-
2026-06-13$140,000 Active 1 DOM
ⓘ Source: listings_history table (triggers on properties + properties_extension) + one-shot
backfill from property_details.listing_events for pre-trigger history.
Tax reassessment forecast TX · Resets to sale price
- Current annual tax
- $4,927 · $411/mo
- Projected year-2 tax
- $4,927 · $411/mo
- Expected delta
- $0/yr ($0/mo · 0.0%)
ⓘ Screening estimate from a state-policy table — verify with the county assessor before closing.
Climate risk First Street
- Flood 1/10 Low FEMA zone X (unshaded) · 0% chance over 30 yrs
- Wildfire 3/10 Moderate
- Heat 9/10 Extreme 7 d/yr ≥109°F today · 23 d/yr by 30 yrs out
- Wind 9/10 Extreme 99% chance of damaging wind over 30 yrs
- Air quality 2/10 Low 2 unhealthy d/yr today · 2 by 30 yrs out
Nearby sold comps map
Loading sold comps map…
Walkable amenities ~0.75 mi
Loading nearby amenities…
Taxation est. · year 1
- Rental income
- $18,348
- − Mortgage interest
- −$7,842
- − Property taxes
- −$4,927
- − Insurance
- −$700
- − Repairs & maintenance
- −$1,468
- − Management
- −$1,468
- − Depreciation
- −$4,073
- Taxable loss
- −$2,130
- Est. tax savings @ 24.0%
- +$511
- After-tax cash flow
- $569/yr
For passive investors: Depreciation is non-cash, so a rental often shows a tax loss while cash-flowing — sheltering income. Rental losses are passive: they offset passive income freely, and up to $25,000/yr can offset ordinary (W-2) income if you actively participate and your MAGI is under $100k (phasing out to $0 by $150k); unused losses carry forward. On sale, claimed depreciation is recaptured at up to 25%, and gains may owe capital-gains tax (a 1031 exchange can defer both). Figures are a year-1 estimate at your 24.0% rate — not tax advice; consult a CPA.
Schools (NCES district)
- District
- Galena Park ISD
- NCES district ID
- 4820250
- Math proficiency
- 32% ▼ -20.00%
- Reading proficiency
- 33% ▼ -7.00%
- Median HH income
- $43,158
- Composite
- 27.62/100
- National rank
- #6927
- State rank
- #578 of 826 in TX
Livability — Galena Park
- Score
- 68/100
- State rank
- #456
- US rank
- #9227
Category grades
Schools grade is shown separately in the Schools card above.
Census & demographics
- Census place
- Galena Park, TX
- City population
- 9,380
- Population (ZIP)
- 9,380
Population outlook (Harris County) Hauer SSP2
- Today (2025)
- 5,571,493 people
- By 2030
- 6,089,821 · +9.3%
- By 2040
- 7,142,806 · +28.2%
- By 2050
- 8,185,864 · +46.9%
- By 2075
- 10,574,329 · +89.8%
- By 2100
- 12,109,958 · +117.4%
Race, ethnicity, and origin ACS 2023
- Neighborhood character
- Predominantly Hispanic (90%)
- Race & ethnicity
- Hispanic / Latino 90% Two or more races 46% Black 5% White 4%
- Hispanic origin (detail)
- Mexican 88%
- Foreign-born
- 32% · Canada
- Languages at home
- 21% English-only · Spanish 79%
Political lean MEDSL · Harris
- 2024 margin
- Lean D (+5.5) · D 52.0% · R 46.4% · Other 1.6%
- 2008→2024 swing
- +3.9pp toward D · 2008: 1.6pp · 2024: 5.5pp
- All cycles
- 2024: D+5.5 2020: D+13.3 2016: D+12.4 2012: D+0.1 2008: D+1.6
Not yet ingested
- Civics
- —
Market trends
- HPI YoY
- ▲ 4.96%
- Current HPI
- 252.9899
- Rent YoY
- —
- Metro
- —
- State GDP YoY
- ▲ 3.95%
- F500 in state
- 110
Industry mix (Fortune 500 HQ in TX)
| Industry | F500 HQs | Revenue |
|---|---|---|
| Energy | 16 | $1,198B |
|
||
| Technology | 5 | $198B |
|
||
| Engineering / Construction | 4 | $72B |
|
||
| Energy Services | 3 | $60B |
|
||
| Utilities | 3 | $41B |
|
||
| Healthcare | 2 | $330B |
|
||
Price history
4 events — show timeline
- 2026-06-12 Listed $140,000 HARMLS
- 2017-01-04 Sold (Public Records) — Public Records
- 2014-10-14 Sold (Public Records) — Public Records
- 1988-01-02 Sold (Public Records) — Public Records
Property tax history
+5.5%/yrLatest (2025): $4,927 · +1.3% YoY. Source: county tax records.
Cash-flow waterfall
monthlySold comps — $/sqft
last 12 mo · ≤1 miLoading sold comps…