1104 Laflor Way · McDonough, GA
Flood risk No data
- FEMA flood zone
- —
- Chance of flooding over 30 yrs
- —
- Est. flood insurance / yr
- —
Fire risk No data
- Est. fire insurance / yr
- —
Heat risk No data
- Hot days now (above threshold)
- —
- Hot days in 30 yrs
- —
Wind risk No data
- Chance of severe wind over 30 yrs
- —
Air-quality risk No data
- Unhealthy air days now
- —
- Unhealthy air days in 30 yrs
- —
Risk factors via First Street. Map © Google.
Why this score? — see what drove the C- grade
The composite is a weighted blend of 9 inputs, each scored 0–100. Each bar is that input's sub-score; the figure is the points it added to the 100-point composite (weight × sub-score).
- Cash flow +17.0/30.0
- ARV discount +15.0/15.0
- 1% rule +6.0/10.0
- DSCR +5.3/10.0
- Livability +3.2/5.0
- Schools +2.6/10.0
- Rent growth +2.4/5.0
- Condition / age +2.2/5.0
- Appreciation +0.0/10.0
$233,740
🖨 Deal sheet 📄 Offer letter ✓ Due diligence
Listing remarks
Offers to be placed on Xome.com. Interior inspections are not available, do not trespass! Forward all inquiries and questions to Xome Customer Service . NO REPRESENTATION TO VALIDITY OF INFORMATION IS MADE, BUYER TO VERIFY ALL INFORMATION WHERIN.
Key facts
- 0.52 acre lot
- 2 garage spots
- Built 2023
Property features AI
Exterior
- Parking: Detached attached garage with 2 covered parking spaces (2 total spaces)
- Utilities: Sewer: Unknown
- Home design: Single-family residence
- Construction: Wood siding and brick exterior; Slab foundation
- Exterior features: Large lot (approximately 0.52 acre); Subdivision: Southern Hills; Directions: Climbing Rose Way to Laflor Way
Interior
- Bathrooms: Three full bathrooms
- Heating & cooling: Heating present
- Interior features: Heating present (see remarks)
Neighborhood map
What this means for you Summary
Snapshot
- This is a 5-bed/3.0-bath single-family listed at $234k. Condition is rated fair.
Deal economics
- At list price, monthly cash flow is $159 ($2k/yr) — positive.
- The deal already cash-flows at list — no discount required.
- Meets the 1% rule at list price ($3k rent vs $234k).
- Recommended offer: $227k (3.0% below list) — sets the bar for market timing.
- Cap rate 7.1% vs local median 3.9% in McDonough — top-decile yield for the area; either an underpriced asset or a hidden risk that comps aren't pricing in. Stress-test before assuming the spread holds.
Location & tenants
- Location reads 63/100 on livability (#279 in GA) — a middle-class / working-renter tenant base. Strengths: cost of living A+, housing A+, employment B; Watch: crime D, amenities F, commute F.
- Henry County (rural): math 24% / reading 33% proficiency, ranked #89 of 174 in GA (top 51%) — low school quality limits family demand, transient renter base, plan for 1-2y turnover.
- Zoned schools: Luella Elementary School (math 27% / reading 27%, grade F, #689 of 1,228 statewide, top 58%, 640 students, 58% FRL); Luella Middle School (math 12% / reading 29%, grade F, #345 of 470 statewide, top 74%, 870 students, 53% FRL); Luella High School (math 12% / reading 22%, grade F, #277 of 424 statewide, top 67%, 1,373 students, 44% FRL).
- Market conditions: Rents soft (-0.3%/yr); 663 active listings in the ZIP; 10 comparable units currently listed for rent nearby; rentals at typical pace (median 20d on market — plan ~3-4 weeks tenant-placement turnaround); solid renter incomes; 1,989 units permitted in Henry County in 2024 (92 in 5+ unit buildings).
- This rent runs 38% of the median local income ($82k/yr) — at the standard rent-burdened threshold; future hikes will face affordability resistance.
Forward outlook
- Local home prices are declining (-3.0%/yr); year-one equity from $2k of loan paydown is wiped out by about $7k of value loss. Plan a longer hold.
- Henry County population projected at +29% by 2050 — long-run rental-demand tailwind backs the buy-and-hold thesis.
Negotiation context
- It's been on market 35 days — a 3% lower offer ($227k) is reasonable based on typical stale-listing flexibility.
Risks & watch-outs
- Watch-outs: property tax is 2.8% of price.
Questions for the listing agent
- It's been on market 35 days. Have you received any prior offers? Is the seller open to a 3% concession, seller financing, or rate buy-down credit?
- Have any recent inspections been done? Can we get a copy of the seller's disclosures and any deferred-maintenance estimates?
- Property tax is high relative to price — has the assessment been appealed recently, and will the sale trigger a re-assessment?
- Is there a deadline driving the sale (1031 exchange, divorce, estate, relocation)? That informs how much negotiation room exists.
- Schools are D-rated, which usually means shorter tenancies and higher turnover. Who's the typical renter profile here, and what's been the actual vacancy rate?
- Crime grade is D in this area — have there been break-ins, vandalism, or insurance claims at this property in the last 3 years? What carrier currently insures it and at what premium?
- What's the average days-on-market for RENTAL listings here right now (not sales)? A rising rental-DOM trend means longer vacancies and softer asking-rent achievability than the comps imply.
- What's the recent tenant-quality profile in this submarket — average credit score on applications, eviction rate, late-payment / NSF rate, and stable-employment percentage? A property-management company in the area should have these aggregated.
- How much new for-sale + rental construction is in the pipeline within 1–3 miles? Heavy new supply typically softens prices + rents 12–24 months out; constrained supply supports both.
Investment metrics
- 1% rule
- 1.10% ✓
- Cap rate
- 7.11%
- Cash-on-cash
- 2.91%
- DSCR
- 1.13
- GRM
- 7.6
CMA / ARV
- ARV (median comp)
- $441,463
- List price
- $233,740
- Delta
- -47.05%
- Verdict
- UNDERPRICED
- Comps
- 20 within 1.0 mi
Show comp detail 12 sales within ~0.75 mi
| Address | Dist | Beds/Ba | Sqft | Sold | Price | $/sf | Match |
|---|---|---|---|---|---|---|---|
| 1224 Hibiscus Way | 0.00mi | 4/3.0 (-1) | 2,315 (-4%) | 11mo | $349,900 | $151 | 79 |
| 541 Baynes Ct | 0.35mi | 4/3.0 (-1) | 2,400 (-0%) | 1mo | $401,999 | $167 | 77 |
| 946 Teabiscuit Way | 0.14mi | 4/2.5 (-1) | 2,300 (-5%) | 9mo | $364,900 | $159 | 71 |
| 1590 Sungrown Way #249 | 0.19mi | 4/3.0 (-1) | 2,500 (+4%) | 12mo | $418,000 | $167 | 70 |
| 1669 Fuma Leaf Way | 0.41mi | 4/3.0 (-1) | 2,500 (+4%) | 7mo | $430,510 | $172 | 64 |
| 1013 Climbing Rose Way | 0.14mi | 4/3.0 (-1) | 2,746 (+14%) | 4mo | $399,500 | $145 | 62 |
| 449 Glouchester Dr | 0.38mi | 4/3.0 (-1) | 2,628 (+9%) | 0mo | $390,350 | $149 | 62 |
| 275 Hawken Trl | 0.54mi | 4/2.5 (-1) | 2,393 (-1%) | 6mo | $327,000 | $137 | 62 |
| 1586 Sungrown Way #247 | 0.19mi | 4/3.0 (-1) | 2,172 (-10%) | 13mo | $385,990 | $178 | 59 |
| 269 Klinetop Dr | 0.31mi | 4/2.5 (-1) | 2,192 (-9%) | 6mo | $280,000 | $128 | 58 |
| 120 Hawken Trl | 0.51mi | 4/3.0 (-1) | 2,303 (-4%) | 10mo | $305,000 | $132 | 55 |
| 315 Ermines Way | 0.59mi | 4/3.0 (-1) | 2,094 (-13%) | 3mo | $324,000 | $155 | 43 |
Match score weights: distance 35% · size 25% · config 20% · recency 20%. Top-matched comps best support the ARV.
Projected returns pro-forma
-3.0% appreciation · 0.0% rent growth · sell at horizon
- IRR
- -15.6%
- Equity multiple
- 0.46×
- Total profit
- $-35,079
- Equity at exit
- $34,851
- IRR
- -14.4%
- Equity multiple
- 0.30×
- Total profit
- $-45,769
- Equity at exit
- $20,210
Cash invested: $65,447 (down + closing). Projections, not guarantees.
Landlord ↔ Tenant lean methodology
- Overall (STATE)
- 90 Strongly Landlord-Friendly
- State Georgia
- 90 Strongly Landlord-Friendly · R+3
- County
- — inherits STATE
- City
- — inherits STATE
ZIP-level market 30253
- Home prices YoY
- -29.4%
- Rents YoY
- -0.3%
- Active inventory
- 663
- Price-to-rent
- 7.6×
Monthly cashflow live
- Estimated rent
- $2,564 high interval (Pro) →
- Mortgage (P&I)
- −$1,226
- Tax from tax record
- −$543 /mo · $6,518/yr
- Insurance
- −$97
- HOA
- −$0
- Vacancy / Maint / Mgmt
- −$538
- Net cashflow
- $159
Break-even live
UW: 25.0% down · 7.5% · 30yr · 1.5% tax · 5.0% vac · 8.0% maint · 8.0% mgmt
Financing live
Cash to close
- Down payment
- $58,435
- Closing costs
- $7,012
- Reserves months
- —
- Total cash needed
- —
Loan-product check · same deal, 3 products live
Conventional
25% down · 7.5% · 30yr
- Down + closing
- —
- Monthly P&I
- —
- Monthly cashflow
- —
- DSCR
- —
- Eligible?
- —
Personal DTI + credit; lowest rate.
DSCR
20% down · 8.5% · 30yr
- Down + closing
- —
- Monthly P&I
- —
- Monthly cashflow
- —
- DSCR
- —
- Eligible?
- —
No personal income docs; deal must DSCR.
Hard money
10% down · 12.0% · 12mo
- Down + closing
- —
- Monthly P&I
- —
- Monthly cashflow
- —
- DSCR
- —
- Eligible?
- —
Short-term bridge; refi at stabilization.
Rent comps 10 comps
| Address | Beds | Baths | Sqft | Rent | $/sqft | DOM | Units | Dist |
|---|---|---|---|---|---|---|---|---|
| 133 Centerra Springs Dr McDonough, GA | 4.0 | 2.5 | 2012 | $1,995 | $0.99 | 15d | 1 | 0.45mi |
| 7000 Lunar Blue Way McDonough, GA | 4.0 | 2.5 | 3317 | $2,900 | $0.87 | 43d | 1 | 0.63mi |
| 4012 Cool Water Cv McDonough, GA | 4.0 | 2.0 | 1843 | $2,081 | $1.13 | 5d | 1 | 0.82mi |
| 108 Rendition Dr McDonough, GA | 5.0 | 3.0 | 3200 | $3,100 | $0.97 | 18d | 1 | 0.86mi |
| 189 Hunters Chase McDonough, GA | 4.0 | 3.0 | 2377 | $2,631 | $1.11 | 12d | 1 | 1.01mi |
| 2001 Reserve Pkwy McDonough, GA | 5.0 | 3.0 | 2454 | $2,660 | $1.08 | 43d | 1 | 1.03mi |
| 1055 Field View Dr McDonough, GA | 4.0 | 2.5 | 2796 | $2,475 | $0.89 | 19d | 1 | 1.23mi |
| 300 Stones Throw Dr McDonough, GA | 4.0 | 3.0 | 1678 | $1,950 | $1.16 | 1d | 1 | 1.44mi |
| 831 White Dove Dr McDonough, GA | 5.0 | 3.0 | 2746 | $2,505 | $0.91 | 24d | 1 | 1.46mi |
| 1714 Bennett Dr McDonough, GA | 4.0 | 2.5 | 2350 | $2,340 | $1.00 | 24d | 1 | 1.47mi |
Listing history 1 events
-
2026-04-23$233,740 Active 246-char remark
ⓘ Source: listings_history table (triggers on properties + properties_extension) + one-shot
backfill from property_details.listing_events for pre-trigger history.
Tax reassessment forecast GA · Resets to sale price
- Current annual tax
- $6,518 · $543/mo
- Projected year-2 tax
- $6,518 · $543/mo
- Expected delta
- $0/yr ($0/mo · 0.0%)
ⓘ Screening estimate from a state-policy table — verify with the county assessor before closing.
Nearby sold comps map
Loading sold comps map…
Walkable amenities ~0.75 mi
Loading nearby amenities…
Taxation est. · year 1
- Rental income
- $30,762
- − Mortgage interest
- −$13,093
- − Property taxes
- −$6,518
- − Insurance
- −$1,169
- − Repairs & maintenance
- −$2,461
- − Management
- −$2,461
- − Depreciation
- −$6,800
- Taxable loss
- −$1,740
- Est. tax savings @ 24.0%
- +$417
- After-tax cash flow
- $2,324/yr
For passive investors: Depreciation is non-cash, so a rental often shows a tax loss while cash-flowing — sheltering income. Rental losses are passive: they offset passive income freely, and up to $25,000/yr can offset ordinary (W-2) income if you actively participate and your MAGI is under $100k (phasing out to $0 by $150k); unused losses carry forward. On sale, claimed depreciation is recaptured at up to 25%, and gains may owe capital-gains tax (a 1031 exchange can defer both). Figures are a year-1 estimate at your 24.0% rate — not tax advice; consult a CPA.
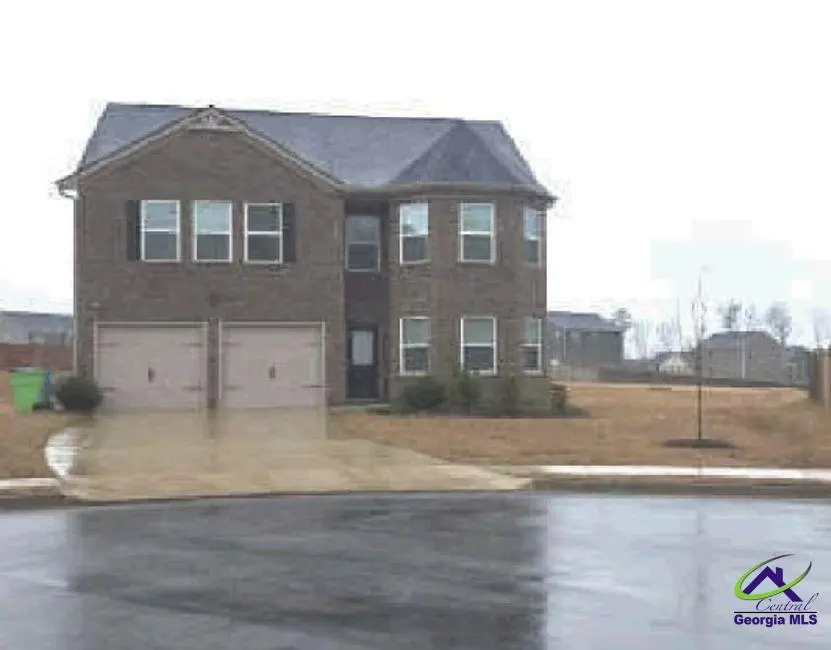
Condition & rehab AI · 1 photo
The home requires moderate repairs to the exterior and roof, with potential for significant value increase through exterior painting and window replacement.
Repairs flagged
- Major Exterior siding — Significant weathering
- Major Roof — Aged appearance
Value-add opportunities
- Both Paint exterior — Enhances curb appeal and value
- Both Replace windows — Improves energy efficiency and value
Renovation cost estimate screening
| Repair item | Severity | Est. cost |
|---|---|---|
| Exterior siding · Significant weathering | Major | $15,000–50,000 |
| Roof · Aged appearance | Major | $15,000–50,000 |
| Total estimated repair cost · 2 items | $30,000–100,000 |
Value-add ROI direction
- Both Paint exterior — Enhances curb appeal and value ↑
- Both Replace windows — Improves energy efficiency and value ↑
ⓘ Cost ranges are severity-bucket heuristics (US national rule-of-thumb). Get contractor quotes + a written scope before underwriting a rehab budget.
Schools (NCES district)
- District
- Henry County
- NCES district ID
- 1302820
- Math proficiency
- 24% ▼ -9.00%
- Reading proficiency
- 33% ▼ -7.00%
- Median HH income
- $62,594
- Composite
- 26.13/100
- National rank
- #7279
- State rank
- #89 of 174 in GA
Livability — McDonough
- Score
- 63/100
- State rank
- #279
- US rank
- #14962
Category grades
Schools grade is shown separately in the Schools card above.
Census & demographics
- County
- Henry County · 316,359 people
- City population
- 114,333
- Metro
- Atlanta-Sandy Springs-Alpharetta, GA
- Population (ZIP)
- 64,779
- Household income
- $81,892
- Rent vs Own
- Severe rent burden
- 2591.0
Population outlook (Henry County) Hauer SSP2
- Today (2025)
- 249,041 people
- By 2030
- 264,369 · +6.2%
- By 2040
- 294,459 · +18.2%
- By 2050
- 322,249 · +29.4%
- By 2075
- 392,310 · +57.5%
- By 2100
- 437,836 · +75.8%
Race, ethnicity, and origin ACS 2023
- Neighborhood character
- Diverse neighborhood (Simpson 0.57)
- Race & ethnicity
- Black 61% White 22% Two or more races 7% Hispanic / Latino 7% Asian 3%
- Hispanic origin (detail)
- Mexican 3%
- Common ancestry
- Hispanic 1% Lithuanian 1% Slovak 1%
- Foreign-born
- 10% · Canada, China, Vietnam
- Languages at home
- 89% English-only · Spanish 5% French/Haitian/Cajun 1% Vietnamese 1%
Political lean MEDSL · Henry
- 2024 margin
- Strong D (+29.7) · D 64.5% · R 34.9%
- 2008→2024 swing
- +37.1pp toward D · 2008: -7.5pp · 2024: 29.7pp
- All cycles
- 2024: D+29.7 2020: D+20.5 2016: D+4.3 2012: R+3.2 2008: R+7.5
Not yet ingested
- Civics
- —
Market trends
- HPI YoY
- ▼ -87.51%
- Current HPI
- 210.679
- Rent YoY
- ▼ -0.35%
- Metro
- Atlanta-Sandy Springs-Alpharetta, GA
- State GDP YoY
- ▲ 2.66%
- F500 in state
- 28
Industry mix (Fortune 500 HQ in GA)
| Industry | F500 HQs | Revenue |
|---|---|---|
| Paper / Packaging | 2 | $29B |
|
||
| Retail | 1 | $160B |
|
||
| Transportation / Logistics | 1 | $91B |
|
||
| Airlines | 1 | $62B |
|
||
| Consumer Goods | 1 | $47B |
|
||
| Utilities | 1 | $25B |
|
||
Price history
2 events — show timeline
- 2026-05-28 Pending — CGMLS
- 2026-04-23 Listed $233,740 CGMLS
Property tax history
+150.7%/yrLatest (2025): $6,518 · +1.9% YoY. Source: county tax records.
Cash-flow waterfall
monthlySold comps — $/sqft
last 12 mo · ≤1 miLoading sold comps…