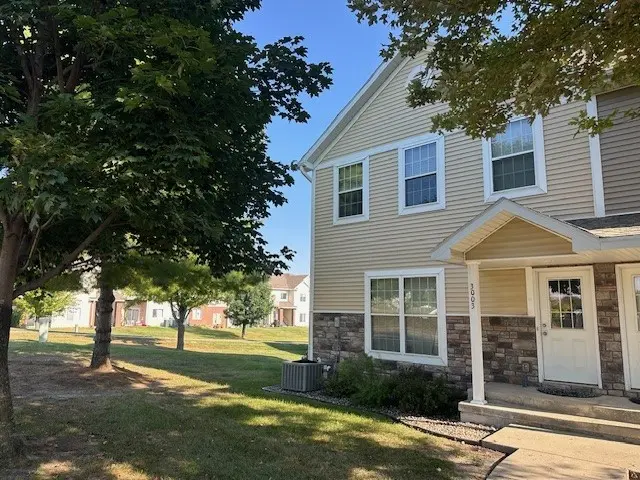
3003 SW White Birch Dr · Ankeny, IA
Flood risk 1/10 · Minimal
- FEMA flood zone
- X (unshaded)
- Chance of flooding over 30 yrs
- 0.0%
- Est. flood insurance / yr
- $473 – $860
Fire risk 3/10 · Minor
- Est. fire insurance / yr
- $902 – $1,676
Heat risk 3/10 · Minor
- Hot days now (above 104°F)
- 7 days/yr
- Hot days in 30 yrs
- 15 days/yr
Wind risk 2/10 · Minimal
- Chance of severe wind over 30 yrs
- —
Air-quality risk 1/10 · Minimal
- Unhealthy air days now
- 0 days/yr
- Unhealthy air days in 30 yrs
- 0 days/yr
Risk factors via First Street. Map © Google.
Why this score? — see what drove the D- grade
The composite is a weighted blend of 9 inputs, each scored 0–100. Each bar is that input's sub-score; the figure is the points it added to the 100-point composite (weight × sub-score).
- ARV discount +15.0/15.0
- Schools +7.1/10.0
- Cash flow +5.5/30.0
- Livability +4.6/5.0
- Rent growth +2.7/5.0
- 1% rule +2.5/10.0
- Condition / age +2.5/5.0
- DSCR +0.0/10.0
- Appreciation +0.0/10.0
$219,900
🖨 Deal sheet (PDF) 📄 Offer letter ✓ Due diligence
Listing remarks
Super Nice area in Ankeny, Huge Living room! 2 car attached garage under unit. Nice big Deck and open Kitchen and Living room. Corner lot so lots of yard space. 2 Nice size bathrooms by the bedrooms.
Key facts
- Deck
- Open kitchen
- Corner lot
Tags
Property features AI
Finance
- Other: Pets allowed with breed restrictions
- HOA & community: Homeowners association (White Birch Townhomes HOA) with monthly fee of $265; Association managed by Sentry Management; HOA fee covers grounds maintenance and snow removal
Exterior
- Parking: Attached two-car garage
- Security: Smoke detector(s)
- Utilities: Public water; Public sewer; Concrete road access
- Home design: Two-story; Cement siding; Asphalt shingle roof; Block foundation; Zoned R
- Construction: Cement siding construction; Block foundation; Asphalt shingle roof
- Exterior features: Deck
Interior
- Kitchen: Dishwasher; Stove; Microwave; Refrigerator; Freezer
- Flooring: Carpet; Tile
- Bathrooms: 1 full bathroom; 1 three-quarter bathroom; 1 half bathroom
- Heating & cooling: Forced air heating (electric and gas); Central air conditioning
- Interior features: Dining area; Partial basement; Gas log fireplace (1)
- Laundry & utility: Washer; Dryer
Neighborhood map
What this means for you Summary
Snapshot
- This is a 3-bed/2.5-bath single-family listed at $220k.
Deal economics
- At list price, monthly cash flow is $-470 ($-6k/yr) — negative.
- To cash-flow at today's rent, offer at most $137k (37.8% below list).
- To meet the 1% rule (rent ≥ 1% of price), the offer needs to be $166k (24.5% below list).
- Recommended offer: $137k (37.8% below list) — sets the bar for cash-flow.
- Cap rate 3.7% vs local median 3.0% in Ankeny — meaningfully above typical; check what's discounted (condition, days-on-market, listing class) to confirm the premium yield is real.
Location & tenants
- Location reads 92/100 on livability (#3 in IA, #29 nationally) — a professional / high-income tenant draw. Strengths: amenities A+, employment A+, housing A+; Watch: commute C-.
- Ankeny Community School District (suburban): math 80% / reading 82% proficiency, ranked #15 of 289 in IA (top 5%) — strong family-tenant draw, lease renewals of 3-5y typical; only 10% free/reduced lunch — higher-income household profile.
- Zoned schools: Crocker Elementary School (math 88% / reading 76%, grade A+, #44 of 616 statewide, top 9%, 500 students, 19% FRL); Parkview Middle School (math 76% / reading 83%, grade A+, #35 of 246 statewide, top 16%, 867 students, 23% FRL); Ankeny High School (math 77% / reading 84%, grade A, #30 of 336 statewide, top 9%, 1,347 students, 20% FRL).
- Market conditions: Rents flat; 498 active listings in the ZIP; 11 comparable units currently listed for rent nearby; rentals at typical pace (median 16d on market — plan ~3-4 weeks tenant-placement turnaround); high-income renter base; 2,953 units permitted in Polk County in 2024 (540 in 5+ unit buildings).
- This rent is only 17% of the median local income ($118k/yr) — well below the 30% rent-burden line; pricing power to push rent on renewal without tenant pushback.
Forward outlook
- Local home prices are declining (-3.0%/yr); year-one equity from $2k of loan paydown is wiped out by about $7k of value loss. Plan a longer hold.
- Polk County population projected at +37% by 2050 — long-run rental-demand tailwind backs the buy-and-hold thesis.
Negotiation context
- It's been on market 61 days — a 6% lower offer ($207k) is reasonable based on typical stale-listing flexibility.
- 3 sale attempts since 21y ago with the ask held roughly flat each time — persistent listings suggest the price (not the market) is what's stuck; bring a comps-based counter.
- Current owner paid $141k; list at $220k implies a 56% gain — meaningful room to come down on a strong offer.
Questions for the listing agent
- What do current leases actually rent for vs. the listed asking? Can we see a recent rent roll and the last 12 months of T-12 income?
- It's been on market 61 days. Have you received any prior offers? Is the seller open to a 38% concession, seller financing, or rate buy-down credit?
- What does the HOA fee cover, when was the last increase, and are there any pending special assessments or reserve-fund shortfalls?
- Why hasn't it sold? Are there any deal-killer items the seller is aware of (foundation, flood, title, zoning, code violations)?
- Is there a deadline driving the sale (1031 exchange, divorce, estate, relocation)? That informs how much negotiation room exists.
- Schools are A-rated — typically a magnet for longer-tenancy family renters. What's the average tenant stay here, and is there a school-zone premium baked into asking?
- The area grade is low — what's the realistic commute time and amenity access for the typical tenant pool here? Any planned neighborhood developments (good or bad) we should know about?
- What's the average days-on-market for RENTAL listings here right now (not sales)? A rising rental-DOM trend means longer vacancies and softer asking-rent achievability than the comps imply.
- What's the recent tenant-quality profile in this submarket — average credit score on applications, eviction rate, late-payment / NSF rate, and stable-employment percentage? A property-management company in the area should have these aggregated.
- How much new for-sale + rental construction is in the pipeline within 1–3 miles? Heavy new supply typically softens prices + rents 12–24 months out; constrained supply supports both.
Investment metrics
- 1% rule
- 0.75% ✗
- Cap rate
- 3.73%
- Cash-on-cash
- -9.16%
- DSCR
- 0.59
- GRM
- 11.0
CMA / ARV
- ARV (median comp)
- $315,012
- List price
- $219,900
- Delta
- -30.19%
- Verdict
- UNDERPRICED
- Comps
- 20 within 1.0 mi
Show comp detail 12 sales within ~0.75 mi
| Address | Dist | Beds/Ba | Sqft | Sold | Price | $/sf | Match |
|---|---|---|---|---|---|---|---|
| 2523 SW 31st St | 0.49mi | 3/2.5 | 1,405 (+2%) | 2mo | $325,000 | $231 | 73 |
| 2506 SW 31st St | 0.44mi | 3/2.5 | 1,470 (+6%) | 0mo | $300,000 | $204 | 68 |
| 2617 SW 32nd St | 0.57mi | 3/2.5 | 1,405 (+2%) | 3mo | $302,000 | $215 | 68 |
| 3105 SW Townpark Dr | 0.60mi | 3/2.5 | 1,419 (+3%) | 2mo | $303,000 | $214 | 66 |
| 3213 SW Townpark Cir | 0.64mi | 3/2.5 | 1,367 (-1%) | 4mo | $280,000 | $205 | 66 |
| 2814 SW Homestead Cir | 0.64mi | 3/2.0 | 1,405 (+2%) | 2mo | $310,000 | $221 | 64 |
| 2821 SW Homestead Cir | 0.66mi | 3/1.5 | 1,367 (-1%) | 2mo | $317,500 | $232 | 62 |
| 2522 SW 32nd St | 0.50mi | 4/2.5 (+1) | 1,462 (+6%) | 2mo | $317,500 | $217 | 60 |
| 1118 SW Ankeny Rd | 0.63mi | 3/2.5 | 1,288 (-7%) | 1mo | $332,000 | $258 | 58 |
| 2813 SW Tradition Cir | 0.64mi | 3/2.5 | 1,464 (+6%) | 2mo | $268,500 | $183 | 58 |
| 2822 SW Homestead Cir | 0.66mi | 3/2.5 | 1,520 (+10%) | 2mo | $318,000 | $209 | 50 |
| 2806 SW Homestead Cir | 0.62mi | 3/1.5 | 1,187 (-14%) | 1mo | $300,000 | $253 | 43 |
Match score weights: distance 35% · size 25% · config 20% · recency 20%. Top-matched comps best support the ARV.
Projected returns pro-forma
-3.0% appreciation · 0.75% rent growth · sell at horizon
- IRR
- -35.6%
- Equity multiple
- -0.12×
- Total profit
- $-69,055
- Equity at exit
- $32,788
- IRR
- -68.7%
- Equity multiple
- -0.82×
- Total profit
- $-112,335
- Equity at exit
- $19,013
Cash invested: $61,572 (down + closing). Projections, not guarantees.
Landlord ↔ Tenant lean methodology
- Overall (STATE)
- 83 Strongly Landlord-Friendly
- State Iowa
- 83 Strongly Landlord-Friendly · R+6
- County
- — inherits STATE
- City
- — inherits STATE
ZIP-level market 50023
- Rents YoY
- 0.8%
- Active inventory
- 498
- Price-to-rent
- 11.0×
Monthly cashflow live
- Estimated rent
- $1,660 high interval (Pro) →
- Mortgage (P&I)
- −$1,153
- Tax from tax record
- −$271 /mo · $3,256/yr
- Insurance
- −$92
- HOA
- −$265
- Vacancy / Maint / Mgmt
- −$349
- Net cashflow
- $-470
Break-even live
Sensitivity live
| Price | -10% $-345 | -5% $-408 | +0% $-470 | +5% $-532 | +10% $-594 |
|---|---|---|---|---|---|
| Rent | -10% $-601 | -5% $-536 | +0% $-470 | +5% $-404 | +10% $-339 |
| Rate | -1.0pp $-359 | -0.5pp $-414 | base $-470 | +0.5pp $-527 | +1.0pp $-585 |
UW: 25.0% down · 7.5% · 30yr · 1.5% tax · 5.0% vac · 8.0% maint · 8.0% mgmt
Financing live
Cash to close
- Down payment
- $54,975
- Closing costs
- $6,597
- Reserves months
- —
- Total cash needed
- —
Loan-product check · same deal, 3 products live
Conventional
25% down · 7.5% · 30yr
- Down + closing
- —
- Monthly P&I
- —
- Monthly cashflow
- —
- DSCR
- —
- Eligible?
- —
Personal DTI + credit; lowest rate.
DSCR
20% down · 8.5% · 30yr
- Down + closing
- —
- Monthly P&I
- —
- Monthly cashflow
- —
- DSCR
- —
- Eligible?
- —
No personal income docs; deal must DSCR.
Hard money
10% down · 12.0% · 12mo
- Down + closing
- —
- Monthly P&I
- —
- Monthly cashflow
- —
- DSCR
- —
- Eligible?
- —
Short-term bridge; refi at stabilization.
Rent comps 11 comps
| Address | Beds | Baths | Sqft | Rent | $/sqft | DOM | Units | Dist |
|---|---|---|---|---|---|---|---|---|
| 3011 SW Sharmin Ln Ankeny, IA | 2.0 | 2.0 | 1056 | $1,440 | $1.36 | 45d | 1 | 0.11mi |
| 3044 SW Sharmin Ln Ankeny, IA | 2.0 | 2.0 | 1056 | $1,475 | $1.40 | 45d | 1 | 0.11mi |
| 3181 SW Sharmin Ln Ankeny, IA | 2.0 | 2.0 | 1056 | $1,495 | $1.42 | 16d | 1 | 0.22mi |
| 2333 SW Plaza Pkwy Ankeny, IA | 2.0 | 1.0–2.0 | 886 | $1,740 | $1.96 | 16d | 16 | 0.45mi |
| 1210 SW 28th St Ankeny, IA | 1.0–3.0 | 1.0–3.0 | 962 | $1,950 | $2.03 | 16d | 20 | 0.50mi |
| 905 SW 28th St Ankeny, IA | 1.0–3.0 | 1.0–2.0 | 988 | $1,760 | $1.78 | 16d | 13 | 0.61mi |
| 1155 SW Prairie Trail Pkwy Ankeny, IA | 1.0–2.0 | 1.0–2.0 | 837 | $1,900 | $2.27 | 16d | 69 | 0.95mi |
| 1205 SW Merchant St Ankeny, IA | 1.0–2.0 | 1.0–2.0 | 874 | $2,025 | $2.32 | 16d | 11 | 0.99mi |
| 205 SW 48th St Ankeny, IA | 4.0 | 3.0 | 1484 | $2,295 | $1.55 | 45d | 1 | 1.31mi |
| 1010 SW Magazine Rd Ankeny, IA | 1.0–2.0 | 1.0–2.0 | 1080 | $3,015 | $2.79 | 16d | 56 | 1.32mi |
| 1370 SW Radcliffe Ln Ankeny, IA | 2.0 | 2.0 | 1457 | $2,027 | $1.39 | 16d | 11 | 1.49mi |
HOA detail
- Monthly dues
- $265 · $3,180/yr
Listing history 23 events
-
2026-06-21days on market $219,900 Active 61 DOM
-
2026-06-18days on market $219,900 Active 58 DOM
-
2026-06-17days on market $219,900 Active 57 DOM
-
2026-06-16days on market $219,900 Active 56 DOM
-
2026-06-15days on market $219,900 Active 55 DOM
-
2026-06-14days on market $219,900 Active 53 DOM
-
2026-06-13days on market $219,900 Active 52 DOM
-
2026-06-10days on market $219,900 Active 50 DOM
-
2026-06-09days on market $219,900 Active 49 DOM
-
2026-06-08days on market $219,900 Active 48 DOM
-
2026-06-07days on market $219,900 Active 47 DOM
-
2026-06-03days on market $219,900 Active 43 DOM
-
2026-06-02days on market $219,900 Active 42 DOM
-
2026-06-01days on market $219,900 Active 41 DOM
-
2026-05-31days on market $219,900 Active 40 DOM
-
2026-05-31days on market $219,900 Active 39 DOM
-
2026-04-21$225,000 Active 199-char remark
-
2026-01-31historical
-
2025-11-03price $225,000
-
2025-10-23price $230,000
-
2025-09-30$235,000 Active
-
2006-01-05soldstatus $141,000
-
2005-10-27$139,900
ⓘ Source: listings_history table (triggers on properties + properties_extension) + one-shot
backfill from property_details.listing_events for pre-trigger history.
Tax reassessment forecast IA · Partial reset (capped growth)
- Current annual tax
- $3,256 · $271/mo
- Projected year-2 tax
- $3,354 · $280/mo
- Expected delta
- +$98/yr (+$8/mo · 3.0%)
ⓘ Screening estimate from a state-policy table — verify with the county assessor before closing.
Climate risk First Street
- Flood 1/10 Low FEMA zone X (unshaded) · 0% chance over 30 yrs
- Wildfire 3/10 Moderate
- Heat 3/10 Moderate 7 d/yr ≥104°F today · 15 d/yr by 30 yrs out
- Wind 2/10 Low
- Air quality 1/10 Low 0 unhealthy d/yr today · 0 by 30 yrs out
Nearby sold comps map
Loading sold comps map…
Walkable amenities ~0.75 mi
Loading nearby amenities…
Taxation est. · year 1
- Rental income
- $19,917
- − Mortgage interest
- −$12,318
- − Property taxes
- −$3,256
- − Insurance
- −$1,100
- − Repairs & maintenance
- −$1,593
- − Management
- −$1,593
- − HOA
- −$3,180
- − Depreciation
- −$6,397
- Taxable loss
- −$9,521
- Est. tax savings @ 24.0%
- +$2,285
- After-tax cash flow
- $-3,355/yr
For passive investors: Depreciation is non-cash, so a rental often shows a tax loss while cash-flowing — sheltering income. Rental losses are passive: they offset passive income freely, and up to $25,000/yr can offset ordinary (W-2) income if you actively participate and your MAGI is under $100k (phasing out to $0 by $150k); unused losses carry forward. On sale, claimed depreciation is recaptured at up to 25%, and gains may owe capital-gains tax (a 1031 exchange can defer both). Figures are a year-1 estimate at your 24.0% rate — not tax advice; consult a CPA.
Schools (NCES district)
- District
- Ankeny Community School District
- NCES district ID
- 1903690
- Math proficiency
- 80% ▼ -5.00%
- Reading proficiency
- 82% ▬ 0.00%
- Median HH income
- $75,384
- Composite
- 70.91/100
- National rank
- #246
- State rank
- #15 of 289 in IA
Livability — Ankeny
- Score
- 92/100
- State rank
- #3
- US rank
- #29
Category grades
Schools grade is shown separately in the Schools card above.
Census & demographics
- Census place
- Ankeny, IA
- County
- Polk County · 453,298 people
- City population
- 76,589
- Metro
- Des Moines-West Des Moines, IA
- Population (ZIP)
- 46,306
- Household income
- $117,826
- Rent vs Own
- Severe rent burden
- 617.0
Population outlook (Polk County) Hauer SSP2
- Today (2025)
- 548,042 people
- By 2030
- 588,557 · +7.4%
- By 2040
- 670,629 · +22.4%
- By 2050
- 752,830 · +37.4%
- By 2075
- 955,069 · +74.3%
- By 2100
- 1,115,436 · +103.5%
Race, ethnicity, and origin ACS 2023
- Neighborhood character
- Predominantly White (90%)
- Race & ethnicity
- White 90% Two or more races 4% Asian 3% Hispanic / Latino 3% Black 1%
- Common ancestry
- Portuguese 6% Iranian 3% Slovak 2%
- Foreign-born
- 4% · Canada, South Korea, Vietnam
- Languages at home
- 93% English-only · Spanish 2% Other Asian/Pacific 2% Russian/Polish/Slavic 1%
Political lean MEDSL · Polk
- 2024 margin
- D (+10.9) · D 54.8% · R 43.9% · Other 1.3%
- 2008→2024 swing
- -3.7pp toward R · 2008: 14.6pp · 2024: 10.9pp
- All cycles
- 2024: D+10.9 2020: D+15.2 2016: D+11.5 2012: D+14.2 2008: D+14.6
Not yet ingested
- Civics
- —
Market trends
- HPI YoY
- ▼ -135.67%
- Current HPI
- 215.1034
- Rent YoY
- ▲ 0.75%
- Metro
- Des Moines-West Des Moines, IA
- State GDP YoY
- ▲ 2.48%
- F500 in state
- 4
Industry mix (Fortune 500 HQ in IA)
| Industry | F500 HQs | Revenue |
|---|---|---|
| Financial Services | 1 | $16B |
|
||
| Retail / Convenience | 1 | $15B |
|
||
Price history
+57.2% since first listed8 events — show timeline
- 2026-05-22 Price Changed $219,900 DMMLS
- 2026-04-21 Listed $225,000 DMMLS
- 2026-01-31 Listing Removed — DMMLS
- 2025-11-03 Price Changed $225,000 DMMLS
- 2025-10-23 Price Changed $230,000 DMMLS
- 2025-09-30 Listed $235,000 DMMLS
- 2006-01-05 Sold (Public Records) $141,000 Public Records
- 2005-10-27 Listed $139,900 DMMLS
Property tax history
+0.9%/yrLatest (2025): $3,256 · +2.1% YoY. Source: county tax records.
Cash-flow waterfall
monthlySold comps — $/sqft
last 12 mo · ≤1 miLoading sold comps…