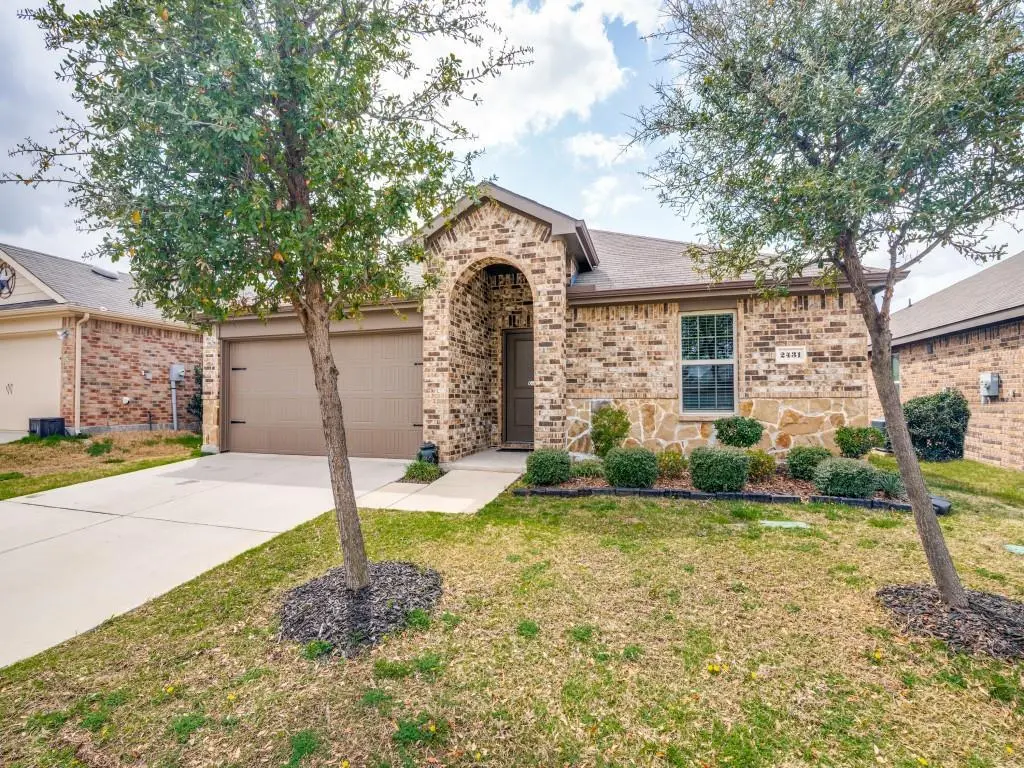
2431 Rosharon Dr · Travis Ranch, TX
Flood risk 1/10 · Minimal
- FEMA flood zone
- X (unshaded)
- Chance of flooding over 30 yrs
- 0.0%
- Est. flood insurance / yr
- $507 – $1,088
Fire risk 3/10 · Minor
- Est. fire insurance / yr
- $1,222 – $2,270
Heat risk 8/10 · Major
- Hot days now (above 110°F)
- 7 days/yr
- Hot days in 30 yrs
- 26 days/yr
Wind risk 6/10 · Moderate
- Chance of severe wind over 30 yrs
- 27.0%
Air-quality risk 2/10 · Minimal
- Unhealthy air days now
- 1 days/yr
- Unhealthy air days in 30 yrs
- 1 days/yr
Risk factors via First Street. Map © Google.
Why this score? — see what drove the D grade
The composite is a weighted blend of 9 inputs, each scored 0–100. Each bar is that input's sub-score; the figure is the points it added to the 100-point composite (weight × sub-score).
- ARV discount +14.3/15.0
- Cash flow +8.0/30.0
- Schools +4.0/10.0
- 1% rule +3.8/10.0
- Livability +3.1/5.0
- Rent growth +2.9/5.0
- Condition / age +2.5/5.0
- DSCR +2.0/10.0
- Appreciation +0.0/10.0
$248,000
🖨 Deal sheet (PDF) 📄 Offer letter ✓ Due diligence
Listing remarks MLS
Stunning open-concept home, blending contemporary design with timeless neutral finishes — creating a space that is as stylish as it is livable. With 4 spacious bedrooms and 2 full bathrooms, there is plenty of room for the whole family. Step inside and immediately feel the difference an open floor plan makes. The kitchen, living, and dining areas flow seamlessly together, filling the home with natural light and creating the perfect environment for everyday family moments and effortless entertaining. The kitchen features gleaming granite countertops, a generous kitchen island ideal for casual meals or hosting guests, and a double basin sink that makes cleanup a breeze. The modern, neutral aesthetic throughout the home provides a fresh and versatile canvas — move right in or add your personal touches with ease. Outside, the backyard offers a blank canvas ready to become your very own outdoor summer oasis. The neighborhood truly sets this home apart. Enjoy resort-style living with access to a sparkling community pool, a nearby park, trails and walking paths, and an abundance of amenities designed for year-round fun and connection. This is more than a house — it's the lifestyle you've been looking for. Whether you envision a weekend barbecue retreat, a garden escape, or a play area for the kids, this home is ready for your vision. Come and make it your own!
Key facts
- Open floor plan
- Community pool
- Double basin sink
Tags
Neighborhood map
What this means for you Summary
Snapshot
- This is a 4-bed/2.0-bath single-family listed at $248k.
Deal economics
- At list price, monthly cash flow is $-257 ($-3k/yr) — negative.
- To cash-flow at today's rent, offer at most $203k (18.3% below list).
- To meet the 1% rule (rent ≥ 1% of price), the offer needs to be $219k (11.7% below list).
- Recommended offer: $203k (18.3% below list) — sets the bar for cash-flow.
Location & tenants
- Location reads 61/100 on livability (#983 in TX) — a middle-class / working-renter tenant base. Strengths: employment A+, housing A+, crime B+; Watch: amenities F, commute F, health & safety F.
- Forney ISD (rural): math 41% / reading 44% proficiency, ranked #234 of 826 in TX (top 28%) — families likely to look elsewhere, expect single-tenant / working-renter base with shorter leases.
- Zoned schools: Lewis El (math 32% / reading 32%, grade F, #2,268 of 4,322 statewide, top 55%, 763 students, 50% FRL); Brown Middle (math 29% / reading 39%, grade F, #892 of 1,662 statewide, top 55%, 673 students, 56% FRL); North Forney H S (math 32% / reading 45%, grade F, #866 of 1,632 statewide, top 54%, 2,502 students, 49% FRL) — zoned schools average 52% FRL vs 26% district-wide (25 pts higher); higher-poverty schools than district average — tighter screening recommended.
- Market conditions: Rents rising (+1.4%/yr); 2200 active listings in the ZIP; 40 comparable units currently listed for rent nearby; rentals at typical pace (median 19d on market — plan ~3-4 weeks tenant-placement turnaround); solid renter incomes; 1,747 units permitted in Kaufman County in 2024 (180 in 5+ unit buildings).
Forward outlook
- Local home prices are declining (-3.0%/yr); year-one equity from $2k of loan paydown is wiped out by about $7k of value loss. Plan a longer hold.
- Kaufman County population projected at +43% by 2050 — long-run rental-demand tailwind backs the buy-and-hold thesis.
Negotiation context
- It's been on market 63 days — a 6% lower offer ($233k) is reasonable based on typical stale-listing flexibility.
Risks & watch-outs
- Watch-outs: property tax is 2.7% of price.
- Climate carrying-cost: major wind risk, 27% chance of damaging wind over 30y; extreme-heat days projected 7→26/yr by 2055 (HVAC capex compounding) — expect insurance premiums to compound above CPI over the hold.
Questions for the listing agent
- What do current leases actually rent for vs. the listed asking? Can we see a recent rent roll and the last 12 months of T-12 income?
- It's been on market 63 days. Have you received any prior offers? Is the seller open to a 18% concession, seller financing, or rate buy-down credit?
- Property tax is high relative to price — has the assessment been appealed recently, and will the sale trigger a re-assessment?
- What does the HOA fee cover, when was the last increase, and are there any pending special assessments or reserve-fund shortfalls?
- Why hasn't it sold? Are there any deal-killer items the seller is aware of (foundation, flood, title, zoning, code violations)?
- Is there a deadline driving the sale (1031 exchange, divorce, estate, relocation)? That informs how much negotiation room exists.
- The area grade is low — what's the realistic commute time and amenity access for the typical tenant pool here? Any planned neighborhood developments (good or bad) we should know about?
- What's the average days-on-market for RENTAL listings here right now (not sales)? A rising rental-DOM trend means longer vacancies and softer asking-rent achievability than the comps imply.
- What's the recent tenant-quality profile in this submarket — average credit score on applications, eviction rate, late-payment / NSF rate, and stable-employment percentage? A property-management company in the area should have these aggregated.
- How much new for-sale + rental construction is in the pipeline within 1–3 miles? Heavy new supply typically softens prices + rents 12–24 months out; constrained supply supports both.
Investment metrics
- 1% rule
- 0.88% ✗
- Cap rate
- 5.05%
- Cash-on-cash
- -4.45%
- DSCR
- 0.80
- GRM
- 9.4
CMA / ARV
- ARV (median comp)
- $292,098
- List price
- $248,000
- Delta
- -15.10%
- Verdict
- UNDERPRICED
- Comps
- 20 within 1.0 mi
Show comp detail 12 sales within ~0.75 mi
| Address | Dist | Beds/Ba | Sqft | Sold | Price | $/sf | Match |
|---|---|---|---|---|---|---|---|
| 2203 Vance Dr | 0.30mi | 4/2.0 | 1,560 (-1%) | 2mo | $254,900 | $163 | 83 |
| 5520 Yarborough Dr | 0.35mi | 3/2.0 (-1) | 1,596 (+1%) | 0mo | $250,000 | $157 | 76 |
| 1050 Rio Bravo Dr | 0.31mi | 3/2.0 (-1) | 1,519 (-4%) | 0mo | $235,000 | $155 | 74 |
| 1513 Stinnett Dr | 0.21mi | 4/2.0 | 1,744 (+11%) | 1mo | $265,000 | $152 | 71 |
| 1627 Croghan Rd | 0.37mi | 4/2.0 | 1,715 (+9%) | 2mo | $269,900 | $157 | 66 |
| 2423 Lemco Dr | 0.43mi | 3/2.0 (-1) | 1,490 (-5%) | 1mo | $240,000 | $161 | 66 |
| 2003 Uvalde Dr | 0.49mi | 3/2.0 (-1) | 1,630 (+4%) | 2mo | $245,000 | $150 | 64 |
| 4407 Stockdale Ln | 0.48mi | 4/2.0 | 1,703 (+8%) | 1mo | $285,000 | $167 | 63 |
| 2124 Hobby Dr | 0.68mi | 3/2.0 (-1) | 1,530 (-3%) | 3mo | $220,000 | $144 | 56 |
| 2804 Lenham Ln | 0.52mi | 3/2.0 (-1) | 1,440 (-9%) | 2mo | $243,000 | $169 | 55 |
| 2001 Eagle Lake Dr | 0.56mi | 3/2.0 (-1) | 1,698 (+8%) | 3mo | $224,900 | $132 | 54 |
| 2031 Jack County Dr | 0.55mi | 3/2.0 (-1) | 1,350 (-14%) | 2mo | $245,000 | $181 | 44 |
Match score weights: distance 35% · size 25% · config 20% · recency 20%. Top-matched comps best support the ARV.
Projected returns pro-forma
-3.0% appreciation · 1.42% rent growth · sell at horizon
- IRR
- -25.8%
- Equity multiple
- 0.14×
- Total profit
- $-59,807
- Equity at exit
- $36,978
- IRR
- -29.2%
- Equity multiple
- -0.24×
- Total profit
- $-85,994
- Equity at exit
- $21,443
Cash invested: $69,440 (down + closing). Projections, not guarantees.
Landlord ↔ Tenant lean methodology
- Overall (STATE)
- 87 Strongly Landlord-Friendly
- State Texas
- 87 Strongly Landlord-Friendly · R+5
- County
- — inherits STATE
- City
- — inherits STATE
ZIP-level market 75126
- Rents YoY
- 1.4%
- Active inventory
- 2200
- Price-to-rent
- 9.4×
Monthly cashflow live
- Estimated rent
- $2,190 high interval (Pro) →
- Mortgage (P&I)
- −$1,301
- Tax from tax record
- −$549 /mo · $6,591/yr
- Insurance
- −$103
- HOA
- −$34
- Vacancy / Maint / Mgmt
- −$460
- Net cashflow
- $-257
Break-even live
Sensitivity live
| Price | -10% $-117 | -5% $-187 | +0% $-257 | +5% $-328 | +10% $-398 |
|---|---|---|---|---|---|
| Rent | -10% $-430 | -5% $-344 | +0% $-257 | +5% $-171 | +10% $-84 |
| Rate | -1.0pp $-133 | -0.5pp $-194 | base $-257 | +0.5pp $-322 | +1.0pp $-387 |
UW: 25.0% down · 7.5% · 30yr · 1.5% tax · 5.0% vac · 8.0% maint · 8.0% mgmt
Financing live
Cash to close
- Down payment
- $62,000
- Closing costs
- $7,440
- Reserves months
- —
- Total cash needed
- —
Loan-product check · same deal, 3 products live
Conventional
25% down · 7.5% · 30yr
- Down + closing
- —
- Monthly P&I
- —
- Monthly cashflow
- —
- DSCR
- —
- Eligible?
- —
Personal DTI + credit; lowest rate.
DSCR
20% down · 8.5% · 30yr
- Down + closing
- —
- Monthly P&I
- —
- Monthly cashflow
- —
- DSCR
- —
- Eligible?
- —
No personal income docs; deal must DSCR.
Hard money
10% down · 12.0% · 12mo
- Down + closing
- —
- Monthly P&I
- —
- Monthly cashflow
- —
- DSCR
- —
- Eligible?
- —
Short-term bridge; refi at stabilization.
Rent comps 40 comps
| Address | Beds | Baths | Sqft | Rent | $/sqft | DOM | Units | Dist |
|---|---|---|---|---|---|---|---|---|
| 2415 Anton Dr Forney, TX | 4.0 | 2.0 | 1891 | $2,200 | $1.16 | 19d | 1 | 0.09mi |
| 5529 McClelland St Forney, TX | 3.0 | 2.0 | 1450 | $1,750 | $1.21 | 8d | 1 | 0.19mi |
| 5529 McClelland St Forney, TX | 3.0 | 2.0 | 1450 | $1,750 | $1.21 | 14d | 1 | 0.19mi |
| 5516 Berea St Forney, TX | 3.0 | 2.0 | 1266 | $1,875 | $1.48 | 45d | 1 | 0.21mi |
| 5537 Berea St Forney, TX | 3.0 | 2.0 | 1239 | $1,780 | $1.44 | 0d | 1 | 0.25mi |
| 2302 Tombstone Rd Forney, TX | 4.0 | 2.0 | 1905 | $2,100 | $1.10 | 45d | 1 | 0.26mi |
| 2401 Lalun Ln Forney, TX | 4.0 | 2.0 | 1854 | $2,089 | $1.13 | 9d | 1 | 0.33mi |
| 5661 McClelland St Forney, TX | 3.0 | 2.0 | 1590 | $1,995 | $1.25 | 6d | 1 | 0.35mi |
| 2402 Buchanan Ln Forney, TX | 4.0 | 2.0 | 1858 | $2,299 | $1.24 | 3d | 1 | 0.36mi |
| 2402 Buchanan Ln Forney, TX | 4.0 | 2.0 | 1858 | $2,399 | $1.29 | 26d | 1 | 0.36mi |
| 5672 McClelland St Forney, TX | 4.0 | 2.5 | 1950 | $1,999 | $1.03 | 9d | 1 | 0.37mi |
| 5681 McClelland St Forney, TX | 4.0 | 2.5 | 1950 | $2,070 | $1.06 | 22d | 1 | 0.39mi |
| 5693 McClelland St Forney, TX | 4.0 | 2.5 | 1685 | $1,839 | $1.09 | 9d | 1 | 0.41mi |
| 2047 Enchanted Rock Dr Forney, TX | 4.0 | 2.0 | 1636 | $2,000 | $1.22 | 5d | 1 | 0.44mi |
| 2157 Clarion Dr Forney, TX | 3.0 | 2.0 | 1608 | $1,975 | $1.23 | 45d | 1 | 0.56mi |
| 2412 Bold Venture Dr Forney, TX | 3.0 | 2.0 | 1448 | $1,895 | $1.31 | 45d | 1 | 0.64mi |
| 4307 Johnstown Ln Forney, TX | 3.0 | 2.0 | 1247 | $1,745 | $1.40 | 26d | 1 | 0.64mi |
| 4101 Wintergreen Dr Forney, TX | 3.0 | 2.0 | 1239 | $1,645 | $1.33 | 8d | 1 | 0.69mi |
| 2117 Silsbee Ct Forney, TX | 3.0 | 2.0 | 1663 | $1,995 | $1.20 | 18d | 1 | 0.75mi |
| 2907 Doggett Dr Forney, TX | 4.0 | 2.5 | 2139 | $2,950 | $1.38 | 0d | 1 | 0.76mi |
| 6001 Determine Ln Forney, TX | 3.0 | 2.0 | 1440 | $1,679 | $1.17 | 23d | 1 | 0.86mi |
| 5906 Nyquist Way Forney, TX | 3.0 | 2.0 | 1500 | $1,999 | $1.33 | 45d | 1 | 0.87mi |
| 5452 Montrose Dr Forney, TX | 3.0 | 2.0 | 1185 | $1,750 | $1.48 | 6d | 1 | 0.88mi |
| 1004 Trickham Dr Forney, TX | 3.0 | 2.0 | 1825 | $2,250 | $1.23 | 0d | 1 | 0.88mi |
| 6011 Determine Ln Forney, TX | 4.0 | 2.0 | 1514 | $1,800 | $1.19 | 5d | 1 | 0.89mi |
| 1804 Arcola Ct Forney, TX | 4.0 | 2.5 | 1619 | $1,895 | $1.17 | 17d | 1 | 0.90mi |
| 1804 Arcola Ct Forney, TX | 4.0 | 3.0 | 1619 | $1,895 | $1.17 | 14d | 1 | 0.90mi |
| 6021 Determine Ln Forney, TX | 4.0 | 2.0 | 1500 | $2,095 | $1.40 | 26d | 1 | 0.92mi |
| 5628 Elwood Dr Forney, TX | 3.0 | 2.0 | 1484 | $1,750 | $1.18 | 0d | 1 | 0.94mi |
| 5811 Grindstone Dr Forney, TX | 3.0 | 2.0 | 1440 | $1,999 | $1.39 | 45d | 1 | 0.96mi |
| 6038 Determine Ln Forney, TX | 3.0 | 2.0 | 1233 | $1,895 | $1.54 | 45d | 1 | 0.97mi |
| 1427 Ganado Dr Forney, TX | 4.0 | 2.0 | 1512 | $2,095 | $1.39 | 23d | 1 | 0.99mi |
| 1427 Ganado Dr Forney, TX | 3.0 | 2.0 | 1520 | $1,995 | $1.31 | 9d | 1 | 0.99mi |
| 1329 Rosenberg Dr Forney, TX | 4.0 | 2.0 | 2000 | $2,100 | $1.05 | 45d | 1 | 1.00mi |
| 6084 Determine Ln Forney, TX | 3.0 | 2.0 | 1239 | $1,700 | $1.37 | 4d | 1 | 1.03mi |
| 6077 Determine Ln Forney, TX | 4.0 | 2.0 | 1500 | $1,995 | $1.33 | 26d | 1 | 1.05mi |
| 6101 Determine Ln Forney, TX | 3.0 | 2.0 | 1440 | $1,850 | $1.28 | 45d | 1 | 1.09mi |
| 1031 Johnson City Ave Forney, TX | 3.0 | 2.0 | 1609 | $1,950 | $1.21 | 6d | 1 | 1.14mi |
| 1037 Johnson City Ave Forney, TX | 3.0 | 2.0 | 1660 | $1,895 | $1.14 | 21d | 1 | 1.15mi |
| 1037 Johnson City Ave Forney, TX | 3.0 | 2.0 | 1660 | $1,895 | $1.14 | 26d | 1 | 1.15mi |
HOA detail
- Monthly dues
- $34 · $408/yr
- Likely covers
- pool
Listing history 3 events
-
2026-05-18status Pending 1394-char remark
Show marketing remark (1394 chars)
Stunning open-concept home, blending contemporary design with timeless neutral finishes — creating a space that is as stylish as it is livable. With 4 spacious bedrooms and 2 full bathrooms, there is plenty of room for the whole family. Step inside and immediately feel the difference an open floor plan makes. The kitchen, living, and dining areas flow seamlessly together, filling the home with natural light and creating the perfect environment for everyday family moments and effortless entertaining. The kitchen features gleaming granite countertops, a generous kitchen island ideal for casual meals or hosting guests, and a double basin sink that makes cleanup a breeze. The modern, neutral aesthetic throughout the home provides a fresh and versatile canvas — move right in or add your personal touches with ease. Outside, the backyard offers a blank canvas ready to become your very own outdoor summer oasis. The neighborhood truly sets this home apart. Enjoy resort-style living with access to a sparkling community pool, a nearby park, trails and walking paths, and an abundance of amenities designed for year-round fun and connection. This is more than a house — it's the lifestyle you've been looking for. Whether you envision a weekend barbecue retreat, a garden escape, or a play area for the kids, this home is ready for your vision. Come and make it your own!
-
2026-05-08historical Active Option Contract 1394-char remark
Show marketing remark (1394 chars)
Stunning open-concept home, blending contemporary design with timeless neutral finishes — creating a space that is as stylish as it is livable. With 4 spacious bedrooms and 2 full bathrooms, there is plenty of room for the whole family. Step inside and immediately feel the difference an open floor plan makes. The kitchen, living, and dining areas flow seamlessly together, filling the home with natural light and creating the perfect environment for everyday family moments and effortless entertaining. The kitchen features gleaming granite countertops, a generous kitchen island ideal for casual meals or hosting guests, and a double basin sink that makes cleanup a breeze. The modern, neutral aesthetic throughout the home provides a fresh and versatile canvas — move right in or add your personal touches with ease. Outside, the backyard offers a blank canvas ready to become your very own outdoor summer oasis. The neighborhood truly sets this home apart. Enjoy resort-style living with access to a sparkling community pool, a nearby park, trails and walking paths, and an abundance of amenities designed for year-round fun and connection. This is more than a house — it's the lifestyle you've been looking for. Whether you envision a weekend barbecue retreat, a garden escape, or a play area for the kids, this home is ready for your vision. Come and make it your own!
-
2026-03-15$248,000 Active 1394-char remark
Show marketing remark (1394 chars)
Stunning open-concept home, blending contemporary design with timeless neutral finishes — creating a space that is as stylish as it is livable. With 4 spacious bedrooms and 2 full bathrooms, there is plenty of room for the whole family. Step inside and immediately feel the difference an open floor plan makes. The kitchen, living, and dining areas flow seamlessly together, filling the home with natural light and creating the perfect environment for everyday family moments and effortless entertaining. The kitchen features gleaming granite countertops, a generous kitchen island ideal for casual meals or hosting guests, and a double basin sink that makes cleanup a breeze. The modern, neutral aesthetic throughout the home provides a fresh and versatile canvas — move right in or add your personal touches with ease. Outside, the backyard offers a blank canvas ready to become your very own outdoor summer oasis. The neighborhood truly sets this home apart. Enjoy resort-style living with access to a sparkling community pool, a nearby park, trails and walking paths, and an abundance of amenities designed for year-round fun and connection. This is more than a house — it's the lifestyle you've been looking for. Whether you envision a weekend barbecue retreat, a garden escape, or a play area for the kids, this home is ready for your vision. Come and make it your own!
ⓘ Source: listings_history table (triggers on properties + properties_extension) + one-shot
backfill from property_details.listing_events for pre-trigger history.
Tax reassessment forecast TX · Resets to sale price
- Current annual tax
- $6,591 · $549/mo
- Projected year-2 tax
- $6,591 · $549/mo
- Expected delta
- $0/yr ($0/mo · 0.0%)
ⓘ Screening estimate from a state-policy table — verify with the county assessor before closing.
Climate risk First Street
- Flood 1/10 Low FEMA zone X (unshaded) · 0% chance over 30 yrs
- Wildfire 3/10 Moderate
- Heat 8/10 Severe 7 d/yr ≥110°F today · 26 d/yr by 30 yrs out
- Wind 6/10 Major 27% chance of damaging wind over 30 yrs
- Air quality 2/10 Low 1 unhealthy d/yr today · 1 by 30 yrs out
Nearby sold comps map
Loading sold comps map…
Walkable amenities ~0.75 mi
Loading nearby amenities…
Taxation est. · year 1
- Rental income
- $26,274
- − Mortgage interest
- −$13,892
- − Property taxes
- −$6,591
- − Insurance
- −$1,240
- − Repairs & maintenance
- −$2,102
- − Management
- −$2,102
- − HOA
- −$408
- − Depreciation
- −$7,215
- Taxable loss
- −$7,275
- Est. tax savings @ 24.0%
- +$1,746
- After-tax cash flow
- $-1,343/yr
For passive investors: Depreciation is non-cash, so a rental often shows a tax loss while cash-flowing — sheltering income. Rental losses are passive: they offset passive income freely, and up to $25,000/yr can offset ordinary (W-2) income if you actively participate and your MAGI is under $100k (phasing out to $0 by $150k); unused losses carry forward. On sale, claimed depreciation is recaptured at up to 25%, and gains may owe capital-gains tax (a 1031 exchange can defer both). Figures are a year-1 estimate at your 24.0% rate — not tax advice; consult a CPA.
Schools (NCES district)
- District
- Forney ISD
- NCES district ID
- 4819560
- Math proficiency
- 41% ▼ -20.00%
- Reading proficiency
- 44% ▼ -12.00%
- Median HH income
- $86,679
- Composite
- 40.07/100
- National rank
- #3812
- State rank
- #234 of 826 in TX
Livability — Travis Ranch
- Score
- 61/100
- State rank
- #983
- US rank
- #17440
Category grades
Schools grade is shown separately in the Schools card above.
Census & demographics
- Census place
- Travis Ranch, TX
- County
- Kaufman County · 122,338 people
- Metro
- Dallas-Fort Worth-Arlington, TX
- Population (ZIP)
- 84,799
- Household income
- $103,673
- Rent vs Own
- Severe rent burden
- 1306.0
Population outlook (Kaufman County) Hauer SSP2
- Today (2025)
- 138,716 people
- By 2030
- 150,815 · +8.7%
- By 2040
- 174,877 · +26.1%
- By 2050
- 198,020 · +42.8%
- By 2075
- 251,908 · +81.6%
- By 2100
- 285,325 · +105.7%
Race, ethnicity, and origin ACS 2023
- Neighborhood character
- Diverse neighborhood (Simpson 0.68)
- Race & ethnicity
- White 45% Black 25% Hispanic / Latino 23% Two or more races 14% Asian 3%
- Hispanic origin (detail)
- Mexican 18% Puerto Rican 1%
- Common ancestry
- Italian 2% Slovak 1% Portuguese 1%
- Foreign-born
- 12% · Canada, Vietnam
- Languages at home
- 79% English-only · Spanish 14% Arabic 1% Vietnamese 1%
Political lean MEDSL · Kaufman
- 2024 margin
- Strong R (+27.9) · D 35.6% · R 63.5%
- 2008→2024 swing
- +7.9pp toward D · 2008: -35.8pp · 2024: -27.9pp
- All cycles
- 2024: R+27.9 2020: R+33.9 2016: R+47.0 2012: R+44.4 2008: R+35.8
Not yet ingested
- Civics
- —
Market trends
- HPI YoY
- ▼ -102.93%
- Current HPI
- 148.5749
- Rent YoY
- ▲ 1.42%
- Metro
- Dallas-Fort Worth-Arlington, TX
- State GDP YoY
- ▲ 3.95%
- F500 in state
- 110
Industry mix (Fortune 500 HQ in TX)
| Industry | F500 HQs | Revenue |
|---|---|---|
| Energy | 16 | $1,198B |
|
||
| Technology | 5 | $198B |
|
||
| Engineering / Construction | 4 | $72B |
|
||
| Energy Services | 3 | $60B |
|
||
| Utilities | 3 | $41B |
|
||
| Healthcare | 2 | $330B |
|
||
Price history
3 events — show timeline
- 2026-05-18 Pending — NTREIS
- 2026-05-08 Contingent — NTREIS
- 2026-03-15 Listed $248,000 NTREIS
Property tax history
+28.4%/yrLatest (2025): $6,591 · -6.3% YoY. Source: county tax records.
Cash-flow waterfall
monthlySold comps — $/sqft
last 12 mo · ≤1 miLoading sold comps…