2135 40th St SE · Paris, TX
Flood risk 1/10 · Minimal
- FEMA flood zone
- X (unshaded)
- Chance of flooding over 30 yrs
- 0.0%
- Est. flood insurance / yr
- $507 – $1,088
Fire risk 7/10 · Major
- Est. fire insurance / yr
- $1,222 – $2,270
Heat risk 7/10 · Major
- Hot days now (above 111°F)
- 7 days/yr
- Hot days in 30 yrs
- 22 days/yr
Wind risk 4/10 · Minor
- Chance of severe wind over 30 yrs
- 20.0%
Air-quality risk 2/10 · Minimal
- Unhealthy air days now
- 0 days/yr
- Unhealthy air days in 30 yrs
- 1 days/yr
Risk factors via First Street. Map © Google.
Why this score? — see what drove the D grade
The composite is a weighted blend of 9 inputs, each scored 0–100. Each bar is that input's sub-score; the figure is the points it added to the 100-point composite (weight × sub-score).
- Cash flow +13.8/30.0
- ARV discount +12.2/15.0
- DSCR +4.2/10.0
- 1% rule +3.5/10.0
- Livability +3.1/5.0
- Schools +3.0/10.0
- Rent growth +2.5/5.0
- Condition / age +2.5/5.0
- Appreciation +0.0/10.0
$155,000
🖨 Deal sheet (PDF) 📄 Offer letter ✓ Due diligence
Listing remarks
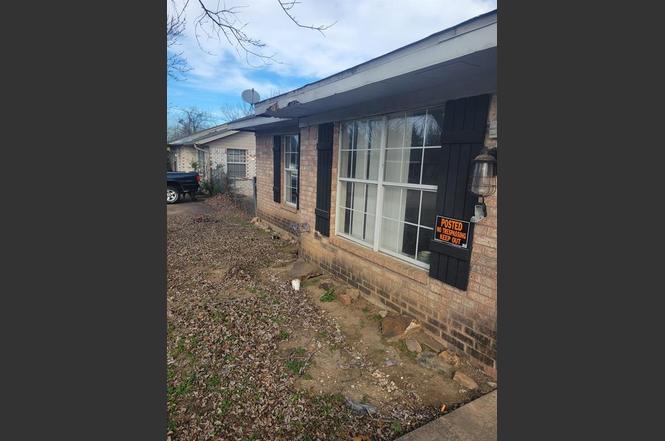
Opportunity knocks at 2135 40th St SE in Paris, TX! This fixer-upper is ideal for a handyman, investor, or anyone looking to add value through renovation. The property offers a solid starting point with plenty of potential to customize, update, or reimagine to suit your vision. Whether you’re seeking a flip, rental investment, or a project home, this property provides a blank canvas in an established area. Bring your tools, creativity, and plans—this is a chance to transform potential into profit. Complimentary 3-2-1 Buydown Available. 1 Year - 3.625 % (Payment: $ 721) 2 Year - 4.625 % (Payment: $ 793) 3 Year - 5.625 % (Payment: $ 869) 4-30 YR - 6.625 % (Payment: $ 949)
Key facts
- 5,009 sq ft lot
- Built 1996
- Listed 148 days
Property features AI
Finance
- HOA & community: No association
Exterior
- Parking: Driveway (no garage, no covered/carport spaces)
- Utilities: City water; City sewer; No municipal utility district
- Home design: Single family residence; Residential property; Built in 1996; Subdivision: Cedar Park #2
- Construction: Brick construction; Composition roof; Slab foundation
- Exterior features: Covered patio/porch
Interior
- Kitchen: Dishwasher
- Bedrooms: 3 bedrooms
- Bathrooms: 2 full bathrooms
- Interior features: Open floorplan; One level
- Laundry & utility: 1 living area; 1 dining area
Neighborhood map
What this means for you Summary
Snapshot
- This is a 3-bed/1.0-bath single-family listed at $155k.
Deal economics
- At list price, monthly cash flow is $13 ($158/yr) — positive.
- The deal already cash-flows at list — no discount required.
- To meet the 1% rule (rent ≥ 1% of price), the offer needs to be $132k (14.6% below list).
- Recommended offer: $132k (14.6% below list) — sets the bar for 1% rule.
- Cap rate 6.4% vs local median 3.7% in Paris — top-decile yield for the area; either an underpriced asset or a hidden risk that comps aren't pricing in. Stress-test before assuming the spread holds.
Location & tenants
- Location reads 61/100 on livability (#984 in TX) — a middle-class / working-renter tenant base. Strengths: cost of living A+, housing A+; Watch: crime F, amenities F, commute F.
- Paris ISD (town): math 36% / reading 37% proficiency, ranked #521 of 826 in TX (top 63%) — families likely to look elsewhere, expect single-tenant / working-renter base with shorter leases; 70% free/reduced lunch — lower-income household profile, screen leases tightly.
- Zoned schools: Aikin El (math 32% / reading 35%, grade F, #2,174 of 4,322 statewide, top 51%, 937 students, 74% FRL); Crockett Int (math 33% / reading 33%, grade F, #930 of 1,662 statewide, top 57%, 560 students, 79% FRL); Paris H S (math 60% / reading 51%, grade C, #364 of 1,632 statewide, top 23%, 934 students, 71% FRL) — zoned schools at 75% FRL track the district average.
- Market conditions: 275 active listings in the ZIP; 1 comparable units currently listed for rent nearby; 119 units permitted in Lamar County in 2024 (71 in 5+ unit buildings).
- This rent runs 34% of the median local income ($46k/yr) — at the standard rent-burdened threshold; future hikes will face affordability resistance.
Forward outlook
- Local home prices are declining (-3.0%/yr); year-one equity from $1k of loan paydown is wiped out by about $5k of value loss. Plan a longer hold.
- Lamar County population projected at -13% by 2050 — secular population decline; favor cash flow + early exit over multi-decade hold.
Negotiation context
- It's been on market 149 days — a 12% lower offer ($136k) is reasonable based on typical stale-listing flexibility.
Risks & watch-outs
- Climate carrying-cost: major wildfire risk; extreme-heat days projected 7→22/yr by 2055 (HVAC capex compounding) — expect insurance premiums to compound above CPI over the hold.
Questions for the listing agent
- It's been on market 149 days. Have you received any prior offers? Is the seller open to a 15% concession, seller financing, or rate buy-down credit?
- Why hasn't it sold? Are there any deal-killer items the seller is aware of (foundation, flood, title, zoning, code violations)?
- Is there a deadline driving the sale (1031 exchange, divorce, estate, relocation)? That informs how much negotiation room exists.
- Schools are D-rated, which usually means shorter tenancies and higher turnover. Who's the typical renter profile here, and what's been the actual vacancy rate?
- Crime grade is F in this area — have there been break-ins, vandalism, or insurance claims at this property in the last 3 years? What carrier currently insures it and at what premium?
- The area grade is low — what's the realistic commute time and amenity access for the typical tenant pool here? Any planned neighborhood developments (good or bad) we should know about?
- What's the average days-on-market for RENTAL listings here right now (not sales)? A rising rental-DOM trend means longer vacancies and softer asking-rent achievability than the comps imply.
- What's the recent tenant-quality profile in this submarket — average credit score on applications, eviction rate, late-payment / NSF rate, and stable-employment percentage? A property-management company in the area should have these aggregated.
- How much new for-sale + rental construction is in the pipeline within 1–3 miles? Heavy new supply typically softens prices + rents 12–24 months out; constrained supply supports both.
Investment metrics
- 1% rule
- 0.85% ✗
- Cap rate
- 6.39%
- Cash-on-cash
- 0.36%
- DSCR
- 1.02
- GRM
- 9.8
CMA / ARV
- ARV (on-the-fly)
- $173,168
- Comps found
- 4
Show comp detail 4 sales within ~0.75 mi
| Address | Dist | Beds/Ba | Sqft | Sold | Price | $/sf | Match |
|---|---|---|---|---|---|---|---|
| 2245 40th St SE | 0.07mi | 3/2.0 | 1,238 (-2%) | 15mo | $150,000 | $121 | 77 |
| 2255 40th St SE | 0.08mi | 3/2.0 | 1,280 (+1%) | 17mo | $115,000 | $90 | 76 |
| 2335 SE 40th | 0.11mi | 3/2.0 | 1,280 (+1%) | 16mo | $175,000 | $137 | 75 |
| 3313 Spaulding Dr | 0.62mi | 4/2.0 (+1) | 1,317 (+4%) | 1mo | $260,990 | $198 | 54 |
Match score weights: distance 35% · size 25% · config 20% · recency 20%. Top-matched comps best support the ARV.
Projected returns pro-forma
-3.0% appreciation · 3.0% rent growth · sell at horizon
- IRR
- -15.7%
- Equity multiple
- 0.44×
- Total profit
- $-24,283
- Equity at exit
- $23,111
- IRR
- -7.3%
- Equity multiple
- 0.54×
- Total profit
- $-20,082
- Equity at exit
- $13,402
Cash invested: $43,400 (down + closing). Projections, not guarantees.
Landlord ↔ Tenant lean methodology
- Overall (STATE)
- 87 Strongly Landlord-Friendly
- State Texas
- 87 Strongly Landlord-Friendly · R+5
- County
- — inherits STATE
- City
- — inherits STATE
ZIP-level market 75460
- Active inventory
- 275
- Price-to-rent
- 9.8×
Monthly cashflow live
- Estimated rent
- $1,323 medium interval (Pro) →
- Mortgage (P&I)
- −$813
- Tax from tax record
- −$155 /mo · $1,859/yr
- Insurance
- −$65
- HOA
- −$0
- Vacancy / Maint / Mgmt
- −$278
- Net cashflow
- $13
Break-even live
Sensitivity live
| Price | -10% $101 | -5% $57 | +0% $13 | +5% $-31 | +10% $-75 |
|---|---|---|---|---|---|
| Rent | -10% $-91 | -5% $-39 | +0% $13 | +5% $65 | +10% $118 |
| Rate | -1.0pp $91 | -0.5pp $53 | base $13 | +0.5pp $-27 | +1.0pp $-68 |
UW: 25.0% down · 7.5% · 30yr · 1.5% tax · 5.0% vac · 8.0% maint · 8.0% mgmt
Financing live
Cash to close
- Down payment
- $38,750
- Closing costs
- $4,650
- Reserves months
- —
- Total cash needed
- —
Loan-product check · same deal, 3 products live
Conventional
25% down · 7.5% · 30yr
- Down + closing
- —
- Monthly P&I
- —
- Monthly cashflow
- —
- DSCR
- —
- Eligible?
- —
Personal DTI + credit; lowest rate.
DSCR
20% down · 8.5% · 30yr
- Down + closing
- —
- Monthly P&I
- —
- Monthly cashflow
- —
- DSCR
- —
- Eligible?
- —
No personal income docs; deal must DSCR.
Hard money
10% down · 12.0% · 12mo
- Down + closing
- —
- Monthly P&I
- —
- Monthly cashflow
- —
- DSCR
- —
- Eligible?
- —
Short-term bridge; refi at stabilization.
Rent comps 1 comps
| Address | Beds | Baths | Sqft | Rent | $/sqft | DOM | Units | Dist |
|---|---|---|---|---|---|---|---|---|
| 3215 Clarksville St Paris, TX | 1.0–2.0 | 1.0 | 895 | $1,395 | $1.56 | 45d | 1 | 1.02mi |
Listing history 18 events
-
2026-06-21days on market $155,000 Active 149 DOM
-
2026-06-19days on market $155,000 Active 147 DOM
-
2026-06-18days on market $155,000 Active 146 DOM
-
2026-06-17days on market $155,000 Active 145 DOM
-
2026-06-16days on market $155,000 Active 144 DOM
-
2026-06-15days on market $155,000 Active 143 DOM
-
2026-06-14days on market $155,000 Active 141 DOM
-
2026-06-12days on market $155,000 Active 140 DOM
-
2026-06-09days on market $155,000 Active 137 DOM
-
2026-06-08days on market $155,000 Active 136 DOM
-
2026-06-07days on market $155,000 Active 135 DOM
-
2026-06-03days on market $155,000 Active 131 DOM
-
2026-06-03remarks 681-char remark
-
2026-06-02days on market $155,000 Active 130 DOM
-
2026-06-01days on market $155,000 Active 129 DOM
-
2026-05-31days on market $155,000 Active 128 DOM
-
2026-05-31days on market $155,000 Active 127 DOM
-
2026-01-23$155,000 Active
ⓘ Source: listings_history table (triggers on properties + properties_extension) + one-shot
backfill from property_details.listing_events for pre-trigger history.
Tax reassessment forecast TX · Resets to sale price
- Current annual tax
- $1,859 · $155/mo
- Projected year-2 tax
- $2,836 · $236/mo
- Expected delta
- +$978/yr (+$81/mo · 52.6%)
ⓘ Screening estimate from a state-policy table — verify with the county assessor before closing.
Climate risk First Street
- Flood 1/10 Low FEMA zone X (unshaded) · 0% chance over 30 yrs
- Wildfire 7/10 Severe
- Heat 7/10 Severe 7 d/yr ≥111°F today · 22 d/yr by 30 yrs out
- Wind 4/10 Moderate 20% chance of damaging wind over 30 yrs
- Air quality 2/10 Low 0 unhealthy d/yr today · 1 by 30 yrs out
Nearby sold comps map
Loading sold comps map…
Walkable amenities ~0.75 mi
Loading nearby amenities…
Taxation est. · year 1
- Rental income
- $15,881
- − Mortgage interest
- −$8,682
- − Property taxes
- −$1,859
- − Insurance
- −$775
- − Repairs & maintenance
- −$1,270
- − Management
- −$1,270
- − Depreciation
- −$4,509
- Taxable loss
- −$2,486
- Est. tax savings @ 24.0%
- +$597
- After-tax cash flow
- $754/yr
For passive investors: Depreciation is non-cash, so a rental often shows a tax loss while cash-flowing — sheltering income. Rental losses are passive: they offset passive income freely, and up to $25,000/yr can offset ordinary (W-2) income if you actively participate and your MAGI is under $100k (phasing out to $0 by $150k); unused losses carry forward. On sale, claimed depreciation is recaptured at up to 25%, and gains may owe capital-gains tax (a 1031 exchange can defer both). Figures are a year-1 estimate at your 24.0% rate — not tax advice; consult a CPA.
Schools (NCES district)
- District
- Paris ISD
- NCES district ID
- 4834290
- Math proficiency
- 36% ▼ -11.00%
- Reading proficiency
- 37% ▼ -1.00%
- Median HH income
- $31,515
- Composite
- 29.83/100
- National rank
- #6419
- State rank
- #521 of 826 in TX
Livability — Paris
- Score
- 61/100
- State rank
- #984
- US rank
- #17535
Category grades
Schools grade is shown separately in the Schools card above.
Census & demographics
- Census place
- Paris, TX
- County
- Lamar County · 23,426 people
- City population
- 23,426
- Metro
- Paris, TX
- Population (ZIP)
- 23,426
- Household income
- $46,473
- Rent vs Own
- Severe rent burden
- 1355.0
Population outlook (Lamar County) Hauer SSP2
- Today (2025)
- 48,319 people
- By 2030
- 47,160 · -2.4%
- By 2040
- 44,621 · -7.7%
- By 2050
- 42,024 · -13.0%
- By 2075
- 36,577 · -24.3%
- By 2100
- 30,580 · -36.7%
Race, ethnicity, and origin ACS 2023
- Neighborhood character
- Diverse neighborhood (Simpson 0.60)
- Race & ethnicity
- White 58% Black 22% Hispanic / Latino 13% Two or more races 8%
- Hispanic origin (detail)
- Mexican 12%
- Common ancestry
- Lithuanian 1% Slovak 1% Italian 1%
- Foreign-born
- 3% · Canada, China
- Languages at home
- 92% English-only · Spanish 7%
Political lean MEDSL · Lamar
- 2024 margin
- Solid R (+61.0) · D 19.2% · R 80.3%
- 2008→2024 swing
- -19.1pp toward R · 2008: -42.0pp · 2024: -61.0pp
- All cycles
- 2024: R+61.0 2020: R+57.4 2016: R+59.2 2012: R+50.3 2008: R+42.0
Not yet ingested
- Civics
- —
Market trends
- HPI YoY
- ▼ -201.50%
- Current HPI
- 145.3511
- Rent YoY
- —
- Metro
- Paris, TX
- State GDP YoY
- ▲ 3.95%
- F500 in state
- 110
Industry mix (Fortune 500 HQ in TX)
| Industry | F500 HQs | Revenue |
|---|---|---|
| Energy | 16 | $1,198B |
|
||
| Technology | 5 | $198B |
|
||
| Engineering / Construction | 4 | $72B |
|
||
| Energy Services | 3 | $60B |
|
||
| Utilities | 3 | $41B |
|
||
| Healthcare | 2 | $330B |
|
||
Price history
1 event — show timeline
- 2026-01-23 Listed $155,000 NTREIS
Property tax history
+3.3%/yrLatest (2025): $1,859 · +11.4% YoY. Source: county tax records.
Cash-flow waterfall
monthlySold comps — $/sqft
last 12 mo · ≤1 miLoading sold comps…