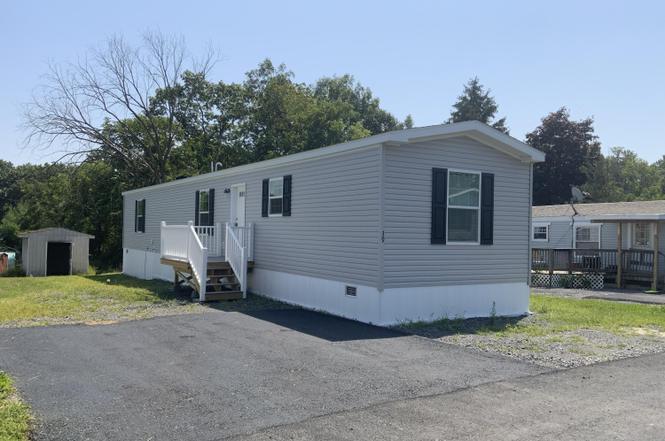
1154 Us-9 #39 · Stottville, NY
Flood risk 1/10 · Minimal
- FEMA flood zone
- X
- Chance of flooding over 30 yrs
- 0.0%
- Est. flood insurance / yr
- $507 – $1,088
Fire risk 2/10 · Minimal
- Est. fire insurance / yr
- $691 – $1,283
Heat risk 4/10 · Minor
- Hot days now (above 98°F)
- 7 days/yr
- Hot days in 30 yrs
- 16 days/yr
Wind risk 3/10 · Minor
- Chance of severe wind over 30 yrs
- 9.0%
Air-quality risk 2/10 · Minimal
- Unhealthy air days now
- 0 days/yr
- Unhealthy air days in 30 yrs
- 1 days/yr
Risk factors via First Street. Map © Google.
Why this score? — see what drove the A grade
The composite is a weighted blend of 9 inputs, each scored 0–100. Each bar is that input's sub-score; the figure is the points it added to the 100-point composite (weight × sub-score).
- Cash flow +30.0/30.0
- ARV discount +11.0/15.0
- 1% rule +10.0/10.0
- DSCR +10.0/10.0
- Appreciation +10.0/10.0
- Rent growth +5.0/5.0
- Schools +4.8/10.0
- Livability +2.9/5.0
- Condition / age +2.5/5.0
$115,000
🖨 Deal sheet 📄 Offer letter ✓ Due diligence
Listing remarks
Brand-New Homes in a Peaceful Columbia County Community Discover the joy of new construction in these spacious 3-bedroom, 2-bathroom homes offering nearly 1,000 sq ft of light-filled living space. Located within the ICC School District and set in a beautifully maintained, newly paved park, this is an inviting and affordable way to stay rooted in Columbia County. Inside, every detail is fresh and untouched—brand new electric appliances, propane heat, and washer/dryer hookups ensure comfort and efficiency. The primary suite offers a private bathroom and a generous walk-in closet, while thoughtful layouts create an easy flow for daily living. With lot rent of just 550/month, including
Key facts
- New construction
- Electric appliances
- Washer dryer hookups
Tags
Property features AI
Exterior
- Parking: Paved parking
- Utilities: Public water; Shared septic; 100 amp electric service; Propane available; Sewer connected; Cable available; Electricity connected; Water connected
- Home design: Manufactured house (single wide); One story; Slab foundation
- Construction: Asphalt shingle roof
- Exterior features: Front porch; Rear porch; Paved driveway/road access
Interior
- Kitchen: Electric range; Refrigerator
- Bathrooms: 2 full bathrooms
- Heating & cooling: Forced air heating; Propane heating
- Interior features: Electric range; Refrigerator
- Laundry & utility: Laundry room with washer and electric dryer hookups
Neighborhood map
What this means for you Summary
Snapshot
- This is a 3-bed/2.0-bath manufactured listed at $115k.
Deal economics
- At list price, monthly cash flow is $1k ($16k/yr) — positive.
- The deal already cash-flows at list — no discount required.
- Meets the 1% rule at list price ($3k rent vs $115k).
- Recommended offer: $105k (9.0% below list) — sets the bar for market timing.
Location & tenants
- Location reads 58/100 on livability (#1,070 in NY) — a working-class tenant base; expect higher turnover. Strengths: crime A, housing A-; Watch: employment D+, schools F, amenities F.
- Kinderhook Central School District (rural): math 49% / reading 59% proficiency, ranked #294 of 590 in NY (top 50%) — acceptable for families but not a draw, mixed tenant base, ~2y average lease.
- Market conditions: Rents rising fast (+10.9%/yr); 161 active listings in the ZIP; 1 comparable units currently listed for rent nearby; 136 units permitted in Columbia County in 2024 (0 in 5+ unit buildings).
- This rent runs 44% of the median local income ($73k/yr) — at the standard rent-burdened threshold; future hikes will face affordability resistance.
Forward outlook
- In year one you build about $12k of equity ($795 loan paydown + $12k appreciation (10.0% local appreciation)).
- Columbia County population projected at -22% by 2050 — secular population decline; favor cash flow + early exit over multi-decade hold.
- At projected returns (10.0% appreciation + 8.0% rent growth), your $32k cash investment doubles in ~2 years — after that, you're playing with house money.
- By year 3, paydown + projected appreciation supports a ~$31k cash-out refi (75% LTV) — recoverable capital for the next deal without selling this one.
Negotiation context
- It's been on market 105 days — a 9% lower offer ($105k) is reasonable based on typical stale-listing flexibility.
- 4 sale attempts; this cycle's ask is 6870% above the opening price — seller raised mid-cycle; expect resistance to lowballs.
Questions for the listing agent
- It's been on market 105 days. Have you received any prior offers? Is the seller open to a 9% concession, seller financing, or rate buy-down credit?
- Why hasn't it sold? Are there any deal-killer items the seller is aware of (foundation, flood, title, zoning, code violations)?
- Is there a deadline driving the sale (1031 exchange, divorce, estate, relocation)? That informs how much negotiation room exists.
- Schools are F-rated, which usually means shorter tenancies and higher turnover. Who's the typical renter profile here, and what's been the actual vacancy rate?
- What's the average days-on-market for RENTAL listings here right now (not sales)? A rising rental-DOM trend means longer vacancies and softer asking-rent achievability than the comps imply.
- What's the recent tenant-quality profile in this submarket — average credit score on applications, eviction rate, late-payment / NSF rate, and stable-employment percentage? A property-management company in the area should have these aggregated.
- How much new for-sale + rental construction is in the pipeline within 1–3 miles? Heavy new supply typically softens prices + rents 12–24 months out; constrained supply supports both.
Investment metrics
- 1% rule
- 2.31% ✓
- Cap rate
- 19.92%
- Cash-on-cash
- 48.65%
- DSCR
- 3.16
- GRM
- 3.6
CMA / ARV
- ARV (on-the-fly)
- $124,754
- Comps found
- 2
Show comp detail 2 sales within ~0.75 mi
| Address | Dist | Beds/Ba | Sqft | Sold | Price | $/sf | Match |
|---|---|---|---|---|---|---|---|
| 1154 Us-9 #31 | 0.07mi | 3/2.0 | 938 (0%) | 3mo | $125,000 | $133 | 94 |
| 1154 Us-9 #23 | 0.07mi | 3/2.0 | 938 (0%) | 3mo | $125,000 | $133 | 94 |
Match score weights: distance 35% · size 25% · config 20% · recency 20%. Top-matched comps best support the ARV.
Projected returns pro-forma
10.0% appreciation · 8.0% rent growth · sell at horizon
- IRR
- 66.2%
- Equity multiple
- 5.96×
- Total profit
- $159,867
- Equity at exit
- $103,601
- IRR
- 61.9%
- Equity multiple
- 14.67×
- Total profit
- $440,282
- Equity at exit
- $223,420
Cash invested: $32,200 (down + closing). Projections, not guarantees.
Landlord ↔ Tenant lean methodology
- Overall (STATE)
- 15 Strongly Tenant-Friendly
- State New York
- 15 Strongly Tenant-Friendly · D+10
- County
- — inherits STATE
- City
- — inherits STATE
ZIP-level market 12534
- Home prices YoY
- 5.6%
- Rents YoY
- 10.9%
- Active inventory
- 161
- Price-to-rent
- 3.6×
Monthly cashflow live
- Estimated rent
- $2,658 medium interval (Pro) →
- Mortgage (P&I)
- −$603
- Tax est. 1.5%
- −$144 /mo · $1,725/yr
- Insurance
- −$48
- HOA
- −$0
- Vacancy / Maint / Mgmt
- −$558
- Net cashflow
- $1,305
Break-even live
UW: 25.0% down · 7.5% · 30yr · 1.5% tax · 5.0% vac · 8.0% maint · 8.0% mgmt
Financing live
Cash to close
- Down payment
- $28,750
- Closing costs
- $3,450
- Reserves months
- —
- Total cash needed
- —
Loan-product check · same deal, 3 products live
Conventional
25% down · 7.5% · 30yr
- Down + closing
- —
- Monthly P&I
- —
- Monthly cashflow
- —
- DSCR
- —
- Eligible?
- —
Personal DTI + credit; lowest rate.
DSCR
20% down · 8.5% · 30yr
- Down + closing
- —
- Monthly P&I
- —
- Monthly cashflow
- —
- DSCR
- —
- Eligible?
- —
No personal income docs; deal must DSCR.
Hard money
10% down · 12.0% · 12mo
- Down + closing
- —
- Monthly P&I
- —
- Monthly cashflow
- —
- DSCR
- —
- Eligible?
- —
Short-term bridge; refi at stabilization.
Rent comps 1 comps
| Address | Beds | Baths | Sqft | Rent | $/sqft | DOM | Units | Dist |
|---|---|---|---|---|---|---|---|---|
| 1154 U.S. 9 #27 Hudson, NY | 3.0 | 2.0 | 978 | $2,300 | $2.35 | 23d | 1 | 0.06mi |
Listing history 23 events
-
2026-06-19days on market $115,000 Active 105 DOM
-
2026-06-18days on market $115,000 Active 104 DOM
-
2026-06-17days on market $115,000 Active 103 DOM
-
2026-06-16days on market $115,000 Active 102 DOM
-
2026-06-15days on market $115,000 Active 101 DOM
-
2026-06-14days on market $115,000 Active 99 DOM
-
2026-06-12days on market $115,000 Active 98 DOM
-
2026-06-09days on market $115,000 Active 95 DOM
-
2026-06-08days on market $115,000 Active 94 DOM
-
2026-06-07days on market $115,000 Active 93 DOM
-
2026-06-07days on market $115,000 Active 92 DOM
-
2026-06-04days on market $115,000 Active 89 DOM
-
2026-06-02days on market $115,000 Active 88 DOM
-
2026-06-01days on market $115,000 Active 87 DOM
-
2026-05-31days on market $115,000 Active 86 DOM
-
2026-05-31days on market $115,000 Active 85 DOM
-
2026-05-18status Active
-
2026-05-18historical
-
2026-05-11status Active
-
2026-05-11price $115,000
-
2026-01-11historical $1,650
-
2026-01-07$1,650
-
2025-08-15$150,000 Active
ⓘ Source: listings_history table (triggers on properties + properties_extension) + one-shot
backfill from property_details.listing_events for pre-trigger history.
Climate risk First Street
- Flood 1/10 Low FEMA zone X · 0% chance over 30 yrs
- Wildfire 2/10 Low
- Heat 4/10 Moderate 7 d/yr ≥98°F today · 16 d/yr by 30 yrs out
- Wind 3/10 Moderate 9% chance of damaging wind over 30 yrs
- Air quality 2/10 Low 0 unhealthy d/yr today · 1 by 30 yrs out
Nearby sold comps map
Loading sold comps map…
Walkable amenities ~0.75 mi
Loading nearby amenities…
Taxation est. · year 1
- Rental income
- $31,902
- − Mortgage interest
- −$6,442
- − Property taxes
- −$1,725
- − Insurance
- −$575
- − Repairs & maintenance
- −$2,552
- − Management
- −$2,552
- − Depreciation
- −$3,345
- Taxable income
- $14,710
- Est. tax owed @ 24.0%
- −$3,530
- After-tax cash flow
- $12,135/yr
For passive investors: Depreciation is non-cash, so a rental often shows a tax loss while cash-flowing — sheltering income. Rental losses are passive: they offset passive income freely, and up to $25,000/yr can offset ordinary (W-2) income if you actively participate and your MAGI is under $100k (phasing out to $0 by $150k); unused losses carry forward. On sale, claimed depreciation is recaptured at up to 25%, and gains may owe capital-gains tax (a 1031 exchange can defer both). Figures are a year-1 estimate at your 24.0% rate — not tax advice; consult a CPA.
Schools (NCES district)
- District
- Kinderhook Central School District
- NCES district ID
- 3615210
- Math proficiency
- 49% ▼ -10.00%
- Reading proficiency
- 59% ▲ 1.00%
- Median HH income
- $68,409
- Composite
- 47.82/100
- National rank
- #2223
- State rank
- #294 of 590 in NY
Livability — Stottville
- Score
- 58/100
- State rank
- #1070
- US rank
- #21454
Category grades
Schools grade is shown separately in the Schools card above.
Census & demographics
- County
- Columbia County · 17,176 people
- City population
- 184
- Metro
- Hudson, NY
- Population (ZIP)
- 17,176
- Household income
- $72,741
- Rent vs Own
- Severe rent burden
- 1083.0
Population outlook (Columbia County) Hauer SSP2
- Today (2025)
- 58,662 people
- By 2030
- 56,557 · -3.6%
- By 2040
- 51,324 · -12.5%
- By 2050
- 45,790 · -21.9%
- By 2075
- 35,232 · -39.9%
- By 2100
- 25,846 · -55.9%
Race, ethnicity, and origin ACS 2023
- Neighborhood character
- Predominantly White (74%)
- Race & ethnicity
- White 74% Two or more races 7% Black 7% Hispanic / Latino 7% Asian 6%
- Hispanic origin (detail)
- Mexican 2% Puerto Rican 1%
- Common ancestry
- Lithuanian 4% Romanian 4% Iranian 3%
- Foreign-born
- 10% · Canada, China
- Languages at home
- 88% English-only · Spanish 5% Other Indo-European 3% Chinese 1%
Political lean MEDSL · Columbia
- 2024 margin
- D (+14.7) · D 57.4% · R 42.6%
- 2008→2024 swing
- +1.3pp toward D · 2008: 13.4pp · 2024: 14.7pp
- All cycles
- 2024: D+14.7 2020: D+16.7 2016: D+1.4 2012: D+11.7 2008: D+13.4
Not yet ingested
- Civics
- —
Market trends
- HPI YoY
- ▲ 25.98%
- Current HPI
- 490.0412
- Rent YoY
- ▲ 10.88%
- Metro
- Hudson, NY
- State GDP YoY
- ▲ 2.60%
- F500 in state
- 92
Industry mix (Fortune 500 HQ in NY)
| Industry | F500 HQs | Revenue |
|---|---|---|
| Financial Services | 10 | $950B |
|
||
| Consumer Goods | 9 | $162B |
|
||
| Insurance | 4 | $225B |
|
||
| Telecommunications | 2 | $144B |
|
||
| Pharmaceuticals | 2 | $112B |
|
||
| Media / Entertainment | 2 | $69B |
|
||
Price history
-23.3% since first listed7 events — show timeline
- 2026-05-18 Relisted — HVCRMLS
- 2026-05-18 Delisted — HVCRMLS
- 2026-05-11 Relisted — HVCRMLS
- 2026-05-11 Price Changed $115,000 HVCRMLS
- 2026-01-11 Rental Removed $1,650 RENTSPREE
- 2026-01-07 Listed for Rent $1,650 RENTSPREE
- 2025-08-15 Listed $150,000 HVCRMLS
Cash-flow waterfall
monthlySold comps — $/sqft
last 12 mo · ≤1 miLoading sold comps…