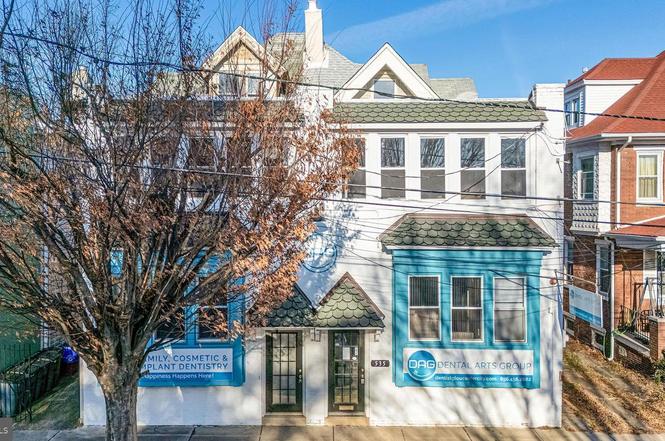
535 Monmouth St · Gloucester City, NJ
Flood risk No data
- FEMA flood zone
- —
- Chance of flooding over 30 yrs
- —
- Est. flood insurance / yr
- —
Fire risk No data
- Est. fire insurance / yr
- —
Heat risk No data
- Hot days now (above threshold)
- —
- Hot days in 30 yrs
- —
Wind risk No data
- Chance of severe wind over 30 yrs
- —
Air-quality risk No data
- Unhealthy air days now
- —
- Unhealthy air days in 30 yrs
- —
Risk factors via First Street. Map © Google.
Why this score? — see what drove the C grade
The composite is a weighted blend of 9 inputs, each scored 0–100. Each bar is that input's sub-score; the figure is the points it added to the 100-point composite (weight × sub-score).
- Cash flow +24.5/30.0
- DSCR +7.9/10.0
- ARV discount +7.5/15.0
- 1% rule +6.3/10.0
- Livability +3.6/5.0
- Rent growth +2.5/5.0
- Condition / age +2.5/5.0
- Schools +2.0/10.0
- Appreciation +0.0/10.0
$235,000
🖨 Deal sheet (PDF) 📄 Offer letter ✓ Due diligence
Listing remarks
This is a giant property with excellent visibility and access just off the corner of Monmouth and Broadway with immense intrinsic value. Currently set up as a vacant Dental office, the property is zoned RCS. Seller is a dentist and prefers to take equipment with them. Awesome opportunity to potentially covert to Mixed Use with Commercial on the first floor and up to two more residential units on 2nd and 3rd floor. The building looks like it was a side-by-side duplex originally based on the framing and the exterior profile. This property is being underutilized and has plenty of room for highest and best use. Buyer to do their own due diligence to determine viability for residential conversio
Key facts
- Zoned rcs
- 5,388 sq ft lot
- Built 1890
Tags
Neighborhood map
What this means for you Summary
Snapshot
- This is a 4-bed/?-bath single-family listed at $235k.
Deal economics
- At list price, monthly cash flow is $482 ($6k/yr) — positive.
- The deal already cash-flows at list — no discount required.
- Meets the 1% rule at list price ($3k rent vs $235k).
- Recommended offer: $221k (6.0% below list) — sets the bar for market timing.
- Cap rate 8.8% vs local median 5.5% in Gloucester City — top-decile yield for the area; either an underpriced asset or a hidden risk that comps aren't pricing in. Stress-test before assuming the spread holds.
Location & tenants
- Location reads 72/100 on livability (#215 in NJ) — a middle-class / working-renter tenant base. Strengths: housing A+, health & safety B+; Watch: amenities F, commute F.
- Gloucester City Public School District (suburban): math 11% / reading 34% proficiency, ranked #413 of 472 in NJ (top 88%) — low school quality limits family demand, transient renter base, plan for 1-2y turnover.
- Market conditions: 90 active listings in the ZIP; 1,018 units permitted in Camden County in 2024 (509 in 5+ unit buildings).
- At $2,666/mo this rent would consume 50% of the median local household income ($63k/yr) (locally 431% of renters already pay >50% of income on rent) — very limited rent-growth headroom before tenants either downsize or default.
Forward outlook
- Local home prices are declining (-3.0%/yr); year-one equity from $2k of loan paydown is wiped out by about $7k of value loss. Plan a longer hold.
- Camden County population projected to shrink 8% by 2050 — rents likely to lag national; underwrite the cash flow, not the appreciation.
Negotiation context
- It's been on market 77 days — a 6% lower offer ($221k) is reasonable based on typical stale-listing flexibility.
- 2 sale attempts; this cycle's ask has dropped $40k (15%) from the opening price — seller is motivated, your offer sets the floor, not the list.
Risks & watch-outs
- Watch-outs: built in 1890 — expect roof / HVAC / electrical / plumbing capex.
Questions for the listing agent
- It's been on market 77 days. Have you received any prior offers? Is the seller open to a 6% concession, seller financing, or rate buy-down credit?
- Built in 1890 — when were the roof, HVAC, electrical panel, plumbing, and water heater last replaced?
- Why hasn't it sold? Are there any deal-killer items the seller is aware of (foundation, flood, title, zoning, code violations)?
- Is there a deadline driving the sale (1031 exchange, divorce, estate, relocation)? That informs how much negotiation room exists.
- What's the average days-on-market for RENTAL listings here right now (not sales)? A rising rental-DOM trend means longer vacancies and softer asking-rent achievability than the comps imply.
- What's the recent tenant-quality profile in this submarket — average credit score on applications, eviction rate, late-payment / NSF rate, and stable-employment percentage? A property-management company in the area should have these aggregated.
- How much new for-sale + rental construction is in the pipeline within 1–3 miles? Heavy new supply typically softens prices + rents 12–24 months out; constrained supply supports both.
Investment metrics
- 1% rule
- 1.13% ✓
- Cap rate
- 8.76%
- Cash-on-cash
- 8.79%
- DSCR
- 1.39
- GRM
- 7.3
CMA / ARV
No comps found within radius.
Projected returns pro-forma
-3.0% appreciation · 3.0% rent growth · sell at horizon
- IRR
- -3.0%
- Equity multiple
- 0.89×
- Total profit
- $-7,327
- Equity at exit
- $35,039
- IRR
- 6.8%
- Equity multiple
- 1.51×
- Total profit
- $33,331
- Equity at exit
- $20,319
Cash invested: $65,800 (down + closing). Projections, not guarantees.
Landlord ↔ Tenant lean methodology
- Overall (STATE)
- 21 Tenant-Leaning
- State New Jersey
- 21 Tenant-Leaning · D+6
- County
- — inherits STATE
- City
- — inherits STATE
ZIP-level market 08030
- Home prices YoY
- -27.9%
- Active inventory
- 90
- Price-to-rent
- 7.3×
Monthly cashflow live
- Estimated rent
- $2,666 medium interval (Pro) →
- Mortgage (P&I)
- −$1,232
- Tax est. 1.5%
- −$294 /mo · $3,525/yr
- Insurance
- −$98
- HOA
- −$0
- Vacancy / Maint / Mgmt
- −$560
- Net cashflow
- $482
Break-even live
Sensitivity live
| Price | -10% $645 | -5% $563 | +0% $482 | +5% $401 | +10% $320 |
|---|---|---|---|---|---|
| Rent | -10% $272 | -5% $377 | +0% $482 | +5% $588 | +10% $693 |
| Rate | -1.0pp $601 | -0.5pp $542 | base $482 | +0.5pp $421 | +1.0pp $359 |
UW: 25.0% down · 7.5% · 30yr · 1.5% tax · 5.0% vac · 8.0% maint · 8.0% mgmt
Financing live
Cash to close
- Down payment
- $58,750
- Closing costs
- $7,050
- Reserves months
- —
- Total cash needed
- —
Loan-product check · same deal, 3 products live
Conventional
25% down · 7.5% · 30yr
- Down + closing
- —
- Monthly P&I
- —
- Monthly cashflow
- —
- DSCR
- —
- Eligible?
- —
Personal DTI + credit; lowest rate.
DSCR
20% down · 8.5% · 30yr
- Down + closing
- —
- Monthly P&I
- —
- Monthly cashflow
- —
- DSCR
- —
- Eligible?
- —
No personal income docs; deal must DSCR.
Hard money
10% down · 12.0% · 12mo
- Down + closing
- —
- Monthly P&I
- —
- Monthly cashflow
- —
- DSCR
- —
- Eligible?
- —
Short-term bridge; refi at stabilization.
Listing history 6 events
-
2026-03-10status Pending
-
2026-01-30price $235,000
-
2025-12-23$275,000 Active
-
2025-11-10historical
-
2025-08-08price $275,000
-
2025-07-23$300,000 Active
ⓘ Source: listings_history table (triggers on properties + properties_extension) + one-shot
backfill from property_details.listing_events for pre-trigger history.
Nearby sold comps map
Loading sold comps map…
Walkable amenities ~0.75 mi
Loading nearby amenities…
Taxation est. · year 1
- Rental income
- $31,994
- − Mortgage interest
- −$13,164
- − Property taxes
- −$3,525
- − Insurance
- −$1,175
- − Repairs & maintenance
- −$2,559
- − Management
- −$2,559
- − Depreciation
- −$6,836
- Taxable income
- $2,175
- Est. tax owed @ 24.0%
- −$522
- After-tax cash flow
- $5,265/yr
For passive investors: Depreciation is non-cash, so a rental often shows a tax loss while cash-flowing — sheltering income. Rental losses are passive: they offset passive income freely, and up to $25,000/yr can offset ordinary (W-2) income if you actively participate and your MAGI is under $100k (phasing out to $0 by $150k); unused losses carry forward. On sale, claimed depreciation is recaptured at up to 25%, and gains may owe capital-gains tax (a 1031 exchange can defer both). Figures are a year-1 estimate at your 24.0% rate — not tax advice; consult a CPA.
Schools (NCES district)
- District
- Gloucester City Public School District
- NCES district ID
- 3406000
- Math proficiency
- 11% ▼ -21.00%
- Reading proficiency
- 34% ▼ -15.00%
- Median HH income
- $51,231
- Composite
- 20.01/100
- National rank
- #8664
- State rank
- #413 of 472 in NJ
Livability — Gloucester City
- Score
- 72/100
- State rank
- #215
- US rank
- #5984
Category grades
Schools grade is shown separately in the Schools card above.
Census & demographics
- Census place
- Gloucester City, NJ
- County
- Camden County · 407,624 people
- City population
- 13,217
- Metro
- Philadelphia-Camden-Wilmington, PA-NJ-DE-MD
- Population (ZIP)
- 13,217
- Household income
- $63,384
- Rent vs Own
- Severe rent burden
- 431.0
Population outlook (Camden County) Hauer SSP2
- Today (2025)
- 507,964 people
- By 2030
- 502,182 · -1.1%
- By 2040
- 485,602 · -4.4%
- By 2050
- 465,630 · -8.3%
- By 2075
- 419,986 · -17.3%
- By 2100
- 369,492 · -27.3%
Race, ethnicity, and origin ACS 2023
- Neighborhood character
- Predominantly White (68%)
- Race & ethnicity
- White 68% Hispanic / Latino 18% Black 7% Asian 5% Two or more races 5%
- Hispanic origin (detail)
- Mexican 4% Puerto Rican 10%
- Common ancestry
- Romanian 4% Lithuanian 3% Hispanic 2%
- Foreign-born
- 8% · Canada, Jamaica, China
- Languages at home
- 81% English-only · Spanish 13% Other Indo-European 4% Arabic 1%
Political lean MEDSL · Camden
- 2024 margin
- Strong D (+27.4) · D 63.0% · R 35.5% · Other 1.5%
- 2008→2024 swing
- -8.8pp toward R · 2008: 36.2pp · 2024: 27.4pp
- All cycles
- 2024: D+27.4 2020: D+33.5 2016: D+32.4 2012: D+36.6 2008: D+36.2
Not yet ingested
- Civics
- —
Market trends
- HPI YoY
- ▼ -115.59%
- Current HPI
- 298.9139
- Rent YoY
- —
- Metro
- Philadelphia-Camden-Wilmington, PA-NJ-DE-MD
- State GDP YoY
- ▲ 2.05%
- F500 in state
- 34
Industry mix (Fortune 500 HQ in NJ)
| Industry | F500 HQs | Revenue |
|---|---|---|
| Consumer Goods | 3 | $31B |
|
||
| Pharmaceuticals | 2 | $153B |
|
||
| Technology | 2 | $21B |
|
||
| Insurance | 2 | $20B |
|
||
| Healthcare | 2 | $19B |
|
||
| Financial Services | 1 | $70B |
|
||
Price history
-21.7% since first listed6 events — show timeline
- 2026-03-10 Pending — BRIGHT MLS
- 2026-01-30 Price Changed $235,000 BRIGHT MLS
- 2025-12-23 Listed $275,000 BRIGHT MLS
- 2025-11-10 Listing Removed — BRIGHT MLS
- 2025-08-08 Price Changed $275,000 BRIGHT MLS
- 2025-07-23 Listed $300,000 BRIGHT MLS
Cash-flow waterfall
monthlySold comps — $/sqft
last 12 mo · ≤1 miLoading sold comps…