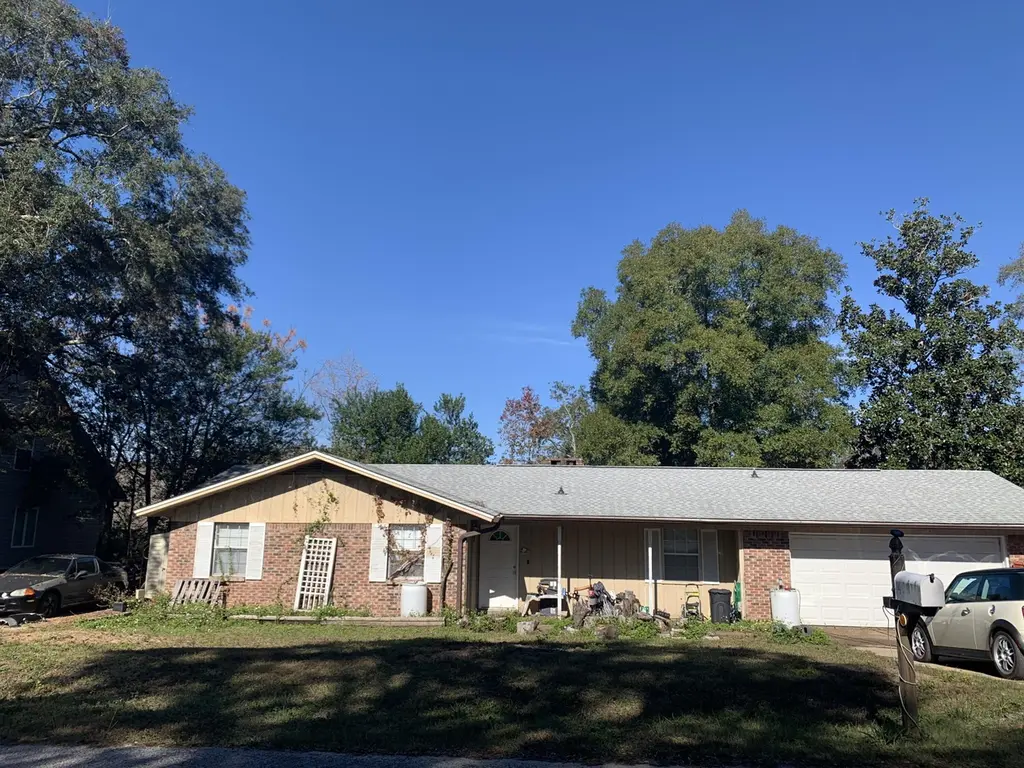
405 King St · Niceville, FL
Flood risk 1/10 · Minimal
- FEMA flood zone
- X (unshaded)
- Chance of flooding over 30 yrs
- 0.0%
- Est. flood insurance / yr
- $507 – $1,088
Fire risk 1/10 · Minimal
- Est. fire insurance / yr
- $947 – $1,759
Heat risk 10/10 · Severe
- Hot days now (above 103°F)
- 7 days/yr
- Hot days in 30 yrs
- 23 days/yr
Wind risk 9/10 · Severe
- Chance of severe wind over 30 yrs
- 99.0%
Air-quality risk 1/10 · Minimal
- Unhealthy air days now
- 0 days/yr
- Unhealthy air days in 30 yrs
- 0 days/yr
Risk factors via First Street. Map © Google.
Why this score? — see what drove the D grade
The composite is a weighted blend of 9 inputs, each scored 0–100. Each bar is that input's sub-score; the figure is the points it added to the 100-point composite (weight × sub-score).
- ARV discount +11.5/15.0
- Cash flow +10.1/30.0
- Schools +5.2/10.0
- Livability +4.0/5.0
- DSCR +2.9/10.0
- Condition / age +2.5/5.0
- Rent growth +2.4/5.0
- 1% rule +2.1/10.0
- Appreciation +0.0/10.0
$320,000
🖨 Deal sheet 📄 Offer letter ✓ Due diligence
Listing remarks MLS
SOLID BRICK Home with backyard FENCED CENTRALLY Located in Niceville. RV Concrete PAD with clean out, oversized car garage, Roof 2018 with GAF Timberline HD, HVAC 2018 and serviced 2024, Goodman 2.0 Ton 13 Seer heat pump replaced 2014, Water Heater 2010, Rain Gutters installed 2016. Airduct cleaned in 2018. Wiring Copper, Plumbing, Copper and PVC. Kitchen updated 2007 with laminated countertop with solid oak cabinets. Microwave built in exhaust. Little TLC for this house for a perfect starter or Rental Investment with . 23 ac lot with Brick Fireplace.
Key facts
- Brick fireplace
- Rv concrete pad
- Backyard fenced
Tags
Neighborhood map
What this means for you Summary
Snapshot
- This is a 3-bed/2.0-bath single-family listed at $320k.
Deal economics
- At list price, monthly cash flow is $-186 ($-2k/yr) — negative.
- To cash-flow at today's rent, offer at most $287k (10.3% below list).
- To meet the 1% rule (rent ≥ 1% of price), the offer needs to be $227k (29.1% below list).
- Recommended offer: $227k (29.1% below list) — sets the bar for 1% rule.
- Cap rate 5.6% vs local median 3.0% in Niceville — top-decile yield for the area; either an underpriced asset or a hidden risk that comps aren't pricing in. Stress-test before assuming the spread holds.
Location & tenants
- Location reads 79/100 on livability (#147 in FL, #2,207 nationally) — a middle-class / working-renter tenant base. Strengths: schools A+, employment A+, housing A+; Watch: amenities F, commute F.
- Okaloosa (other): math 60% / reading 60% proficiency, ranked #12 of 73 in FL (top 16%) — acceptable for families but not a draw, mixed tenant base, ~2y average lease.
- Market conditions: Rents soft (-0.4%/yr); 340 active listings in the ZIP; 20 comparable units currently listed for rent nearby; rentals lingering (median 44d on market — plan ~5-8 weeks vacancy on turnover, expect pricing pressure); 50% of comp listings sitting > 30 days — soft ceiling on asking rent; solid renter incomes; 1,268 units permitted in Okaloosa County in 2024 (175 in 5+ unit buildings).
Forward outlook
- Local home prices are declining (-3.0%/yr); year-one equity from $2k of loan paydown is wiped out by about $10k of value loss. Plan a longer hold.
- Okaloosa County population projected at +37% by 2050 — long-run rental-demand tailwind backs the buy-and-hold thesis.
Negotiation context
- It's been on market 178 days — a 12% lower offer ($282k) is reasonable based on typical stale-listing flexibility.
- 6 sale attempts since 32y ago with the ask held roughly flat each time — persistent listings suggest the price (not the market) is what's stuck; bring a comps-based counter.
- Current owner paid $155k; list at $320k implies a 106% gain — meaningful room to come down on a strong offer.
Risks & watch-outs
- Climate carrying-cost: severe wind risk, 99% chance of damaging wind over 30y; extreme-heat days projected 7→23/yr by 2055 (HVAC capex compounding) — expect insurance premiums to compound above CPI over the hold.
Questions for the listing agent
- What do current leases actually rent for vs. the listed asking? Can we see a recent rent roll and the last 12 months of T-12 income?
- It's been on market 178 days. Have you received any prior offers? Is the seller open to a 29% concession, seller financing, or rate buy-down credit?
- Built in 1978 — when were the roof, HVAC, electrical panel, plumbing, and water heater last replaced?
- Why hasn't it sold? Are there any deal-killer items the seller is aware of (foundation, flood, title, zoning, code violations)?
- Is there a deadline driving the sale (1031 exchange, divorce, estate, relocation)? That informs how much negotiation room exists.
- Schools are A-rated — typically a magnet for longer-tenancy family renters. What's the average tenant stay here, and is there a school-zone premium baked into asking?
- The area grade is low — what's the realistic commute time and amenity access for the typical tenant pool here? Any planned neighborhood developments (good or bad) we should know about?
- What's the average days-on-market for RENTAL listings here right now (not sales)? A rising rental-DOM trend means longer vacancies and softer asking-rent achievability than the comps imply.
- What's the recent tenant-quality profile in this submarket — average credit score on applications, eviction rate, late-payment / NSF rate, and stable-employment percentage? A property-management company in the area should have these aggregated.
- How much new for-sale + rental construction is in the pipeline within 1–3 miles? Heavy new supply typically softens prices + rents 12–24 months out; constrained supply supports both.
Investment metrics
- 1% rule
- 0.71% ✗
- Cap rate
- 5.60%
- Cash-on-cash
- -2.49%
- DSCR
- 0.89
- GRM
- 11.7
CMA / ARV
- ARV (median comp)
- $350,841
- List price
- $320,000
- Delta
- -8.79%
- Verdict
- FAIR
- Comps
- 20 within 1.0 mi
Show comp detail 12 sales within ~0.75 mi
| Address | Dist | Beds/Ba | Sqft | Sold | Price | $/sf | Match |
|---|---|---|---|---|---|---|---|
| 119 Sasser St | 0.18mi | 3/2.0 | 1,362 (-1%) | 1mo | $327,000 | $240 | 89 |
| 420 Bullock Blvd | 0.15mi | 3/2.0 | 1,347 (-2%) | 2mo | $324,000 | $241 | 87 |
| 514 Linden Ave | 0.25mi | 3/2.0 | 1,327 (-4%) | 1mo | $275,000 | $207 | 81 |
| 313 Pontevedra Ln | 0.31mi | 3/2.0 | 1,421 (+3%) | 1mo | $350,000 | $246 | 80 |
| 302 22Nd St | 0.26mi | 3/2.0 | 1,315 (-5%) | 3mo | $340,000 | $259 | 77 |
| 420 Paradise Rd | 0.08mi | 3/2.0 | 1,555 (+13%) | 1mo | $359,800 | $231 | 74 |
| 116 Quince Ave | 0.55mi | 3/2.0 | 1,335 (-3%) | 3mo | $338,900 | $254 | 66 |
| 1000 Bayshore Dr | 0.62mi | 3/1.5 | 1,397 (+1%) | 2mo | $270,000 | $193 | 66 |
| 1109 Phyllis Ave | 0.25mi | 3/2.0 | 1,206 (-13%) | 3mo | $350,000 | $290 | 65 |
| 1535 Valparaiso Blvd | 0.70mi | 3/2.0 | 1,404 (+2%) | 3mo | $305,000 | $217 | 62 |
| 497 20th St | 0.33mi | 3/2.0 | 1,558 (+13%) | 1mo | $385,000 | $247 | 62 |
| 236 Karen Ct | 0.35mi | 3/2.0 | 1,571 (+14%) | 1mo | $361,000 | $230 | 60 |
Match score weights: distance 35% · size 25% · config 20% · recency 20%. Top-matched comps best support the ARV.
Projected returns pro-forma
-3.0% appreciation · 0.0% rent growth · sell at horizon
- IRR
- -23.5%
- Equity multiple
- 0.21×
- Total profit
- $-70,456
- Equity at exit
- $47,713
- IRR
- -27.8%
- Equity multiple
- -0.15×
- Total profit
- $-102,749
- Equity at exit
- $27,668
Cash invested: $89,600 (down + closing). Projections, not guarantees.
Landlord ↔ Tenant lean methodology
- Overall (STATE)
- 87 Strongly Landlord-Friendly
- State Florida
- 87 Strongly Landlord-Friendly · R+3
- County
- — inherits STATE
- City
- — inherits STATE
ZIP-level market 32578
- Home prices YoY
- -2.5%
- Rents YoY
- -0.4%
- Active inventory
- 340
- Price-to-rent
- 11.7×
Monthly cashflow live
- Estimated rent
- $2,270 high interval (Pro) →
- Mortgage (P&I)
- −$1,678
- Tax from tax record
- −$168 /mo · $2,012/yr
- Insurance
- −$133
- HOA
- −$0
- Vacancy / Maint / Mgmt
- −$477
- Net cashflow
- $-186
Break-even live
UW: 25.0% down · 7.5% · 30yr · 1.5% tax · 5.0% vac · 8.0% maint · 8.0% mgmt
Financing live
Cash to close
- Down payment
- $80,000
- Closing costs
- $9,600
- Reserves months
- —
- Total cash needed
- —
Loan-product check · same deal, 3 products live
Conventional
25% down · 7.5% · 30yr
- Down + closing
- —
- Monthly P&I
- —
- Monthly cashflow
- —
- DSCR
- —
- Eligible?
- —
Personal DTI + credit; lowest rate.
DSCR
20% down · 8.5% · 30yr
- Down + closing
- —
- Monthly P&I
- —
- Monthly cashflow
- —
- DSCR
- —
- Eligible?
- —
No personal income docs; deal must DSCR.
Hard money
10% down · 12.0% · 12mo
- Down + closing
- —
- Monthly P&I
- —
- Monthly cashflow
- —
- DSCR
- —
- Eligible?
- —
Short-term bridge; refi at stabilization.
Rent comps 20 comps
| Address | Beds | Baths | Sqft | Rent | $/sqft | DOM | Units | Dist |
|---|---|---|---|---|---|---|---|---|
| 414 20th St Niceville, FL | 3.0 | 2.0 | 1800 | $2,600 | $1.44 | 13d | 1 | 0.21mi |
| 454 Reeves St Niceville, FL | 2.0 | 2.0 | 1118 | $2,100 | $1.88 | 43d | 1 | 0.40mi |
| 225 Hudson Boyd Ct Niceville, FL | 2.0 | 2.0 | 1118 | $2,200 | $1.97 | 13d | 1 | 0.43mi |
| 103 22nd St Niceville, FL | 2.0 | 2.0 | 1200 | $2,300 | $1.92 | 43d | 1 | 0.48mi |
| 1401 Beaver Run Rd Niceville, FL | 3.0 | 2.5 | 1450 | $1,900 | $1.31 | 43d | 1 | 0.58mi |
| 1407 Beaver Run Rd Niceville, FL | 3.0 | 2.5 | 1462 | $1,795 | $1.23 | 43d | 1 | 0.59mi |
| 124 Harding Rd Unit B Niceville, FL | 3.0 | 2.0 | 1566 | $2,300 | $1.47 | 13d | 1 | 0.61mi |
| 125 Farrah Ave Niceville, FL | 3.0 | 2.5 | 1696 | $2,200 | $1.30 | 13d | 1 | 0.72mi |
| 912 Nutmeg Ave Niceville, FL | 3.0 | 2.0 | 1118 | $2,100 | $1.88 | 13d | 1 | 0.76mi |
| 912 Nutmeg Ave Niceville, FL | 3.0 | 2.0 | 1118 | $2,100 | $1.88 | 43d | 1 | 0.76mi |
| 1105 Rhonda Dr Niceville, FL | 4.0 | 2.0 | 1593 | $2,500 | $1.57 | 21d | 1 | 0.77mi |
| 1717 26th St Niceville, FL | 3.0 | 2.0 | 1484 | $1,895 | $1.28 | 43d | 1 | 0.77mi |
| 1038 37th St Niceville, FL | 3.0 | 3.0 | 1745 | $2,100 | $1.20 | 21d | 1 | 0.92mi |
| 289 Honeysuckle Way Niceville, FL | 4.0 | 2.0 | 1648 | $3,000 | $1.82 | 13d | 1 | 0.94mi |
| 1755 Union Ave #14 Niceville, FL | 3.0 | 2.5 | 1317 | $2,200 | $1.67 | 21d | 1 | 0.99mi |
| 210 Honeysuckle Way Niceville, FL | 4.0 | 2.0 | 1739 | $2,350 | $1.35 | 13d | 1 | 0.99mi |
| 561 Bayshore Dr Unit 1 Niceville, FL | 2.0 | 2.0 | 1644 | $2,200 | $1.34 | 43d | 1 | 1.05mi |
| 203 John Sims Pkwy Unit F Niceville, FL | 2.0 | 1.0 | 900 | $1,295 | $1.44 | 43d | 1 | 1.38mi |
| Hickory Ave Niceville, FL | 2.0 | 1.5 | 1030 | $1,475 | $1.43 | 43d | 1 | 1.41mi |
| 133 3rd St Unit B Niceville, FL | 2.0 | 1.0 | 915 | $1,425 | $1.56 | 43d | 1 | 1.44mi |
Listing history 13 events
-
2025-11-29$320,000 Active 558-char remark
Show marketing remark (558 chars)
SOLID BRICK Home with backyard FENCED CENTRALLY Located in Niceville. RV Concrete PAD with clean out, oversized car garage, Roof 2018 with GAF Timberline HD, HVAC 2018 and serviced 2024, Goodman 2.0 Ton 13 Seer heat pump replaced 2014, Water Heater 2010, Rain Gutters installed 2016. Airduct cleaned in 2018. Wiring Copper, Plumbing, Copper and PVC. Kitchen updated 2007 with laminated countertop with solid oak cabinets. Microwave built in exhaust. Little TLC for this house for a perfect starter or Rental Investment with . 23 ac lot with Brick Fireplace.
-
2013-10-17historical
-
2011-08-05$149,900
-
2011-08-05$149,900
-
2007-12-04soldstatus $155,000
-
2007-11-30soldstatus $155,000
-
2007-11-30soldstatus $155,000
-
2007-11-21soldstatus $115,000
-
2007-11-02$159,900
-
2007-11-02$159,900
-
1994-10-17soldstatus $72,000
-
1994-06-15$72,000
-
1987-07-01soldstatus $61,000
ⓘ Source: listings_history table (triggers on properties + properties_extension) + one-shot
backfill from property_details.listing_events for pre-trigger history.
Tax reassessment forecast FL · Resets to sale price
- Current annual tax
- $2,012 · $168/mo
- Projected year-2 tax
- $2,656 · $221/mo
- Expected delta
- +$644/yr (+$54/mo · 32.0%)
ⓘ Screening estimate from a state-policy table — verify with the county assessor before closing.
Climate risk First Street
- Flood 1/10 Low FEMA zone X (unshaded) · 0% chance over 30 yrs
- Wildfire 1/10 Low
- Heat 10/10 Extreme 7 d/yr ≥103°F today · 23 d/yr by 30 yrs out
- Wind 9/10 Extreme 99% chance of damaging wind over 30 yrs
- Air quality 1/10 Low 0 unhealthy d/yr today · 0 by 30 yrs out
Nearby sold comps map
Loading sold comps map…
Walkable amenities ~0.75 mi
Loading nearby amenities…
Taxation est. · year 1
- Rental income
- $27,238
- − Mortgage interest
- −$17,925
- − Property taxes
- −$2,012
- − Insurance
- −$1,600
- − Repairs & maintenance
- −$2,179
- − Management
- −$2,179
- − Depreciation
- −$9,309
- Taxable loss
- −$7,966
- Est. tax savings @ 24.0%
- +$1,912
- After-tax cash flow
- $-319/yr
For passive investors: Depreciation is non-cash, so a rental often shows a tax loss while cash-flowing — sheltering income. Rental losses are passive: they offset passive income freely, and up to $25,000/yr can offset ordinary (W-2) income if you actively participate and your MAGI is under $100k (phasing out to $0 by $150k); unused losses carry forward. On sale, claimed depreciation is recaptured at up to 25%, and gains may owe capital-gains tax (a 1031 exchange can defer both). Figures are a year-1 estimate at your 24.0% rate — not tax advice; consult a CPA.
Schools (NCES district)
- District
- Okaloosa
- NCES district ID
- 1201380
- Math proficiency
- 60% ▼ -12.00%
- Reading proficiency
- 60% ▼ -4.00%
- Median HH income
- $55,601
- Composite
- 51.62/100
- National rank
- #1705
- State rank
- #12 of 73 in FL
Livability — Niceville
- Score
- 79/100
- State rank
- #147
- US rank
- #2207
Category grades
Schools grade is shown separately in the Schools card above.
Census & demographics
- County
- Okaloosa County · 194,352 people
- Metro
- Crestview-Fort Walton Beach-Destin, FL
- Population (ZIP)
- 34,738
- Household income
- $108,972
- Rent vs Own
- Severe rent burden
- 660.0
Population outlook (Okaloosa County) Hauer SSP2
- Today (2025)
- 235,133 people
- By 2030
- 253,483 · +7.8%
- By 2040
- 289,537 · +23.1%
- By 2050
- 322,954 · +37.3%
- By 2075
- 399,624 · +70.0%
- By 2100
- 425,311 · +80.9%
Race, ethnicity, and origin ACS 2023
- Neighborhood character
- Predominantly White (79%)
- Race & ethnicity
- White 79% Two or more races 9% Hispanic / Latino 8% Asian 4% Black 3%
- Hispanic origin (detail)
- Mexican 3% Puerto Rican 2%
- Common ancestry
- Slovak 3% Serbian 3% Lithuanian 2%
- Foreign-born
- 8% · Canada, Jamaica
- Languages at home
- 90% English-only · Spanish 5% Other Indo-European 1% Other Asian/Pacific 1%
Political lean MEDSL · Okaloosa
- 2024 margin
- Solid R (+42.4) · D 28.2% · R 70.7% · Other 1.1%
- 2008→2024 swing
- +2.5pp toward D · 2008: -44.9pp · 2024: -42.4pp
- All cycles
- 2024: R+42.4 2020: R+39.1 2016: R+47.8 2012: R+49.4 2008: R+44.9
Not yet ingested
- Civics
- —
Market trends
- HPI YoY
- ▼ -12.87%
- Current HPI
- 498.41
- Rent YoY
- ▼ -0.36%
- Metro
- Crestview-Fort Walton Beach-Destin, FL
- State GDP YoY
- ▲ 3.28%
- F500 in state
- 36
Industry mix (Fortune 500 HQ in FL)
| Industry | F500 HQs | Revenue |
|---|---|---|
| Industrial Technology | 2 | $29B |
|
||
| Insurance | 2 | $17B |
|
||
| Retail | 1 | $60B |
|
||
| Technology Distribution | 1 | $58B |
|
||
| Homebuilding | 1 | $35B |
|
||
| Technology Manufacturing | 1 | $35B |
|
||
Price history
+424.6% since first listed13 events — show timeline
- 2025-11-29 Listed $320,000 ECAR
- 2013-10-17 Listing Removed — NAMLS
- 2011-08-05 Listed $149,900 NAMLS
- 2011-08-05 Listed $149,900 ECAR
- 2007-12-04 Sold (Public Records) $155,000 Public Records
- 2007-11-30 Sold (MLS) $155,000 NAMLS
- 2007-11-30 Sold (MLS) $155,000 ECAR
- 2007-11-21 Sold (Public Records) $115,000 Public Records
- 2007-11-02 Listed $159,900 NAMLS
- 2007-11-02 Listed $159,900 ECAR
- 1994-10-17 Sold (Public Records) $72,000 Public Records
- 1994-06-15 Listed $72,000 ECAR
- 1987-07-01 Sold (Public Records) $61,000 Public Records
Property tax history
+5.6%/yrLatest (2021): $2,012 · -14.3% YoY. Source: county tax records.
Cash-flow waterfall
monthlySold comps — $/sqft
last 12 mo · ≤1 miLoading sold comps…