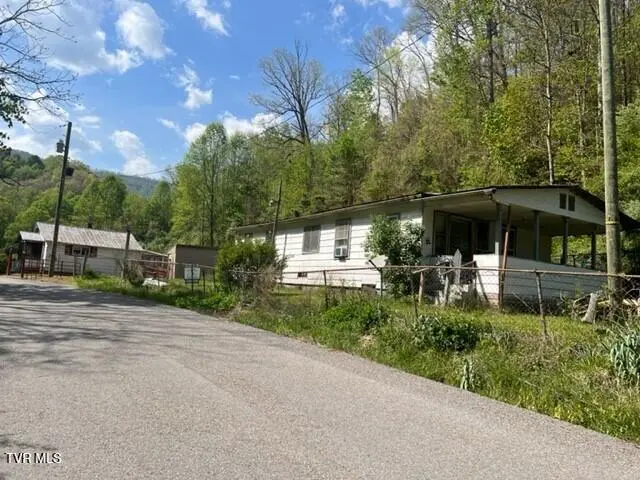
3179 Ely Pucketts Creek Rd · Pennington Gap, VA
Flood risk 1/10 · Minimal
- FEMA flood zone
- X (unshaded)
- Chance of flooding over 30 yrs
- 0.0%
- Est. flood insurance / yr
- $507 – $1,088
Fire risk 6/10 · Moderate
- Est. fire insurance / yr
- $666 – $1,236
Heat risk 3/10 · Minor
- Hot days now (above 97°F)
- 8 days/yr
- Hot days in 30 yrs
- 24 days/yr
Wind risk 2/10 · Minimal
- Chance of severe wind over 30 yrs
- —
Air-quality risk 1/10 · Minimal
- Unhealthy air days now
- 0 days/yr
- Unhealthy air days in 30 yrs
- 0 days/yr
Risk factors via First Street. Map © Google.
Why this score? — see what drove the B+ grade
The composite is a weighted blend of 9 inputs, each scored 0–100. Each bar is that input's sub-score; the figure is the points it added to the 100-point composite (weight × sub-score).
- Cash flow +30.0/30.0
- 1% rule +10.0/10.0
- DSCR +10.0/10.0
- ARV discount +9.1/15.0
- Appreciation +7.8/10.0
- Schools +5.0/10.0
- Livability +3.1/5.0
- Rent growth +2.5/5.0
- Condition / age +1.0/5.0
$27,500
🖨 Deal sheet (PDF) 📄 Offer letter ✓ Due diligence
Listing remarks MLS
BIG PRICE CHANGE!! ! Looking for a Project, a Rental Property, or a Home for Yourself! House Has Lots of Potential --Three Bedrooms, Large Kitchen/Dining Area, One Bath, Covered Front Porch, Public Water, Fenced Yard--Selling ''AS IS'' NOW IS THE TIME TO TAKE A LOOK AT THIS ONE!!
Key facts
- Covered front porch
- Fenced yard
- 5,662 sq ft lot
Tags
Neighborhood map
What this means for you Summary
Snapshot
- This is a 3-bed/1.0-bath single-family listed at $28k. Condition is rated poor.
Deal economics
- At list price, monthly cash flow is $610 ($7k/yr) — positive.
- The deal already cash-flows at list — no discount required.
- Meets the 1% rule at list price ($1k rent vs $28k).
- Recommended offer: $24k (12.0% below list) — sets the bar for market timing.
Location & tenants
- Location reads 62/100 on livability (#410 in VA) — a middle-class / working-renter tenant base. Strengths: crime A+, cost of living A+, housing B; Watch: amenities F, commute F, employment F.
- Lee County Public School District (rural): math 53% / reading 69% proficiency, ranked #62 of 131 in VA (top 47%) — acceptable for families but not a draw, mixed tenant base, ~2y average lease.
- Zoned schools: Flatwoods Elementary (math 67% / reading 72%, grade A-, #313 of 1,108 statewide, top 32%, 302 students, 83% FRL); Pennington Middle (math 51% / reading 67%, grade B, #166 of 342 statewide, top 50%, 274 students, 100% FRL); Lee High (math 54% / reading 71%, grade B-, #226 of 319 statewide, top 72%, 781 students, 99% FRL) — zoned schools average 94% FRL vs 58% district-wide (37 pts higher); higher-poverty schools than district average — tighter screening recommended.
- Market conditions: 31 active listings in the ZIP; 18 units permitted in Lee County in 2024 (0 in 5+ unit buildings).
Forward outlook
- In year one you build about $2k of equity ($190 loan paydown + $2k appreciation (5.6% local appreciation)).
- Lee County population projected at -27% by 2050 — secular population decline; favor cash flow + early exit over multi-decade hold.
- At projected returns (5.6% appreciation + 3.0% rent growth), your $8k cash investment doubles in ~1 year — after that, you're playing with house money.
Negotiation context
- It's been on market 146 days — a 12% lower offer ($24k) is reasonable based on typical stale-listing flexibility.
- 2 sale attempts; this cycle's ask has dropped $12k (29%) from the opening price — seller is motivated, your offer sets the floor, not the list.
Risks & watch-outs
- Climate carrying-cost: major wildfire risk — expect insurance premiums to compound above CPI over the hold.
Questions for the listing agent
- It's been on market 146 days. Have you received any prior offers? Is the seller open to a 12% concession, seller financing, or rate buy-down credit?
- Have any recent inspections been done? Can we get a copy of the seller's disclosures and any deferred-maintenance estimates?
- Why hasn't it sold? Are there any deal-killer items the seller is aware of (foundation, flood, title, zoning, code violations)?
- Is there a deadline driving the sale (1031 exchange, divorce, estate, relocation)? That informs how much negotiation room exists.
- What's the average days-on-market for RENTAL listings here right now (not sales)? A rising rental-DOM trend means longer vacancies and softer asking-rent achievability than the comps imply.
- What's the recent tenant-quality profile in this submarket — average credit score on applications, eviction rate, late-payment / NSF rate, and stable-employment percentage? A property-management company in the area should have these aggregated.
- How much new for-sale + rental construction is in the pipeline within 1–3 miles? Heavy new supply typically softens prices + rents 12–24 months out; constrained supply supports both.
Investment metrics
- 1% rule
- 3.68% ✓
- Cap rate
- 32.89%
- Cash-on-cash
- 94.99%
- DSCR
- 5.23
- GRM
- 2.3
CMA / ARV
- ARV (median comp)
- $28,513
- List price
- $27,500
- Delta
- -3.55%
- Verdict
- FAIR
- Comps
- 2 within 2.0 mi
Projected returns pro-forma
5.59% appreciation · 3.0% rent growth · sell at horizon
- IRR
- —
- Equity multiple
- 6.99×
- Total profit
- $46,116
- Equity at exit
- $16,584
- IRR
- 98.9%
- Equity multiple
- 14.70×
- Total profit
- $105,471
- Equity at exit
- $29,486
Cash invested: $7,700 (down + closing). Projections, not guarantees.
Landlord ↔ Tenant lean methodology
- Overall (STATE)
- 55 Moderately Landlord-Leaning
- State Virginia
- 55 Moderately Landlord-Leaning · D+2
- County
- — inherits STATE
- City
- — inherits STATE
ZIP-level market 24277
- Home prices YoY
- 3.5%
- Active inventory
- 31
- Price-to-rent
- 2.3×
Monthly cashflow live
- Estimated rent
- $1,012 medium interval (Pro) →
- Mortgage (P&I)
- −$144
- Tax est. 1.5%
- −$34 /mo · $412/yr
- Insurance
- −$11
- HOA
- −$0
- Vacancy / Maint / Mgmt
- −$213
- Net cashflow
- $610
Break-even live
Sensitivity live
| Price | -10% $629 | -5% $619 | +0% $610 | +5% $600 | +10% $591 |
|---|---|---|---|---|---|
| Rent | -10% $530 | -5% $570 | +0% $610 | +5% $650 | +10% $689 |
| Rate | -1.0pp $623 | -0.5pp $617 | base $610 | +0.5pp $602 | +1.0pp $595 |
UW: 25.0% down · 7.5% · 30yr · 1.5% tax · 5.0% vac · 8.0% maint · 8.0% mgmt
Financing live
Cash to close
- Down payment
- $6,875
- Closing costs
- $825
- Reserves months
- —
- Total cash needed
- —
Loan-product check · same deal, 3 products live
Conventional
25% down · 7.5% · 30yr
- Down + closing
- —
- Monthly P&I
- —
- Monthly cashflow
- —
- DSCR
- —
- Eligible?
- —
Personal DTI + credit; lowest rate.
DSCR
20% down · 8.5% · 30yr
- Down + closing
- —
- Monthly P&I
- —
- Monthly cashflow
- —
- DSCR
- —
- Eligible?
- —
No personal income docs; deal must DSCR.
Hard money
10% down · 12.0% · 12mo
- Down + closing
- —
- Monthly P&I
- —
- Monthly cashflow
- —
- DSCR
- —
- Eligible?
- —
Short-term bridge; refi at stabilization.
Listing history 17 events
-
2026-06-15days on market $27,500 Active 146 DOM
-
2026-06-15days on market $27,500 Active 145 DOM
-
2026-06-13days on market $27,500 Active 144 DOM
-
2026-06-12days on market $27,500 Active 143 DOM
-
2026-06-09days on market $27,500 Active 140 DOM
-
2026-06-08days on market $27,500 Active 139 DOM
-
2026-06-08days on market $27,500 Active 138 DOM
-
2026-06-07days on market $27,500 Active 137 DOM
-
2026-06-03days on market $27,500 Active 134 DOM
-
2026-06-02days on market $27,500 Active 133 DOM
-
2026-06-01days on market $27,500 Active 132 DOM
-
2026-05-31days on market $27,500 Active 131 DOM
-
2026-05-05status Active 283-char remark
Show marketing remark (283 chars)
BIG PRICE CHANGE!! ! Looking for a Project, a Rental Property, or a Home for Yourself! House Has Lots of Potential --Three Bedrooms, Large Kitchen/Dining Area, One Bath, Covered Front Porch, Public Water, Fenced Yard--Selling ''AS IS'' NOW IS THE TIME TO TAKE A LOOK AT THIS ONE!!
-
2026-04-30status Pending 283-char remark
Show marketing remark (283 chars)
BIG PRICE CHANGE!! ! Looking for a Project, a Rental Property, or a Home for Yourself! House Has Lots of Potential --Three Bedrooms, Large Kitchen/Dining Area, One Bath, Covered Front Porch, Public Water, Fenced Yard--Selling ''AS IS'' NOW IS THE TIME TO TAKE A LOOK AT THIS ONE!!
-
2026-04-30price $27,500 283-char remark
Show marketing remark (283 chars)
BIG PRICE CHANGE!! ! Looking for a Project, a Rental Property, or a Home for Yourself! House Has Lots of Potential --Three Bedrooms, Large Kitchen/Dining Area, One Bath, Covered Front Porch, Public Water, Fenced Yard--Selling ''AS IS'' NOW IS THE TIME TO TAKE A LOOK AT THIS ONE!!
-
2026-03-27price $31,000 283-char remark
Show marketing remark (283 chars)
BIG PRICE CHANGE!! ! Looking for a Project, a Rental Property, or a Home for Yourself! House Has Lots of Potential --Three Bedrooms, Large Kitchen/Dining Area, One Bath, Covered Front Porch, Public Water, Fenced Yard--Selling ''AS IS'' NOW IS THE TIME TO TAKE A LOOK AT THIS ONE!!
-
2026-01-15$39,000 Active 283-char remark
Show marketing remark (283 chars)
BIG PRICE CHANGE!! ! Looking for a Project, a Rental Property, or a Home for Yourself! House Has Lots of Potential --Three Bedrooms, Large Kitchen/Dining Area, One Bath, Covered Front Porch, Public Water, Fenced Yard--Selling ''AS IS'' NOW IS THE TIME TO TAKE A LOOK AT THIS ONE!!
ⓘ Source: listings_history table (triggers on properties + properties_extension) + one-shot
backfill from property_details.listing_events for pre-trigger history.
Climate risk First Street
- Flood 1/10 Low FEMA zone X (unshaded) · 0% chance over 30 yrs
- Wildfire 6/10 Major
- Heat 3/10 Moderate 8 d/yr ≥97°F today · 24 d/yr by 30 yrs out
- Wind 2/10 Low
- Air quality 1/10 Low 0 unhealthy d/yr today · 0 by 30 yrs out
Nearby sold comps map
Loading sold comps map…
Walkable amenities ~0.75 mi
Loading nearby amenities…
Taxation est. · year 1
- Rental income
- $12,146
- − Mortgage interest
- −$1,540
- − Property taxes
- −$412
- − Insurance
- −$138
- − Repairs & maintenance
- −$972
- − Management
- −$972
- − Depreciation
- −$800
- Taxable income
- $7,312
- Est. tax owed @ 24.0%
- −$1,755
- After-tax cash flow
- $5,560/yr
For passive investors: Depreciation is non-cash, so a rental often shows a tax loss while cash-flowing — sheltering income. Rental losses are passive: they offset passive income freely, and up to $25,000/yr can offset ordinary (W-2) income if you actively participate and your MAGI is under $100k (phasing out to $0 by $150k); unused losses carry forward. On sale, claimed depreciation is recaptured at up to 25%, and gains may owe capital-gains tax (a 1031 exchange can defer both). Figures are a year-1 estimate at your 24.0% rate — not tax advice; consult a CPA.
Condition & rehab AI · 12 photos
This property requires extensive renovations and repairs, including new siding, flooring, and appliances, to become a move-in-ready home with significant potential for resale and rental value.
Repairs flagged
- Major siding — Severe weathering and damage
- Major flooring — Worn-out and in need of replacement
- Major interior walls — Peeling paint and structural damage
- Major kitchen cabinets — Old and outdated
- Major bathroom fixtures — Old and possibly moldy
- Major roof — No visible damage, but potential issues
Value-add opportunities
- Both New siding — Improves curb appeal and value
- Both New flooring — Enhances interior aesthetics and value
- Both Paint job — Refreshes interior and exterior
- Both Kitchen appliances — Modernizes and increases value
- Both Bathroom fixtures — Enhances functionality and value
- Both Roof inspection and repair — Ensures structural integrity and value
Renovation cost estimate screening
| Repair item | Severity | Est. cost |
|---|---|---|
| siding · Severe weathering and damage | Major | $15,000–50,000 |
| flooring · Worn-out and in need of replacement | Major | $15,000–50,000 |
| interior walls · Peeling paint and structural damage | Major | $15,000–50,000 |
| kitchen cabinets · Old and outdated | Major | $15,000–50,000 |
| bathroom fixtures · Old and possibly moldy | Major | $15,000–50,000 |
| roof · No visible damage, but potential issues | Major | $15,000–50,000 |
| Total estimated repair cost · 6 items | $90,000–300,000 |
Value-add ROI direction
- Both New siding — Improves curb appeal and value ↑
- Both New flooring — Enhances interior aesthetics and value ↑
- Both Paint job — Refreshes interior and exterior ↑
- Both Kitchen appliances — Modernizes and increases value ↑
- Both Bathroom fixtures — Enhances functionality and value ↑
- Both Roof inspection and repair — Ensures structural integrity and value ↑
ⓘ Cost ranges are severity-bucket heuristics (US national rule-of-thumb). Get contractor quotes + a written scope before underwriting a rehab budget.
Schools (NCES district)
- District
- Lee County Public School District
- NCES district ID
- 5102190
- Math proficiency
- 53% ▼ -31.00%
- Reading proficiency
- 69% ▼ -9.00%
- Median HH income
- $31,356
- Composite
- 50.06/100
- National rank
- #1913
- State rank
- #62 of 131 in VA
Livability — Pennington Gap
- Score
- 62/100
- State rank
- #410
- US rank
- #17149
Category grades
Schools grade is shown separately in the Schools card above.
Census & demographics
- Population (ZIP)
- 6,379
Population outlook (Lee County) Hauer SSP2
- Today (2025)
- 22,861 people
- By 2030
- 21,701 · -5.1%
- By 2040
- 19,188 · -16.1%
- By 2050
- 16,619 · -27.3%
- By 2075
- 11,795 · -48.4%
- By 2100
- 8,290 · -63.7%
Race, ethnicity, and origin ACS 2023
- Neighborhood character
- Predominantly White (79%)
- Race & ethnicity
- White 79% Black 14% Hispanic / Latino 5% Two or more races 2%
- Common ancestry
- Serbian 1% Slovak 1% Romanian 1%
- Foreign-born
- 4% · Canada
- Languages at home
- 95% English-only · Spanish 4%
Political lean MEDSL · Lee
- 2024 margin
- Solid R (+72.0) · D 13.8% · R 85.8%
- 2008→2024 swing
- -43.8pp toward R · 2008: -28.2pp · 2024: -72.0pp
- All cycles
- 2024: R+72.0 2020: R+69.1 2016: R+63.2 2012: R+44.4 2008: R+28.2
Not yet ingested
- Civics
- —
Market trends
- HPI YoY
- ▲ 5.59%
- Current HPI
- 165.997
- Rent YoY
- —
- Metro
- —
- State GDP YoY
- ▲ 2.40%
- F500 in state
- 50
Industry mix (Fortune 500 HQ in VA)
| Industry | F500 HQs | Revenue |
|---|---|---|
| Aerospace / Defense | 4 | $236B |
|
||
| Technology / Defense | 3 | $32B |
|
||
| Financial Services | 2 | $176B |
|
||
| Utilities | 2 | $27B |
|
||
| Insurance | 2 | $25B |
|
||
| Technology | 2 | $15B |
|
||
Price history
-29.5% since first listed5 events — show timeline
- 2026-05-05 Relisted — TVRMLS
- 2026-04-30 Pending — TVRMLS
- 2026-04-30 Price Changed $27,500 TVRMLS
- 2026-03-27 Price Changed $31,000 TVRMLS
- 2026-01-15 Listed $39,000 TVRMLS
Cash-flow waterfall
monthlySold comps — $/sqft
last 12 mo · ≤1 miLoading sold comps…