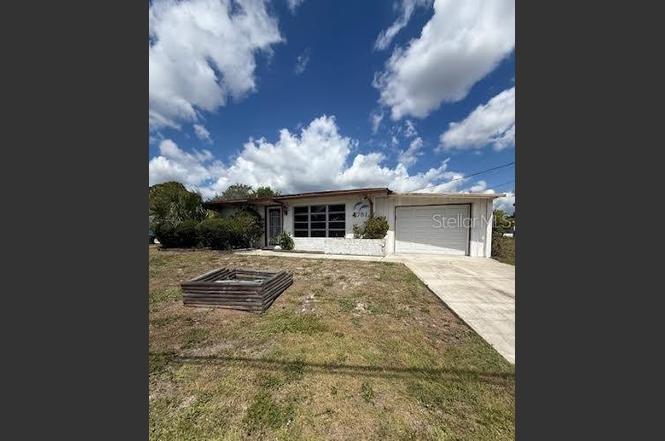
4751 S Biscayne Dr · North Port, FL
Flood risk 6/10 · Moderate
- FEMA flood zone
- X (unshaded)
- Chance of flooding over 30 yrs
- 0.66%
- Est. flood insurance / yr
- $507 – $1,088
Fire risk 5/10 · Moderate
- Est. fire insurance / yr
- $947 – $1,759
Heat risk 10/10 · Severe
- Hot days now (above 107°F)
- 7 days/yr
- Hot days in 30 yrs
- 29 days/yr
Wind risk 10/10 · Severe
- Chance of severe wind over 30 yrs
- 99.0%
Air-quality risk 2/10 · Minimal
- Unhealthy air days now
- 1 days/yr
- Unhealthy air days in 30 yrs
- 1 days/yr
Risk factors via First Street. Map © Google.
Why this score? — see what drove the C grade
The composite is a weighted blend of 9 inputs, each scored 0–100. Each bar is that input's sub-score; the figure is the points it added to the 100-point composite (weight × sub-score).
- Cash flow +22.0/30.0
- ARV discount +7.5/15.0
- DSCR +7.0/10.0
- Schools +5.4/10.0
- 1% rule +4.9/10.0
- Livability +3.8/5.0
- Rent growth +2.6/5.0
- Condition / age +2.5/5.0
- Appreciation +0.0/10.0
$174,900
🖨 Deal sheet 📄 Offer letter ✓ Due diligence
Listing remarks
Auction Property. Great opporitunuity with this charming 2 bedroom, 1 bath home on an extra large corner lot. Bring your creative ideas! Conveniently located near US41, shops, and restaurants.
Key facts
- Near restaurants
- Near shops
- 7,653 sq ft lot
Tags
Property features AI
Finance
- Other: Zoning: RSF3; Universal property ID available
- Financial info: No lease restrictions; Tax year 2025
- HOA & community: No HOA association indicated; Pets allowed
Exterior
- Parking: Attached garage (1 car)
- Utilities: Public water; Public sewer; Electricity available
- Home design: Single family residence; Residential property; One story; Faces southeast; Entry level: One
- Construction: Block construction; Shingle roof; Slab foundation; Building area about 1,685 square feet (public records); Living area about 1,175 square feet (public records)
- Exterior features: Paved road access; Lot approximately 0.18 acres (about 711 sq meters)
Interior
- Kitchen: No appliances included
- Bedrooms: 2 bedrooms
- Flooring: Other flooring
- Bathrooms: 1 full bathroom
- Heating & cooling: Central heating; Central air conditioning
- Interior features: Living room and dining room combined; 4 total rooms
- Laundry & utility: Laundry: Other
Neighborhood map
What this means for you Summary
Snapshot
- This is a 2-bed/1.0-bath single-family listed at $175k.
Deal economics
- At list price, monthly cash flow is $277 ($3k/yr) — positive.
- The deal already cash-flows at list — no discount required.
- To meet the 1% rule (rent ≥ 1% of price), the offer needs to be $173k (1.1% below list).
- Recommended offer: $173k (1.1% below list) — sets the bar for 1% rule.
- Cap rate 8.2% vs local median 3.6% in North Port — top-decile yield for the area; either an underpriced asset or a hidden risk that comps aren't pricing in. Stress-test before assuming the spread holds.
Location & tenants
- Location reads 75/100 on livability (#252 in FL, #3,975 nationally) — a middle-class / working-renter tenant base. Strengths: crime A+, housing A+, health & safety A+; Watch: amenities F, commute F.
- Sarasota (urban): math 63% / reading 63% proficiency, ranked #7 of 73 in FL (top 10%) — acceptable for families but not a draw, mixed tenant base, ~2y average lease.
- Market conditions: Rents flat; 852 active listings in the ZIP; 1 comparable units currently listed for rent nearby; 7,466 units permitted in Sarasota County in 2024 (2,138 in 5+ unit buildings).
- This rent runs 33% of the median local income ($63k/yr) — at the standard rent-burdened threshold; future hikes will face affordability resistance.
Forward outlook
- Local home prices are declining (-3.0%/yr); year-one equity from $1k of loan paydown is wiped out by about $5k of value loss. Plan a longer hold.
- Sarasota County population projected at +20% by 2050 — long-run rental-demand tailwind backs the buy-and-hold thesis.
Negotiation context
- Only 4 days on market — expect competitive offers; lowballing is unlikely to land.
- 8 sale attempts since 21y ago with the ask held roughly flat each time — persistent listings suggest the price (not the market) is what's stuck; bring a comps-based counter.
Risks & watch-outs
- Climate carrying-cost: major flood risk; severe wind risk, 99% chance of damaging wind over 30y; moderate wildfire risk; extreme-heat days projected 7→29/yr by 2055 (HVAC capex compounding) — expect insurance premiums to compound above CPI over the hold.
Questions for the listing agent
- Built in 1970 — when were the roof, HVAC, electrical panel, plumbing, and water heater last replaced?
- Is there a deadline driving the sale (1031 exchange, divorce, estate, relocation)? That informs how much negotiation room exists.
- Schools are B-rated — typically a magnet for longer-tenancy family renters. What's the average tenant stay here, and is there a school-zone premium baked into asking?
- What's the average days-on-market for RENTAL listings here right now (not sales)? A rising rental-DOM trend means longer vacancies and softer asking-rent achievability than the comps imply.
- What's the recent tenant-quality profile in this submarket — average credit score on applications, eviction rate, late-payment / NSF rate, and stable-employment percentage? A property-management company in the area should have these aggregated.
- How much new for-sale + rental construction is in the pipeline within 1–3 miles? Heavy new supply typically softens prices + rents 12–24 months out; constrained supply supports both.
Investment metrics
- 1% rule
- 0.99% ✗
- Cap rate
- 8.20%
- Cash-on-cash
- 6.80%
- DSCR
- 1.30
- GRM
- 8.4
CMA / ARV
No comps found within radius.
Projected returns pro-forma
-3.0% appreciation · 0.26% rent growth · sell at horizon
- IRR
- -8.8%
- Equity multiple
- 0.69×
- Total profit
- $-15,368
- Equity at exit
- $26,078
- IRR
- -3.0%
- Equity multiple
- 0.82×
- Total profit
- $-8,861
- Equity at exit
- $15,122
Cash invested: $48,972 (down + closing). Projections, not guarantees.
Landlord ↔ Tenant lean methodology
- Overall (STATE)
- 87 Strongly Landlord-Friendly
- State Florida
- 87 Strongly Landlord-Friendly · R+3
- County
- — inherits STATE
- City
- — inherits STATE
ZIP-level market 34287
- Home prices YoY
- -20.1%
- Rents YoY
- 0.3%
- Active inventory
- 852
- Price-to-rent
- 8.4×
Monthly cashflow live
- Estimated rent
- $1,730 medium interval (Pro) →
- Mortgage (P&I)
- −$917
- Tax from tax record
- −$99 /mo · $1,188/yr
- Insurance
- −$73
- HOA
- −$0
- Vacancy / Maint / Mgmt
- −$363
- Net cashflow
- $277
Break-even live
UW: 25.0% down · 7.5% · 30yr · 1.5% tax · 5.0% vac · 8.0% maint · 8.0% mgmt
Financing live
Cash to close
- Down payment
- $43,725
- Closing costs
- $5,247
- Reserves months
- —
- Total cash needed
- —
Loan-product check · same deal, 3 products live
Conventional
25% down · 7.5% · 30yr
- Down + closing
- —
- Monthly P&I
- —
- Monthly cashflow
- —
- DSCR
- —
- Eligible?
- —
Personal DTI + credit; lowest rate.
DSCR
20% down · 8.5% · 30yr
- Down + closing
- —
- Monthly P&I
- —
- Monthly cashflow
- —
- DSCR
- —
- Eligible?
- —
No personal income docs; deal must DSCR.
Hard money
10% down · 12.0% · 12mo
- Down + closing
- —
- Monthly P&I
- —
- Monthly cashflow
- —
- DSCR
- —
- Eligible?
- —
Short-term bridge; refi at stabilization.
Rent comps 1 comps
| Address | Beds | Baths | Sqft | Rent | $/sqft | DOM | Units | Dist |
|---|---|---|---|---|---|---|---|---|
| 12395 Chancellor Blvd Port Charlotte, FL | 2.0 | 1.0 | 1004 | $1,600 | $1.59 | 21d | 1 | 1.42mi |
Listing history 5 events
-
2026-06-18days on market $174,900 Active 4 DOM
-
2026-06-17days on market $174,900 Active 3 DOM
-
2026-06-16days on market $174,900 Active 2 DOM
-
2026-06-15remarks 192-char remark
-
2026-06-15$174,900 Active 1 DOM
ⓘ Source: listings_history table (triggers on properties + properties_extension) + one-shot
backfill from property_details.listing_events for pre-trigger history.
Tax reassessment forecast FL · Resets to sale price
- Current annual tax
- $1,188 · $99/mo
- Projected year-2 tax
- $1,452 · $121/mo
- Expected delta
- +$263/yr (+$22/mo · 22.2%)
ⓘ Screening estimate from a state-policy table — verify with the county assessor before closing.
Climate risk First Street
- Flood 6/10 Major FEMA zone X (unshaded) · 66% chance over 30 yrs
- Wildfire 5/10 Major
- Heat 10/10 Extreme 7 d/yr ≥107°F today · 29 d/yr by 30 yrs out
- Wind 10/10 Extreme 99% chance of damaging wind over 30 yrs
- Air quality 2/10 Low 1 unhealthy d/yr today · 1 by 30 yrs out
Nearby sold comps map
Loading sold comps map…
Walkable amenities ~0.75 mi
Loading nearby amenities…
Taxation est. · year 1
- Rental income
- $20,756
- − Mortgage interest
- −$9,797
- − Property taxes
- −$1,188
- − Insurance
- −$874
- − Repairs & maintenance
- −$1,660
- − Management
- −$1,660
- − Depreciation
- −$5,088
- Taxable income
- $487
- Est. tax owed @ 24.0%
- −$117
- After-tax cash flow
- $3,211/yr
For passive investors: Depreciation is non-cash, so a rental often shows a tax loss while cash-flowing — sheltering income. Rental losses are passive: they offset passive income freely, and up to $25,000/yr can offset ordinary (W-2) income if you actively participate and your MAGI is under $100k (phasing out to $0 by $150k); unused losses carry forward. On sale, claimed depreciation is recaptured at up to 25%, and gains may owe capital-gains tax (a 1031 exchange can defer both). Figures are a year-1 estimate at your 24.0% rate — not tax advice; consult a CPA.
Schools (NCES district)
- District
- Sarasota
- NCES district ID
- 1201680
- Math proficiency
- 63% ▼ -8.00%
- Reading proficiency
- 63% ▼ -3.00%
- Median HH income
- $51,167
- Composite
- 53.68/100
- National rank
- #1428
- State rank
- #7 of 73 in FL
Livability — North Port
- Score
- 75/100
- State rank
- #252
- US rank
- #3975
Category grades
Schools grade is shown separately in the Schools card above.
Census & demographics
- Census place
- North Port, FL
- County
- Sarasota County · 448,376 people
- City population
- 75,324
- Metro
- North Port-Sarasota-Bradenton, FL
- Population (ZIP)
- 25,929
- Household income
- $63,464
- Rent vs Own
- Severe rent burden
- 522.0
Population outlook (Sarasota County) Hauer SSP2
- Today (2025)
- 452,380 people
- By 2030
- 474,175 · +4.8%
- By 2040
- 511,577 · +13.1%
- By 2050
- 541,467 · +19.7%
- By 2075
- 604,947 · +33.7%
- By 2100
- 621,965 · +37.5%
Race, ethnicity, and origin ACS 2023
- Neighborhood character
- Predominantly White (77%)
- Race & ethnicity
- White 77% Hispanic / Latino 14% Two or more races 7% Asian 4% Black 3%
- Hispanic origin (detail)
- Mexican 2% Puerto Rican 3% Cuban 3% Dominican 1%
- Common ancestry
- Romanian 4% Scotch-Irish 3% Lithuanian 3%
- Foreign-born
- 16% · Canada, Philippines
- Languages at home
- 81% English-only · Spanish 8% Russian/Polish/Slavic 5% French/Haitian/Cajun 2%
Political lean MEDSL · Sarasota
- 2024 margin
- R (+18.2) · D 40.5% · R 58.7%
- 2008→2024 swing
- -18.1pp toward R · 2008: -0.1pp · 2024: -18.2pp
- All cycles
- 2024: R+18.2 2020: R+10.4 2016: R+11.6 2012: R+7.4 2008: R+0.1
Not yet ingested
- Civics
- —
Market trends
- HPI YoY
- ▼ -70.89%
- Current HPI
- 280.8484
- Rent YoY
- ▲ 0.26%
- Metro
- North Port-Sarasota-Bradenton, FL
- State GDP YoY
- ▲ 3.28%
- F500 in state
- 36
Industry mix (Fortune 500 HQ in FL)
| Industry | F500 HQs | Revenue |
|---|---|---|
| Industrial Technology | 2 | $29B |
|
||
| Insurance | 2 | $17B |
|
||
| Retail | 1 | $60B |
|
||
| Technology Distribution | 1 | $58B |
|
||
| Homebuilding | 1 | $35B |
|
||
| Technology Manufacturing | 1 | $35B |
|
||
Price history
+288.7% since first listed37 events — show timeline
- 2026-06-15 Listed $174,900 Stellar MLS as Distributed by MLS Grid
- 2025-11-18 Listing Removed — Stellar MLS as Distributed by MLS Grid
- 2025-11-07 Listed $190,000 Stellar MLS as Distributed by MLS Grid
- 2024-07-29 Listing Removed — Stellar MLS as Distributed by MLS Grid
- 2024-05-28 Price Changed $190,000 Stellar MLS as Distributed by MLS Grid
- 2024-01-01 Relisted — Stellar MLS as Distributed by MLS Grid
- 2023-12-30 Listing Removed — Stellar MLS as Distributed by MLS Grid
- 2023-09-09 Price Changed $237,000 Stellar MLS as Distributed by MLS Grid
- 2023-08-02 Price Changed $197,000 Stellar MLS as Distributed by MLS Grid
- 2023-07-28 Price Changed $199,000 Stellar MLS as Distributed by MLS Grid
- 2023-07-28 Price Changed $214,000 Stellar MLS as Distributed by MLS Grid
- 2023-07-18 Relisted — Stellar MLS as Distributed by MLS Grid
- 2023-07-18 Price Changed $217,000 Stellar MLS as Distributed by MLS Grid
- 2023-06-30 Listing Removed — Stellar MLS as Distributed by MLS Grid
- 2023-05-27 Price Changed $235,000 Stellar MLS as Distributed by MLS Grid
- 2023-05-02 Price Changed $271,000 Stellar MLS as Distributed by MLS Grid
- 2023-04-24 Price Changed $253,000 Stellar MLS as Distributed by MLS Grid
- 2023-04-07 Price Changed $350,000 Stellar MLS as Distributed by MLS Grid
- 2023-04-07 Price Changed $295,000 Stellar MLS as Distributed by MLS Grid
- 2023-01-03 Price Changed $350,000 Stellar MLS as Distributed by MLS Grid
- 2022-11-24 Listed $325,000 Stellar MLS as Distributed by MLS Grid
- 2022-10-12 Listing Removed — Stellar MLS as Distributed by MLS Grid
- 2022-10-02 Relisted — Stellar MLS as Distributed by MLS Grid
- 2022-08-24 Price Changed $270,000 Stellar MLS as Distributed by MLS Grid
- 2022-07-29 Price Changed $1,930 RENT.
- 2022-07-03 Price Changed $260,000 Stellar MLS as Distributed by MLS Grid
- 2022-06-29 Price Changed $256,000 Stellar MLS as Distributed by MLS Grid
- 2022-06-16 Price Changed $253,000 Stellar MLS as Distributed by MLS Grid
- 2022-06-12 Price Changed $254,000 Stellar MLS as Distributed by MLS Grid
- 2022-06-10 Price Changed $265,000 Stellar MLS as Distributed by MLS Grid
- 2022-05-19 Price Changed $289,000 Stellar MLS as Distributed by MLS Grid
- 2022-04-12 Listed $295,000 Stellar MLS as Distributed by MLS Grid
- 2005-11-30 Sold (Public Records) $170,400 Public Records
- 2005-11-23 Sold (MLS) $164,000 Stellar MLS as Distributed by MLS Grid
- 2005-08-16 Listed $164,900 Stellar MLS as Distributed by MLS Grid
- 2001-03-12 Sold (Public Records) $59,900 Public Records
- 1994-08-17 Sold (Public Records) $45,000 Public Records
Property tax history
+5.1%/yrLatest (2025): $1,188 · +8.8% YoY. Source: county tax records.
Cash-flow waterfall
monthlySold comps — $/sqft
last 12 mo · ≤1 miLoading sold comps…