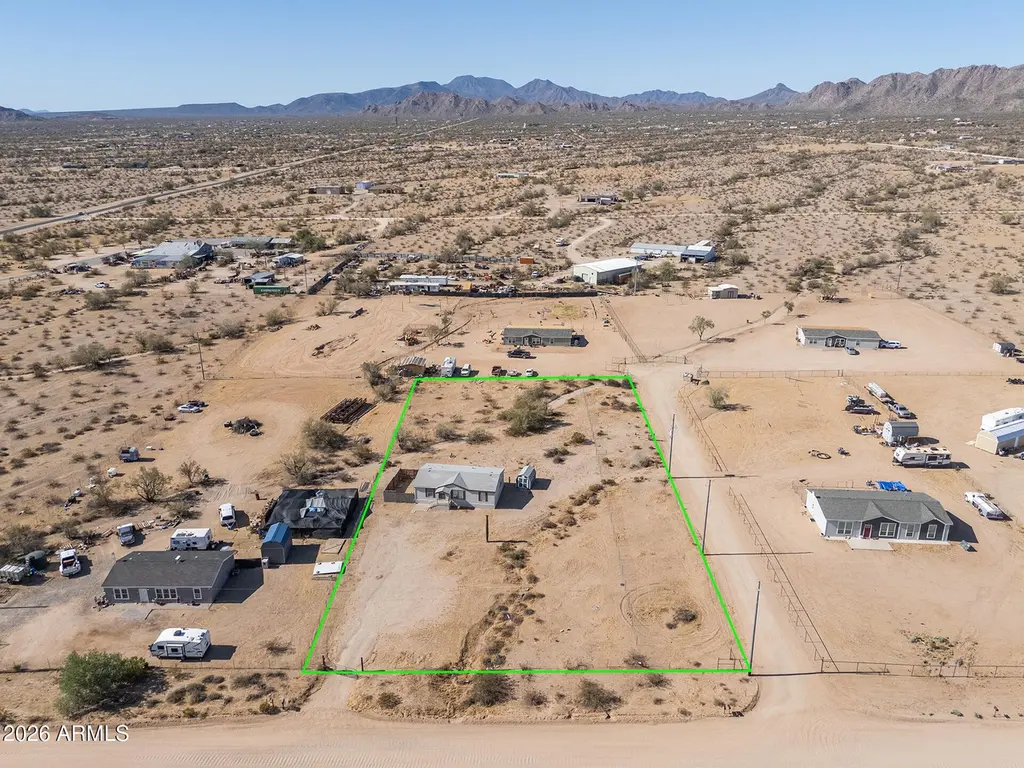
52989 W Century Rd · Ak-Chin Village, AZ
Flood risk 1/10 · Minimal
- FEMA flood zone
- X (unshaded)
- Chance of flooding over 30 yrs
- 0.0%
- Est. flood insurance / yr
- $507 – $1,088
Fire risk 6/10 · Moderate
- Est. fire insurance / yr
- $610 – $1,132
Heat risk 9/10 · Severe
- Hot days now (above 114°F)
- 7 days/yr
- Hot days in 30 yrs
- 18 days/yr
Wind risk 1/10 · Minimal
- Chance of severe wind over 30 yrs
- —
Air-quality risk 2/10 · Minimal
- Unhealthy air days now
- 1 days/yr
- Unhealthy air days in 30 yrs
- 1 days/yr
Risk factors via First Street. Map © Google.
Why this score? — see what drove the C- grade
The composite is a weighted blend of 9 inputs, each scored 0–100. Each bar is that input's sub-score; the figure is the points it added to the 100-point composite (weight × sub-score).
- Cash flow +20.1/30.0
- ARV discount +15.0/15.0
- DSCR +6.4/10.0
- 1% rule +4.0/10.0
- Livability +2.5/5.0
- Condition / age +2.5/5.0
- Rent growth +2.0/5.0
- Schools +1.5/10.0
- Appreciation +0.0/10.0
$220,000
🖨 Deal sheet (PDF) 📄 Offer letter ✓ Due diligence
Listing remarks MLS
This 1345 sq ft home is ready to move in! Recently renovated inside and out! Interior and Exterior features include New Paint, New Quartz Countertops, New Vinyl Flooring Throughout, New SS Appliances, New Blinds, New Fixtures, Block Skirting and much much more! Also all new well equipment including pump. Close to the future I-11 corridor. Don't miss your chance to see this home today! Please note legal description is not correct as parent parcel is being divided. MLD Survey in documents tab and to be recorded prior to close of escrow. Parcel home is on to be 1.254 acres. Legal description to be: "A PARCEL OF LAND LOCATED IN THE NORTHEAST QUARTER OF SECTION 22, TOWNSHIP 6 SOUTH RANGE 2 EAST OF THE GILA AND SALT RIVER BASE AND MERIDIAN, PINAL COUNTY, ARIZONA MORE PARTICULARLY DESCRIBED AS FOLLOWS: THE NORTH 331.09 FEET OF THE WEST HALF OF THE EAST HALF OF LOT 7 OF "HIDDEN VALLEY HILLS", ACCORDING TO THE PLAT OF RECORD IN THE OFFICE OF THE COUNTY RECORDER OF PINAL COUNTY ARIZONA, IN BOOK 9 OF MAPS, PAGE 23."
Key facts
- Outdoor recreation
- Wide-open space
- Expansive property
Tags
Property features AI
Finance
- Other:
- Financial info:
- HOA & community: No association fees
Exterior
- Parking:
- Security:
- Utilities: Shared well for water; Septic system connected
- Home design: Manufactured / mobile home; Fee simple ownership
- Construction: Wood siding; Wood frame construction; Composition roof
- Exterior features: Partial fencing; Natural desert front; Natural desert back; Mountain views; Horses allowed
Interior
- Kitchen: Eat-in kitchen; Breakfast bar
- Bedrooms: 3 possible bedrooms
- Flooring: Carpet; Linoleum
- Bathrooms: 2 full bathrooms
- Heating & cooling: Electric heating; Central air; Ceiling fans
- Interior features: Eat-in kitchen; Breakfast bar; Full bathroom in master bedroom; Separate shower and tub
- Laundry & utility: Indoor laundry; Washer/dryer hookups only
Neighborhood map
What this means for you Summary
Snapshot
- This is a 3-bed/2.0-bath manufactured listed at $220k.
Deal economics
- At list price, monthly cash flow is $272 ($3k/yr) — positive.
- The deal already cash-flows at list — no discount required.
- To meet the 1% rule (rent ≥ 1% of price), the offer needs to be $198k (10.2% below list).
- Recommended offer: $198k (10.2% below list) — sets the bar for 1% rule.
- Cap rate 7.8% vs local median 3.2% in Ak-Chin Village — top-decile yield for the area; either an underpriced asset or a hidden risk that comps aren't pricing in. Stress-test before assuming the spread holds.
Location & tenants
- Location reads: area grade C — affects rentability + tenant quality, not the cash-flow math above.
- Casa Grande Union High School District (4453) (suburban): math 14% / reading 21% proficiency, ranked #193 of 249 in AZ (top 78%) — low school quality limits family demand, transient renter base, plan for 1-2y turnover.
- Zoned schools: Stanfield Elementary School (math 14% / reading 17%, grade F, #864 of 1,109 statewide, top 78%, 403 students, 85% FRL); Vista Grande High School (math 10% / reading 16%, grade F, #279 of 381 statewide, top 73%, 1,790 students, 54% FRL).
- Market conditions: Rents soft (-2.1%/yr); 425 active listings in the ZIP; 1 comparable units currently listed for rent nearby; solid renter incomes; 9,504 units permitted in Pinal County in 2024 (776 in 5+ unit buildings).
Forward outlook
- Local home prices are declining (-3.0%/yr); year-one equity from $2k of loan paydown is wiped out by about $7k of value loss. Plan a longer hold.
Negotiation context
- It's been on market 15 days — a 2% lower offer ($217k) is reasonable based on typical stale-listing flexibility.
- 8 sale attempts since 20y ago with the ask held roughly flat each time — persistent listings suggest the price (not the market) is what's stuck; bring a comps-based counter.
Risks & watch-outs
- Climate carrying-cost: major wildfire risk; extreme-heat days projected 7→18/yr by 2055 (HVAC capex compounding) — expect insurance premiums to compound above CPI over the hold.
Questions for the listing agent
- Is there a deadline driving the sale (1031 exchange, divorce, estate, relocation)? That informs how much negotiation room exists.
- What's the average days-on-market for RENTAL listings here right now (not sales)? A rising rental-DOM trend means longer vacancies and softer asking-rent achievability than the comps imply.
- What's the recent tenant-quality profile in this submarket — average credit score on applications, eviction rate, late-payment / NSF rate, and stable-employment percentage? A property-management company in the area should have these aggregated.
- How much new for-sale + rental construction is in the pipeline within 1–3 miles? Heavy new supply typically softens prices + rents 12–24 months out; constrained supply supports both.
Investment metrics
- 1% rule
- 0.90% ✗
- Cap rate
- 7.78%
- Cash-on-cash
- 5.30%
- DSCR
- 1.24
- GRM
- 9.3
CMA / ARV
- ARV (on-the-fly)
- $407,232
- Comps found
- 1
Show comp detail 1 sale within ~0.75 mi
| Address | Dist | Beds/Ba | Sqft | Sold | Price | $/sf | Match |
|---|---|---|---|---|---|---|---|
| 53040 W Whirly Bird Rd | 0.39mi | 3/2.0 | 1,404 (+4%) | 1mo | $425,000 | $303 | 74 |
Match score weights: distance 35% · size 25% · config 20% · recency 20%. Top-matched comps best support the ARV.
Projected returns pro-forma
-3.0% appreciation · 0.0% rent growth · sell at horizon
- IRR
- -11.1%
- Equity multiple
- 0.61×
- Total profit
- $-24,239
- Equity at exit
- $32,803
- IRR
- -6.2%
- Equity multiple
- 0.65×
- Total profit
- $-21,651
- Equity at exit
- $19,022
Cash invested: $61,600 (down + closing). Projections, not guarantees.
Landlord ↔ Tenant lean methodology
- Overall (STATE)
- 87 Strongly Landlord-Friendly
- State Arizona
- 87 Strongly Landlord-Friendly · R+3
- County
- — inherits STATE
- City
- — inherits STATE
ZIP-level market 85139
- Home prices YoY
- -17.4%
- Rents YoY
- -2.1%
- Active inventory
- 425
- Price-to-rent
- 9.3×
Monthly cashflow live
- Estimated rent
- $1,976 medium interval (Pro) →
- Mortgage (P&I)
- −$1,154
- Tax from tax record
- −$44 /mo · $530/yr
- Insurance
- −$92
- HOA
- −$0
- Vacancy / Maint / Mgmt
- −$415
- Net cashflow
- $272
Break-even live
Sensitivity live
| Price | -10% $396 | -5% $334 | +0% $272 | +5% $210 | +10% $147 |
|---|---|---|---|---|---|
| Rent | -10% $116 | -5% $194 | +0% $272 | +5% $350 | +10% $428 |
| Rate | -1.0pp $383 | -0.5pp $328 | base $272 | +0.5pp $215 | +1.0pp $157 |
UW: 25.0% down · 7.5% · 30yr · 1.5% tax · 5.0% vac · 8.0% maint · 8.0% mgmt
Financing live
Cash to close
- Down payment
- $55,000
- Closing costs
- $6,600
- Reserves months
- —
- Total cash needed
- —
Loan-product check · same deal, 3 products live
Conventional
25% down · 7.5% · 30yr
- Down + closing
- —
- Monthly P&I
- —
- Monthly cashflow
- —
- DSCR
- —
- Eligible?
- —
Personal DTI + credit; lowest rate.
DSCR
20% down · 8.5% · 30yr
- Down + closing
- —
- Monthly P&I
- —
- Monthly cashflow
- —
- DSCR
- —
- Eligible?
- —
No personal income docs; deal must DSCR.
Hard money
10% down · 12.0% · 12mo
- Down + closing
- —
- Monthly P&I
- —
- Monthly cashflow
- —
- DSCR
- —
- Eligible?
- —
Short-term bridge; refi at stabilization.
Rent comps 1 comps
| Address | Beds | Baths | Sqft | Rent | $/sqft | DOM | Units | Dist |
|---|---|---|---|---|---|---|---|---|
| 53713 W Pampas Grass Rd Maricopa, AZ | 4.0 | 2.0 | 1580 | $2,200 | $1.39 | 3d | 1 | 0.63mi |
Listing history 11 events
-
2026-06-21days on market $220,000 Active 15 DOM
-
2026-06-18days on market $220,000 Active 12 DOM
-
2026-06-17days on market $220,000 Active 11 DOM
-
2026-06-16days on market $220,000 Active 10 DOM
-
2026-06-15days on market $220,000 Active 9 DOM
-
2026-06-13days on market $220,000 Active 7 DOM
-
2026-06-13days on market $220,000 Active 6 DOM
-
2026-06-09days on market $220,000 Active 3 DOM
-
2026-06-08days on market $220,000 Active 2 DOM
-
2026-06-07remarks 479-char remark
-
2026-06-07$220,000 Active 1 DOM
ⓘ Source: listings_history table (triggers on properties + properties_extension) + one-shot
backfill from property_details.listing_events for pre-trigger history.
Tax reassessment forecast AZ · Resets to sale price
- Current annual tax
- $530 · $44/mo
- Projected year-2 tax
- $1,452 · $121/mo
- Expected delta
- +$922/yr (+$77/mo · 174.2%)
ⓘ Screening estimate from a state-policy table — verify with the county assessor before closing.
Climate risk First Street
- Flood 1/10 Low FEMA zone X (unshaded) · 0% chance over 30 yrs
- Wildfire 6/10 Major
- Heat 9/10 Extreme 7 d/yr ≥114°F today · 18 d/yr by 30 yrs out
- Wind 1/10 Low
- Air quality 2/10 Low 1 unhealthy d/yr today · 1 by 30 yrs out
Nearby sold comps map
Loading sold comps map…
Walkable amenities ~0.75 mi
Loading nearby amenities…
Taxation est. · year 1
- Rental income
- $23,717
- − Mortgage interest
- −$12,323
- − Property taxes
- −$530
- − Insurance
- −$1,100
- − Repairs & maintenance
- −$1,897
- − Management
- −$1,897
- − Depreciation
- −$6,400
- Taxable loss
- −$431
- Est. tax savings @ 24.0%
- +$103
- After-tax cash flow
- $3,366/yr
For passive investors: Depreciation is non-cash, so a rental often shows a tax loss while cash-flowing — sheltering income. Rental losses are passive: they offset passive income freely, and up to $25,000/yr can offset ordinary (W-2) income if you actively participate and your MAGI is under $100k (phasing out to $0 by $150k); unused losses carry forward. On sale, claimed depreciation is recaptured at up to 25%, and gains may owe capital-gains tax (a 1031 exchange can defer both). Figures are a year-1 estimate at your 24.0% rate — not tax advice; consult a CPA.
Schools (NCES district)
- District
- Casa Grande Union High School District (4453)
- NCES district ID
- 0401740
- Math proficiency
- 14% ▼ -15.00%
- Reading proficiency
- 21% ▼ -10.00%
- Median HH income
- $45,373
- Composite
- 15.38/100
- National rank
- #9319
- State rank
- #193 of 249 in AZ
Livability — Ak-Chin Village
No livability data for this city. (Only ~50 U.S. cities are tracked.)
Census & demographics
- County
- Pinal County · 399,947 people
- Metro
- Phoenix-Mesa-Chandler, AZ
- Population (ZIP)
- 20,784
- Household income
- $86,894
- Rent vs Own
- Severe rent burden
- 272.0
Population outlook (Pinal County) Hauer SSP2
- Today (2025)
- 437,574 people
- By 2030
- 446,903 · +2.1%
- By 2040
- 452,589 · +3.4%
- By 2050
- 444,126 · +1.5%
- By 2075
- 430,300 · -1.7%
- By 2100
- 393,536 · -10.1%
Race, ethnicity, and origin ACS 2023
- Neighborhood character
- Diverse neighborhood (Simpson 0.68)
- Race & ethnicity
- White 48% Hispanic / Latino 28% Two or more races 13% Black 9% Native American 8% Asian 2%
- Hispanic origin (detail)
- Mexican 25%
- Common ancestry
- Portuguese 2% Lithuanian 2% Italian 2%
- Foreign-born
- 10% · Canada
- Languages at home
- 80% English-only · Spanish 17% Vietnamese 1% Other Asian/Pacific 0%
Political lean MEDSL · Pinal
- 2024 margin
- Strong R (+22.1) · D 38.5% · R 60.6%
- 2008→2024 swing
- -7.6pp toward R · 2008: -14.5pp · 2024: -22.1pp
- All cycles
- 2024: R+22.1 2020: R+17.3 2016: R+19.3 2012: R+17.1 2008: R+14.5
Not yet ingested
- Civics
- —
Market trends
- HPI YoY
- ▼ -66.22%
- Current HPI
- 313.8539
- Rent YoY
- ▼ -2.10%
- Metro
- Phoenix-Mesa-Chandler, AZ
- State GDP YoY
- ▲ 4.54%
- F500 in state
- 20
Industry mix (Fortune 500 HQ in AZ)
| Industry | F500 HQs | Revenue |
|---|---|---|
| Technology | 2 | $13B |
|
||
| Mining / Metals | 1 | $23B |
|
||
| Environmental Services | 1 | $16B |
|
||
| Metals / Steel | 1 | $14B |
|
||
| Technology Distribution | 1 | $9B |
|
||
| Homebuilding | 1 | $8B |
|
||
Price history
+3900.0% since first listed22 events — show timeline
- 2026-06-06 Listed $220,000 ARMLS
- 2022-02-18 Sold (MLS) $264,900 ARMLS
- 2022-02-16 Sold (Public Records) $264,990 Public Records
- 2022-01-16 Contingent — ARMLS
- 2021-11-22 Listed $264,900 ARMLS
- 2020-12-24 Sold (Public Records) $905,000 Public Records
- 2013-03-04 Sold (MLS) $30,600 ARMLS
- 2013-01-26 Pending — ARMLS
- 2013-01-26 Relisted — ARMLS
- 2013-01-11 Pending — ARMLS
- 2013-01-10 Relisted — ARMLS
- 2013-01-10 Price Changed $30,600 ARMLS
- 2013-01-02 Pending — ARMLS
- 2012-11-29 Listed $34,000 ARMLS
- 2008-02-28 Listing Removed — ARMLS
- 2007-07-18 Listed $199,900 ARMLS
- 2007-06-30 Listing Removed — ARMLS
- 2007-01-22 Listed $199,900 ARMLS
- 2007-01-11 Listing Removed — ARMLS
- 2006-11-06 Listed $299,000 ARMLS
- 2001-10-22 Sold (Public Records) $93,500 Public Records
- 1998-03-17 Sold (Public Records) $5,500 Public Records
Property tax history
-2.1%/yrLatest (2021): $530 · -8.7% YoY. Source: county tax records.
Cash-flow waterfall
monthlySold comps — $/sqft
last 12 mo · ≤1 miLoading sold comps…