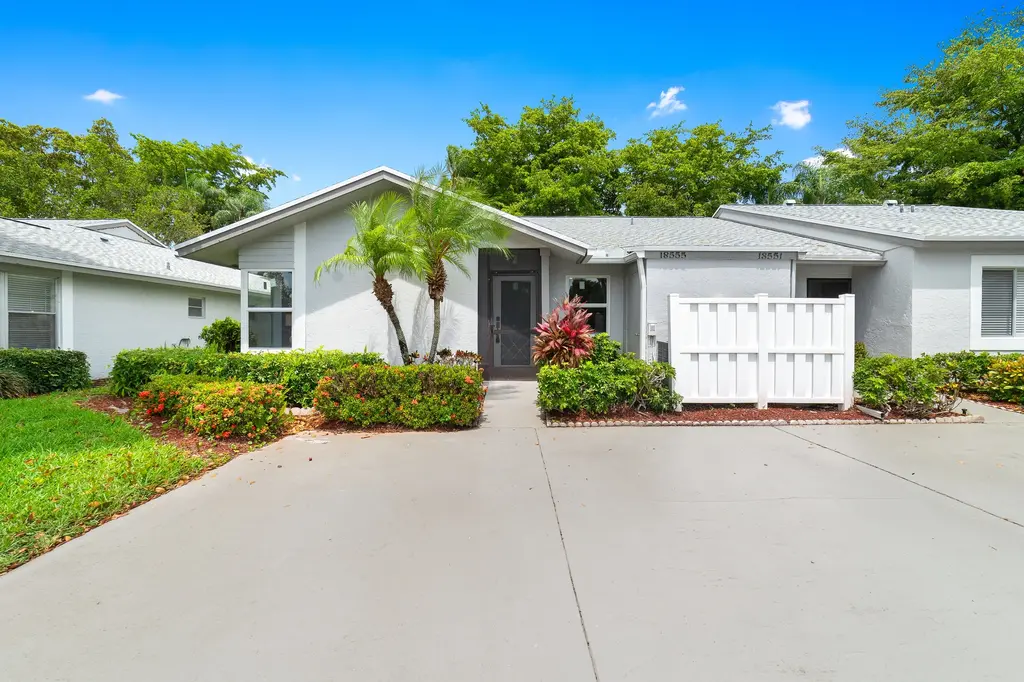
18555 Egret Way · Boca Raton, FL
Flood risk 1/10 · Minimal
- FEMA flood zone
- X (unshaded)
- Chance of flooding over 30 yrs
- 0.0%
- Est. flood insurance / yr
- $507 – $1,088
Fire risk 1/10 · Minimal
- Est. fire insurance / yr
- $947 – $1,759
Heat risk 9/10 · Severe
- Hot days now (above 107°F)
- 7 days/yr
- Hot days in 30 yrs
- 25 days/yr
Wind risk 10/10 · Severe
- Chance of severe wind over 30 yrs
- 99.0%
Air-quality risk 2/10 · Minimal
- Unhealthy air days now
- 2 days/yr
- Unhealthy air days in 30 yrs
- 2 days/yr
Risk factors via First Street. Map © Google.
Why this score? — see what drove the D grade
The composite is a weighted blend of 9 inputs, each scored 0–100. Each bar is that input's sub-score; the figure is the points it added to the 100-point composite (weight × sub-score).
- Appreciation +10.0/10.0
- ARV discount +7.5/15.0
- Cash flow +6.4/30.0
- Schools +4.3/10.0
- Livability +3.9/5.0
- Rent growth +3.1/5.0
- Condition / age +2.5/5.0
- 1% rule +2.2/10.0
- DSCR +0.7/10.0
$360,000
🖨 Deal sheet 📄 Offer letter ✓ Due diligence
Listing remarks MLS
Located in the popular Whisper Walk community, this bright and airy 2-bed/2-bath home offers vaulted ceilings, all-tile floors, and a covered screened patio off the living room. Newer Kitchen with Stainless Steel Appliances and Granite Countertops plus an interior laundry room. The active 55+ gated community features an amazing clubhouse, fitness center, pool, spa, exercise paths, 11 lakes, and lush landscaping. With two private parking spots, a Two-Year-Old Roof, fresh exterior paint, and a price below market value, this is a must-see.
Key facts
- Custom cabinetry
- Tile flooring
- Custom finishes
Tags
Property features AI
Finance
- Financial info: Pets not allowed
- HOA & community: Monthly association fee; Association fee covers common areas, cable TV, internet, pool(s), recreation facilities, security, trash and water; Community amenities include pool and tennis courts; Senior community
Exterior
- Parking: Assigned parking; Two or more parking spaces
- Security: Security guard; Security/high-impact doors
- Utilities: Water included in association fee; Trash included in association fee; Cable TV and Internet included in association fee; Electric service (central systems)
- Home design: Single-story property; Resale construction; Attached property; Entry at level 1
- Construction: Block construction
- Exterior features: Security/high-impact doors; Association pool; Tennis courts; Security guard
Interior
- Kitchen: Electric range; Microwave; Refrigerator; Breakfast area
- Bedrooms: Primary bedroom on main level; Additional bedroom(s) on main level
- Flooring: Tile flooring
- Bathrooms: 2 full bathrooms
- Heating & cooling: Central electric heating; Central electric cooling (central air)
- Interior features: Impact glass windows; Vaulted ceilings; Entrance foyer; Breakfast area; Living/dining room; Split bedroom floorplan; Walk-in closets; Main-level primary bedroom; Bedroom on main level
- Laundry & utility: Washer; Dryer; Utility room; Storage room
Neighborhood map
What this means for you Summary
Snapshot
- This is a 2-bed/2.0-bath condo listed at $360k.
Deal economics
- At list price, monthly cash flow is $-625 ($-7k/yr) — negative.
- To cash-flow at today's rent, offer at most $250k (30.7% below list).
- To meet the 1% rule (rent ≥ 1% of price), the offer needs to be $258k (28.3% below list).
- Recommended offer: $250k (30.7% below list) — sets the bar for cash-flow.
- Cap rate 4.2% vs local median 2.8% in Boca Raton — top-decile yield for the area; either an underpriced asset or a hidden risk that comps aren't pricing in. Stress-test before assuming the spread holds.
Location & tenants
- Location reads 77/100 on livability (#192 in FL, #3,070 nationally) — a middle-class / working-renter tenant base. Strengths: schools A+, employment A+, health & safety A+; Watch: amenities D, cost of living F.
- Palm Beach (suburban): math 46% / reading 53% proficiency, ranked #34 of 73 in FL (top 47%) — families likely to look elsewhere, expect single-tenant / working-renter base with shorter leases.
- Market conditions: Rents rising (+2.3%/yr); 324 active listings in the ZIP; 40 comparable units currently listed for rent nearby; rentals at typical pace (median 24d on market — plan ~3-4 weeks tenant-placement turnaround); high-income renter base; 3,974 units permitted in Palm Beach County in 2024 (1,012 in 5+ unit buildings).
Forward outlook
- In year one you build about $38k of equity ($2k loan paydown + $36k appreciation (10.0% local appreciation)).
- Palm Beach County population projected at +30% by 2050 — long-run rental-demand tailwind backs the buy-and-hold thesis.
- By year 2, paydown + projected appreciation supports a ~$62k cash-out refi (75% LTV) — recoverable capital for the next deal without selling this one.
Negotiation context
- It's been on market 15 days — a 2% lower offer ($355k) is reasonable based on typical stale-listing flexibility.
- 3 sale attempts since 28y ago with the ask held roughly flat each time — persistent listings suggest the price (not the market) is what's stuck; bring a comps-based counter.
- Current owner paid $187k; list at $360k implies a 93% gain — meaningful room to come down on a strong offer.
Risks & watch-outs
- Watch-outs: HOA is 22% of rent.
- Climate carrying-cost: severe wind risk, 99% chance of damaging wind over 30y; extreme-heat days projected 7→25/yr by 2055 (HVAC capex compounding) — expect insurance premiums to compound above CPI over the hold.
Questions for the listing agent
- What do current leases actually rent for vs. the listed asking? Can we see a recent rent roll and the last 12 months of T-12 income?
- What does the HOA fee cover, when was the last increase, and are there any pending special assessments or reserve-fund shortfalls?
- Any open or pending special assessments — roof, HVAC, plumbing, elevator, façade? What's the per-unit balance and payoff schedule, and is the seller paying it off at close or rolling it to the buyer?
- Is there a deadline driving the sale (1031 exchange, divorce, estate, relocation)? That informs how much negotiation room exists.
- Schools are A-rated — typically a magnet for longer-tenancy family renters. What's the average tenant stay here, and is there a school-zone premium baked into asking?
- The area grade is low — what's the realistic commute time and amenity access for the typical tenant pool here? Any planned neighborhood developments (good or bad) we should know about?
- What's the average days-on-market for RENTAL listings here right now (not sales)? A rising rental-DOM trend means longer vacancies and softer asking-rent achievability than the comps imply.
- What's the recent tenant-quality profile in this submarket — average credit score on applications, eviction rate, late-payment / NSF rate, and stable-employment percentage? A property-management company in the area should have these aggregated.
- How much new apartment / multifamily construction is in the pipeline within 1–3 miles? Heavy new supply (>2% of stock underway) typically softens rents 12–24 months out; light construction supports rent growth.
Investment metrics
- 1% rule
- 0.72% ✗
- Cap rate
- 4.21%
- Cash-on-cash
- -7.44%
- DSCR
- 0.67
- GRM
- 11.6
CMA / ARV
No comps found within radius.
Projected returns pro-forma
10.0% appreciation · 2.31% rent growth · sell at horizon
- IRR
- 18.9%
- Equity multiple
- 2.53×
- Total profit
- $154,643
- Equity at exit
- $324,317
- IRR
- 17.3%
- Equity multiple
- 5.80×
- Total profit
- $483,470
- Equity at exit
- $699,401
Cash invested: $100,800 (down + closing). Projections, not guarantees.
Landlord ↔ Tenant lean methodology
- Overall (STATE)
- 87 Strongly Landlord-Friendly
- State Florida
- 87 Strongly Landlord-Friendly · R+3
- County
- — inherits STATE
- City
- — inherits STATE
ZIP-level market 33496
- Home prices YoY
- 3.5%
- Rents YoY
- 2.3%
- Active inventory
- 324
- Price-to-rent
- 11.6×
Monthly cashflow live
- Estimated rent
- $2,580 high interval (Pro) →
- Mortgage (P&I)
- −$1,888
- Tax from tax record
- −$67 /mo · $806/yr
- Insurance
- −$150
- HOA
- −$558
- Vacancy / Maint / Mgmt
- −$542
- Net cashflow
- $-625
Break-even live
UW: 25.0% down · 7.5% · 30yr · 1.5% tax · 5.0% vac · 8.0% maint · 8.0% mgmt
Financing live
Cash to close
- Down payment
- $90,000
- Closing costs
- $10,800
- Reserves months
- —
- Total cash needed
- —
Loan-product check · same deal, 3 products live
Conventional
25% down · 7.5% · 30yr
- Down + closing
- —
- Monthly P&I
- —
- Monthly cashflow
- —
- DSCR
- —
- Eligible?
- —
Personal DTI + credit; lowest rate.
DSCR
20% down · 8.5% · 30yr
- Down + closing
- —
- Monthly P&I
- —
- Monthly cashflow
- —
- DSCR
- —
- Eligible?
- —
No personal income docs; deal must DSCR.
Hard money
10% down · 12.0% · 12mo
- Down + closing
- —
- Monthly P&I
- —
- Monthly cashflow
- —
- DSCR
- —
- Eligible?
- —
Short-term bridge; refi at stabilization.
Rent comps 40 comps
| Address | Beds | Baths | Sqft | Rent | $/sqft | DOM | Units | Dist |
|---|---|---|---|---|---|---|---|---|
| 18595 Egret Way #18595 Boca Raton, FL | 2.0 | 2.0 | 1000 | $2,200 | $2.20 | 24d | 1 | 0.03mi |
| 18765 Candlewick Dr Boca Raton, FL | 2.0 | 2.0 | 863 | $2,300 | $2.67 | 24d | 1 | 0.11mi |
| 18855 Candlewick Dr Boca Raton, FL | 2.0 | 2.0 | 1022 | $2,600 | $2.54 | 24d | 1 | 0.12mi |
| 18890 Candlewick Dr Unit B Boca Raton, FL | 2.0 | 2.0 | 1044 | $2,600 | $2.49 | 24d | 1 | 0.12mi |
| 9708 Erica Ct Boca Raton, FL | 2.0 | 2.0 | 1410 | $4,800 | $3.40 | 24d | 1 | 0.22mi |
| 9104 Affirmed Ln Boca Raton, FL | 3.0 | 2.0 | 1266 | $3,210 | $2.54 | 1d | 1 | 0.29mi |
| 18730 Stewart Cir #5 Boca Raton, FL | 2.0 | 2.0 | 1227 | $2,500 | $2.04 | 24d | 1 | 0.32mi |
| 8664 Jasmine Way Boca Raton, FL | 2.0 | 2.0 | 1162 | $1,795 | $1.54 | 24d | 1 | 0.33mi |
| 8705 Via Giula #4 Boca Raton, FL | 3.0 | 2.0 | 1477 | $3,500 | $2.37 | 24d | 1 | 0.33mi |
| 8705 Via Giula #4 Boca Raton, FL | 3.0 | 2.0 | 1477 | $3,400 | $2.30 | 14d | 1 | 0.33mi |
| 9110 Fairbanks Ln #4 Boca Raton, FL | 2.0 | 2.0 | 1227 | $2,400 | $1.96 | 24d | 1 | 0.40mi |
| 209 Suffolk F Unit F Boca Raton, FL | 1.0 | 1.5 | 720 | $1,400 | $1.94 | 24d | 1 | 0.56mi |
| 68 Suffolk F Unit 68 Boca Raton, FL | 1.0 | 1.5 | 720 | $2,750 | $3.82 | 24d | 1 | 0.56mi |
| 250 Suffolk F #250 Boca Raton, FL | 1.0 | 1.5 | 720 | $1,450 | $2.01 | 2d | 1 | 0.56mi |
| 171 Suffolk F #171 Boca Raton, FL | 1.0 | 1.5 | 720 | $1,500 | $2.08 | 10d | 1 | 0.56mi |
| 9448 Saddlebrook Dr Boca Raton, FL | 3.0 | 2.0 | 1243 | $3,500 | $2.82 | 20d | 1 | 0.57mi |
| 9448 Saddlebrook Dr Unit 9448 Boca Raton, FL | 3.0 | 2.0 | 1243 | $3,500 | $2.82 | 24d | 1 | 0.57mi |
| 4007 Yarmouth a Boca Raton, FL | 2.0 | 2.0 | 1132 | $2,200 | $1.94 | 24d | 1 | 0.61mi |
| 1072 Yarmouth E #1072 Boca Raton, FL | 1.0 | 1.5 | 738 | $1,950 | $2.64 | 24d | 1 | 0.61mi |
| 4067 Yarmouth D Boca Raton, FL | 1.0 | 1.5 | 738 | $1,650 | $2.24 | 3d | 1 | 0.63mi |
| 8146 Windgate Dr Boca Raton, FL | 2.0 | 2.0 | 1310 | $5,000 | $3.82 | 24d | 1 | 0.64mi |
| 149 Preston Way #149 Boca Raton, FL | 1.0 | 1.5 | 720 | $1,300 | $1.81 | 1d | 1 | 0.65mi |
| 149 Preston Way #149 Boca Raton, FL | 1.0 | 1.5 | 720 | $1,350 | $1.88 | 24d | 1 | 0.65mi |
| 74 Preston Way Boca Raton, FL | 2.0 | 1.5 | 840 | $1,750 | $2.08 | 21d | 1 | 0.65mi |
| 204 Preston Way #204 Boca Raton, FL | 1.0 | 1.0 | 810 | $1,500 | $1.85 | 1d | 1 | 0.65mi |
| 74 Preston Way Boca Raton, FL | 2.0 | 1.5 | 840 | $1,750 | $2.08 | 24d | 1 | 0.65mi |
| 3049 Wolverton E Unit 3049 Boca Raton, FL | 2.0 | 2.0 | 896 | $2,200 | $2.46 | 7d | 1 | 0.71mi |
| 4049 Wolverton C Unit C Boca Raton, FL | 2.0 | 2.0 | 896 | $2,500 | $2.79 | 1d | 1 | 0.73mi |
| 84 Mansfield Dr Unit 84 Boca Raton, FL | 2.0 | 1.5 | 840 | $1,583 | $1.88 | 24d | 1 | 0.77mi |
| 392 Mansfield I Unit I Boca Raton, FL | 2.0 | 1.5 | 840 | $1,850 | $2.20 | 24d | 1 | 0.77mi |
| 543 Mansfield M #543 Boca Raton, FL | 2.0 | 1.5 | 835 | $1,890 | $2.26 | 24d | 1 | 0.77mi |
| 9 Mansfield B #9 Boca Raton, FL | 1.0 | 1.5 | 810 | $1,400 | $1.73 | 24d | 1 | 0.77mi |
| 431 Mansfield K Unit K Boca Raton, FL | 2.0 | 1.5 | 835 | $1,600 | $1.92 | 21d | 1 | 0.77mi |
| 588 Mansfield M Unit M Boca Raton, FL | 2.0 | 1.5 | 835 | $1,475 | $1.77 | 24d | 1 | 0.77mi |
| 445 Mansfield M Unit 445 Boca Raton, FL | 2.0 | 1.5 | 840 | $1,700 | $2.02 | 7d | 1 | 0.78mi |
| 351 Mansfield Dr #351 Boca Raton, FL | 2.0 | 1.5 | 840 | $2,300 | $2.74 | 24d | 1 | 0.78mi |
| 162 Preston D Boca Raton, FL | 1.0 | 1.0 | 810 | $1,495 | $1.85 | 24d | 1 | 0.78mi |
| 3049 Wolverton C #3049 Boca Raton, FL | 2.0 | 2.0 | 896 | $2,200 | $2.46 | 7d | 1 | 0.79mi |
| 4030 Rexford A Unit 403 Boca Raton, FL | 2.0 | 2.0 | 896 | $1,850 | $2.06 | 24d | 1 | 0.80mi |
| 4030 Rexford A Unit 403 Boca Raton, FL | 2.0 | 2.0 | 896 | $1,700 | $1.90 | 7d | 1 | 0.80mi |
HOA detail condo
- Monthly dues
- $558 · $6,696/yr
- Likely covers
- landscapingpoolgymsecurity
- Assessments
- None detected in remarks — confirm with the listing agent.
Listing history 10 events
-
2026-06-18days on market $360,000 Active 15 DOM
-
2026-06-17days on market $360,000 Active 14 DOM
-
2026-06-16days on market $360,000 Active 13 DOM
-
2026-06-15days on market $360,000 Active 12 DOM
-
2026-06-13pricedays on market $360,000 Active 10 DOM
-
2026-06-09days on market $370,000 Active 6 DOM
-
2026-06-08days on market $370,000 Active 5 DOM
-
2026-06-07days on market $370,000 Active 4 DOM
-
2026-06-04remarks 693-char remark
-
2026-06-04$370,000 Active 1 DOM
ⓘ Source: listings_history table (triggers on properties + properties_extension) + one-shot
backfill from property_details.listing_events for pre-trigger history.
Tax reassessment forecast FL · Resets to sale price
- Current annual tax
- $806 · $67/mo
- Projected year-2 tax
- $2,988 · $249/mo
- Expected delta
- +$2,182/yr (+$182/mo · 270.5%)
ⓘ Screening estimate from a state-policy table — verify with the county assessor before closing.
Climate risk First Street
- Flood 1/10 Low FEMA zone X (unshaded) · 0% chance over 30 yrs
- Wildfire 1/10 Low
- Heat 9/10 Extreme 7 d/yr ≥107°F today · 25 d/yr by 30 yrs out
- Wind 10/10 Extreme 99% chance of damaging wind over 30 yrs
- Air quality 2/10 Low 2 unhealthy d/yr today · 2 by 30 yrs out
Nearby sold comps map
Loading sold comps map…
Walkable amenities ~0.75 mi
Loading nearby amenities…
Taxation est. · year 1
- Rental income
- $30,962
- − Mortgage interest
- −$20,166
- − Property taxes
- −$806
- − Insurance
- −$1,800
- − Repairs & maintenance
- −$2,477
- − Management
- −$2,477
- − HOA
- −$6,696
- − Depreciation
- −$10,473
- Taxable loss
- −$13,933
- Est. tax savings @ 24.0%
- +$3,344
- After-tax cash flow
- $-4,153/yr
For passive investors: Depreciation is non-cash, so a rental often shows a tax loss while cash-flowing — sheltering income. Rental losses are passive: they offset passive income freely, and up to $25,000/yr can offset ordinary (W-2) income if you actively participate and your MAGI is under $100k (phasing out to $0 by $150k); unused losses carry forward. On sale, claimed depreciation is recaptured at up to 25%, and gains may owe capital-gains tax (a 1031 exchange can defer both). Figures are a year-1 estimate at your 24.0% rate — not tax advice; consult a CPA.
Schools (NCES district)
- District
- Palm Beach
- NCES district ID
- 1201500
- Math proficiency
- 46% ▼ -16.00%
- Reading proficiency
- 53% ▼ -4.00%
- Median HH income
- $53,943
- Composite
- 42.72/100
- National rank
- #3160
- State rank
- #34 of 73 in FL
Livability — Boca Raton
- Score
- 77/100
- State rank
- #192
- US rank
- #3070
Category grades
Schools grade is shown separately in the Schools card above.
Census & demographics
- County
- Palm Beach County · 1,438,312 people
- City population
- 250,102
- Metro
- Miami-Fort Lauderdale-Pompano Beach, FL
- Population (ZIP)
- 26,579
- Household income
- $114,885
- Rent vs Own
- Severe rent burden
- 464.0
Population outlook (Palm Beach County) Hauer SSP2
- Today (2025)
- 1,637,487 people
- By 2030
- 1,743,255 · +6.5%
- By 2040
- 1,948,712 · +19.0%
- By 2050
- 2,132,979 · +30.3%
- By 2075
- 2,530,027 · +54.5%
- By 2100
- 2,706,979 · +65.3%
Race, ethnicity, and origin ACS 2023
- Neighborhood character
- Predominantly White (79%)
- Race & ethnicity
- White 79% Hispanic / Latino 11% Two or more races 8% Asian 5% Black 2%
- Hispanic origin (detail)
- Puerto Rican 3%
- Common ancestry
- Scotch-Irish 13% Romanian 9% Italian 3%
- Foreign-born
- 24% · Canada, Jamaica, Dominican Republic
- Languages at home
- 75% English-only · Spanish 9% Other Indo-European 5% Russian/Polish/Slavic 4%
Political lean MEDSL · Palm Beach
- 2024 margin
- Toss-up / Even · D 50.0% · R 49.2%
- 2008→2024 swing
- -22.1pp toward R · 2008: 22.9pp · 2024: 0.8pp
- All cycles
- 2024: D+0.8 2020: D+12.8 2016: D+15.3 2012: D+17.0 2008: D+22.9
Not yet ingested
- Civics
- —
Market trends
- HPI YoY
- ▲ 10.48%
- Current HPI
- 313.9058
- Rent YoY
- ▲ 2.31%
- Metro
- Miami-Fort Lauderdale-Pompano Beach, FL
- State GDP YoY
- ▲ 3.28%
- F500 in state
- 36
Industry mix (Fortune 500 HQ in FL)
| Industry | F500 HQs | Revenue |
|---|---|---|
| Industrial Technology | 2 | $29B |
|
||
| Insurance | 2 | $17B |
|
||
| Retail | 1 | $60B |
|
||
| Technology Distribution | 1 | $58B |
|
||
| Homebuilding | 1 | $35B |
|
||
| Technology Manufacturing | 1 | $35B |
|
||
Price history
+413.9% since first listed10 events — show timeline
- 2026-06-03 Listed $370,000 MARMLS
- 2026-01-12 Sold (Public Records) $187,000 Public Records
- 2026-01-08 Sold (MLS) $187,000 Beaches MLS
- 2025-12-12 Pending — Beaches MLS
- 2025-12-02 Listed $189,900 Beaches MLS
- 1999-03-22 Sold (Public Records) $83,500 Public Records
- 1999-03-18 Sold (MLS) $83,500 Beaches MLS
- 1999-02-10 Listing Removed — Beaches MLS
- 1998-08-18 Listed $85,000 Beaches MLS
- 1996-05-06 Sold (Public Records) $72,000 Public Records
Property tax history
-0.3%/yrLatest (2025): $806 · +2.9% YoY. Source: county tax records.
Cash-flow waterfall
monthlySold comps — $/sqft
last 12 mo · ≤1 miLoading sold comps…