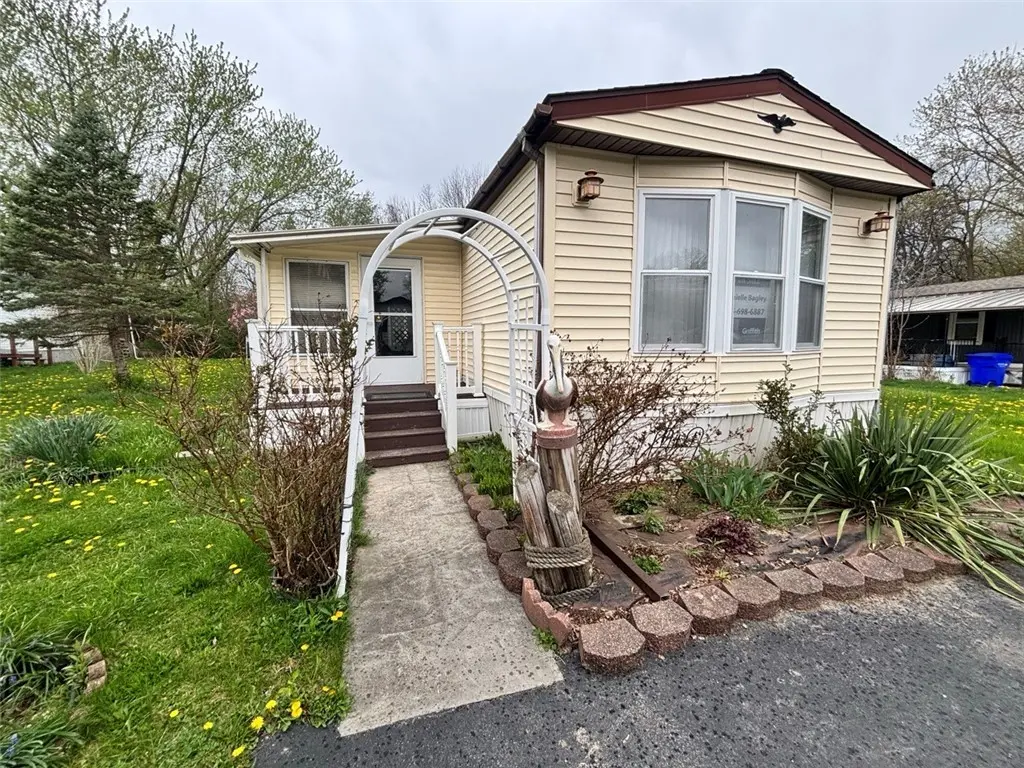
213 Crabapple Dr · Canandaigua, NY
Flood risk 1/10 · Minimal
- FEMA flood zone
- X
- Chance of flooding over 30 yrs
- 0.0%
- Est. flood insurance / yr
- $507 – $1,088
Fire risk 1/10 · Minimal
- Est. fire insurance / yr
- $691 – $1,283
Heat risk 2/10 · Minimal
- Hot days now (above 95°F)
- 7 days/yr
- Hot days in 30 yrs
- 15 days/yr
Wind risk 1/10 · Minimal
- Chance of severe wind over 30 yrs
- —
Air-quality risk 2/10 · Minimal
- Unhealthy air days now
- 0 days/yr
- Unhealthy air days in 30 yrs
- 1 days/yr
Risk factors via First Street. Map © Google.
Why this score? — see what drove the B+ grade
The composite is a weighted blend of 9 inputs, each scored 0–100. Each bar is that input's sub-score; the figure is the points it added to the 100-point composite (weight × sub-score).
- Cash flow +30.0/30.0
- ARV discount +12.0/15.0
- 1% rule +10.0/10.0
- DSCR +10.0/10.0
- Schools +4.7/10.0
- Rent growth +4.6/5.0
- Livability +3.8/5.0
- Condition / age +2.5/5.0
- Appreciation +0.0/10.0
$45,000
🖨 Deal sheet 📄 Offer letter ✓ Due diligence
Listing remarks
Nestled in a friendly park, this home gives you peaceful living with great neighbors! This well maintained home offers an affordable and comfortable living option in a quiet, established park community. Featuring a practical layout, this home includes 2 bedrooms and 1.5 bathrooms, a spacious living area, and a functional kitchen with ample cabinet space. The exterior includes a large enclosed porch area that is perfect for relaxing and enjoying your coffee in the morning! Enjoy low maintenance living with the convenience of community amenities and easy access to local shops and services in the city of Canandaigua, less than a 5 minute drive away!
Key facts
- Community amenities
- Enclosed porch area
- Built 1984
Tags
Property features AI
Finance
- Financial info: Land lease amount applicable
Exterior
- Parking: No garage
- Utilities: Electricity available with circuit breakers; High-speed internet available; Public water connected; Sewer connected
- Home design: Single-story home (1 story); Single wide mobile home (Nashua); Resale property; Main thoroughfare frontage; Rectangular lot near public transit
- Construction: Aluminum siding; Vinyl siding; Asphalt roof; Existing (previously built)
- Exterior features: Blacktop driveway; Enclosed porch; Porch; Shed(s) and storage
Interior
- Kitchen: Electric oven; Electric range; Microwave; Refrigerator; Dishwasher; Breakfast bar; Pantry; Eat-in kitchen
- Bedrooms: 2 bedrooms on the main level
- Flooring: Carpet; Laminate; Vinyl; Mixed/varies
- Bathrooms: 1 full bathroom; 1 half bathroom; 2 bathrooms on the main level
- Heating & cooling: Electric forced air heat; Central air conditioning
- Interior features: Breakfast bar; Ceiling fan(s); Separate/formal dining room; Eat-in kitchen; Separate/formal living room; Pantry; Partially furnished; Bath in primary bedroom; Main level primary
- Laundry & utility: Washer; Dryer; Laundry on the main level
Neighborhood map
What this means for you Summary
Snapshot
- This is a 2-bed/1.5-bath manufactured listed at $45k.
Deal economics
- At list price, monthly cash flow is $1k ($13k/yr) — positive.
- The deal already cash-flows at list — no discount required.
- Meets the 1% rule at list price ($2k rent vs $45k).
- Recommended offer: $44k (3.0% below list) — sets the bar for market timing.
- Cap rate 35.3% vs local median 3.4% in Canandaigua — top-decile yield for the area; either an underpriced asset or a hidden risk that comps aren't pricing in. Stress-test before assuming the spread holds.
Location & tenants
- Location reads 75/100 on livability (#243 in NY, #3,822 nationally) — a middle-class / working-renter tenant base. Strengths: commute A+, housing A+, schools B+; Watch: employment C-, amenities F, health & safety D-.
- Canandaigua City School District (suburban): math 50% / reading 59% proficiency, ranked #305 of 590 in NY (top 52%) — acceptable for families but not a draw, mixed tenant base, ~2y average lease.
- Market conditions: Rents rising fast (+8.5%/yr); 223 active listings in the ZIP; solid renter incomes; 284 units permitted in Ontario County in 2024 (69 in 5+ unit buildings).
Forward outlook
- Local home prices are declining (-3.0%/yr); year-one equity from $311 of loan paydown is wiped out by about $1k of value loss. Plan a longer hold.
- Ontario County population projected to shrink 6% by 2050 — rents likely to lag national; underwrite the cash flow, not the appreciation.
- At projected returns (-3.0% appreciation + 8.0% rent growth), your $13k cash investment doubles in ~2 years — after that, you're playing with house money.
Negotiation context
- It's been on market 49 days — a 3% lower offer ($44k) is reasonable based on typical stale-listing flexibility.
Questions for the listing agent
- It's been on market 49 days. Have you received any prior offers? Is the seller open to a 3% concession, seller financing, or rate buy-down credit?
- Is there a deadline driving the sale (1031 exchange, divorce, estate, relocation)? That informs how much negotiation room exists.
- Schools are B-rated — typically a magnet for longer-tenancy family renters. What's the average tenant stay here, and is there a school-zone premium baked into asking?
- What's the average days-on-market for RENTAL listings here right now (not sales)? A rising rental-DOM trend means longer vacancies and softer asking-rent achievability than the comps imply.
- What's the recent tenant-quality profile in this submarket — average credit score on applications, eviction rate, late-payment / NSF rate, and stable-employment percentage? A property-management company in the area should have these aggregated.
- How much new for-sale + rental construction is in the pipeline within 1–3 miles? Heavy new supply typically softens prices + rents 12–24 months out; constrained supply supports both.
Investment metrics
- 1% rule
- 3.85% ✓
- Cap rate
- 35.26%
- Cash-on-cash
- 103.44%
- DSCR
- 5.60
- GRM
- 2.2
CMA / ARV
- ARV (median comp)
- $50,000
- List price
- $45,000
- Delta
- -10.00%
- Verdict
- FAIR
- Comps
- 13 within 1.0 mi
Show comp detail 6 sales within ~0.75 mi
| Address | Dist | Beds/Ba | Sqft | Sold | Price | $/sf | Match |
|---|---|---|---|---|---|---|---|
| 230 Crabapple Dr | 0.11mi | 2/2.0 | 980 (-3%) | 4mo | $50,000 | $51 | 85 |
| 227 Crabapple St | 0.08mi | 3/1.0 (+1) | 980 (-3%) | 10mo | $46,000 | $47 | 76 |
| 205 Crabapple Dr | 0.05mi | 3/2.0 (+1) | 1,056 (+5%) | 11mo | $64,900 | $61 | 74 |
| 326 Oak Tree Dr Dr | 0.27mi | 2/2.0 | 980 (-3%) | 9mo | $42,500 | $43 | 74 |
| 423 Mountain Ash Dr | 0.54mi | 3/2.0 (+1) | 960 (-5%) | 5mo | $62,000 | $65 | 56 |
| 317 Oak Tree Dr | 0.21mi | 3/1.0 (+1) | 1,120 (+11%) | 15mo | $43,900 | $39 | 52 |
Match score weights: distance 35% · size 25% · config 20% · recency 20%. Top-matched comps best support the ARV.
Projected returns pro-forma
-3.0% appreciation · 8.0% rent growth · sell at horizon
- IRR
- —
- Equity multiple
- 6.64×
- Total profit
- $71,050
- Equity at exit
- $6,710
- IRR
- —
- Equity multiple
- 16.29×
- Total profit
- $192,664
- Equity at exit
- $3,891
Cash invested: $12,600 (down + closing). Projections, not guarantees.
Landlord ↔ Tenant lean methodology
- Overall (STATE)
- 15 Strongly Tenant-Friendly
- State New York
- 15 Strongly Tenant-Friendly · D+10
- County
- — inherits STATE
- City
- — inherits STATE
ZIP-level market 14424
- Home prices YoY
- -21.2%
- Rents YoY
- 8.5%
- Active inventory
- 223
- Price-to-rent
- 2.2×
Monthly cashflow live
- Estimated rent
- $1,733 medium interval (Pro) →
- Mortgage (P&I)
- −$236
- Tax from tax record
- −$28 /mo · $340/yr
- Insurance
- −$19
- HOA
- −$0
- Vacancy / Maint / Mgmt
- −$364
- Net cashflow
- $1,086
Break-even live
UW: 25.0% down · 7.5% · 30yr · 1.5% tax · 5.0% vac · 8.0% maint · 8.0% mgmt
Financing live
Cash to close
- Down payment
- $11,250
- Closing costs
- $1,350
- Reserves months
- —
- Total cash needed
- —
Loan-product check · same deal, 3 products live
Conventional
25% down · 7.5% · 30yr
- Down + closing
- —
- Monthly P&I
- —
- Monthly cashflow
- —
- DSCR
- —
- Eligible?
- —
Personal DTI + credit; lowest rate.
DSCR
20% down · 8.5% · 30yr
- Down + closing
- —
- Monthly P&I
- —
- Monthly cashflow
- —
- DSCR
- —
- Eligible?
- —
No personal income docs; deal must DSCR.
Hard money
10% down · 12.0% · 12mo
- Down + closing
- —
- Monthly P&I
- —
- Monthly cashflow
- —
- DSCR
- —
- Eligible?
- —
Short-term bridge; refi at stabilization.
Listing history 15 events
-
2026-06-18days on market $45,000 Active 49 DOM
-
2026-06-17days on market $45,000 Active 48 DOM
-
2026-06-16days on market $45,000 Active 47 DOM
-
2026-06-15days on market $45,000 Active 46 DOM
-
2026-06-13days on market $45,000 Active 44 DOM
-
2026-06-13days on market $45,000 Active 43 DOM
-
2026-06-10days on market $45,000 Active 41 DOM
-
2026-06-09days on market $45,000 Active 40 DOM
-
2026-06-09days on market $45,000 Active 39 DOM
-
2026-06-07days on market $45,000 Active 38 DOM
-
2026-06-03days on market $45,000 Active 34 DOM
-
2026-06-03days on market $45,000 Active 33 DOM
-
2026-06-01pricedays on market $45,000 Active 32 DOM
-
2026-05-31days on market $50,000 Active 31 DOM
-
2026-04-30$50,000 Active 654-char remark
ⓘ Source: listings_history table (triggers on properties + properties_extension) + one-shot
backfill from property_details.listing_events for pre-trigger history.
Tax reassessment forecast NY · Partial reset (capped growth)
- Current annual tax
- $340 · $28/mo
- Projected year-2 tax
- $550 · $46/mo
- Expected delta
- +$210/yr (+$18/mo · 61.9%)
ⓘ Screening estimate from a state-policy table — verify with the county assessor before closing.
Climate risk First Street
- Flood 1/10 Low FEMA zone X · 0% chance over 30 yrs
- Wildfire 1/10 Low
- Heat 2/10 Low 7 d/yr ≥95°F today · 15 d/yr by 30 yrs out
- Wind 1/10 Low
- Air quality 2/10 Low 0 unhealthy d/yr today · 1 by 30 yrs out
Nearby sold comps map
Loading sold comps map…
Walkable amenities ~0.75 mi
Loading nearby amenities…
Taxation est. · year 1
- Rental income
- $20,797
- − Mortgage interest
- −$2,521
- − Property taxes
- −$340
- − Insurance
- −$225
- − Repairs & maintenance
- −$1,664
- − Management
- −$1,664
- − Depreciation
- −$1,309
- Taxable income
- $13,075
- Est. tax owed @ 24.0%
- −$3,138
- After-tax cash flow
- $9,895/yr
For passive investors: Depreciation is non-cash, so a rental often shows a tax loss while cash-flowing — sheltering income. Rental losses are passive: they offset passive income freely, and up to $25,000/yr can offset ordinary (W-2) income if you actively participate and your MAGI is under $100k (phasing out to $0 by $150k); unused losses carry forward. On sale, claimed depreciation is recaptured at up to 25%, and gains may owe capital-gains tax (a 1031 exchange can defer both). Figures are a year-1 estimate at your 24.0% rate — not tax advice; consult a CPA.
Schools (NCES district)
- District
- Canandaigua City School District
- NCES district ID
- 3606330
- Math proficiency
- 50% ▼ -10.00%
- Reading proficiency
- 59% ▲ 4.00%
- Median HH income
- $56,375
- Composite
- 47.09/100
- National rank
- #2335
- State rank
- #305 of 590 in NY
Livability — Canandaigua
- Score
- 75/100
- State rank
- #243
- US rank
- #3822
Category grades
Schools grade is shown separately in the Schools card above.
Census & demographics
- County
- Ontario County · 58,989 people
- City population
- 28,786
- Metro
- Rochester, NY
- Population (ZIP)
- 28,786
- Household income
- $79,778
- Rent vs Own
- Severe rent burden
- 737.0
Population outlook (Ontario County) Hauer SSP2
- Today (2025)
- 111,230 people
- By 2030
- 111,401 · +0.2%
- By 2040
- 109,535 · -1.5%
- By 2050
- 104,895 · -5.7%
- By 2075
- 92,999 · -16.4%
- By 2100
- 73,723 · -33.7%
Race, ethnicity, and origin ACS 2023
- Neighborhood character
- Predominantly White (90%)
- Race & ethnicity
- White 90% Hispanic / Latino 5% Two or more races 5% Black 1%
- Common ancestry
- Romanian 4% Iranian 4% Slovak 3%
- Foreign-born
- 3% · Canada
- Languages at home
- 94% English-only · Spanish 3% German/W. Germanic 1% Arabic 1%
Political lean MEDSL · Ontario
- 2024 margin
- Toss-up / Even · D 49.4% · R 50.6%
- 2008→2024 swing
- -1.0pp toward R · 2008: -0.1pp · 2024: -1.2pp
- All cycles
- 2024: R+1.2 2020: R+0.0 2016: R+8.6 2012: R+1.6 2008: R+0.1
Not yet ingested
- Civics
- —
Market trends
- HPI YoY
- ▼ -70.94%
- Current HPI
- 263.755
- Rent YoY
- ▲ 8.46%
- Metro
- Rochester, NY
- State GDP YoY
- ▲ 2.60%
- F500 in state
- 92
Industry mix (Fortune 500 HQ in NY)
| Industry | F500 HQs | Revenue |
|---|---|---|
| Financial Services | 10 | $950B |
|
||
| Consumer Goods | 9 | $162B |
|
||
| Insurance | 4 | $225B |
|
||
| Telecommunications | 2 | $144B |
|
||
| Pharmaceuticals | 2 | $112B |
|
||
| Media / Entertainment | 2 | $69B |
|
||
Price history
-10.0% since first listed2 events — show timeline
- 2026-06-01 Price Changed $45,000 UNYREIS
- 2026-04-30 Listed $50,000 UNYREIS
Property tax history
+1.7%/yrLatest (2025): $340 · -0.2% YoY. Source: county tax records.
Cash-flow waterfall
monthlySold comps — $/sqft
last 12 mo · ≤1 miLoading sold comps…