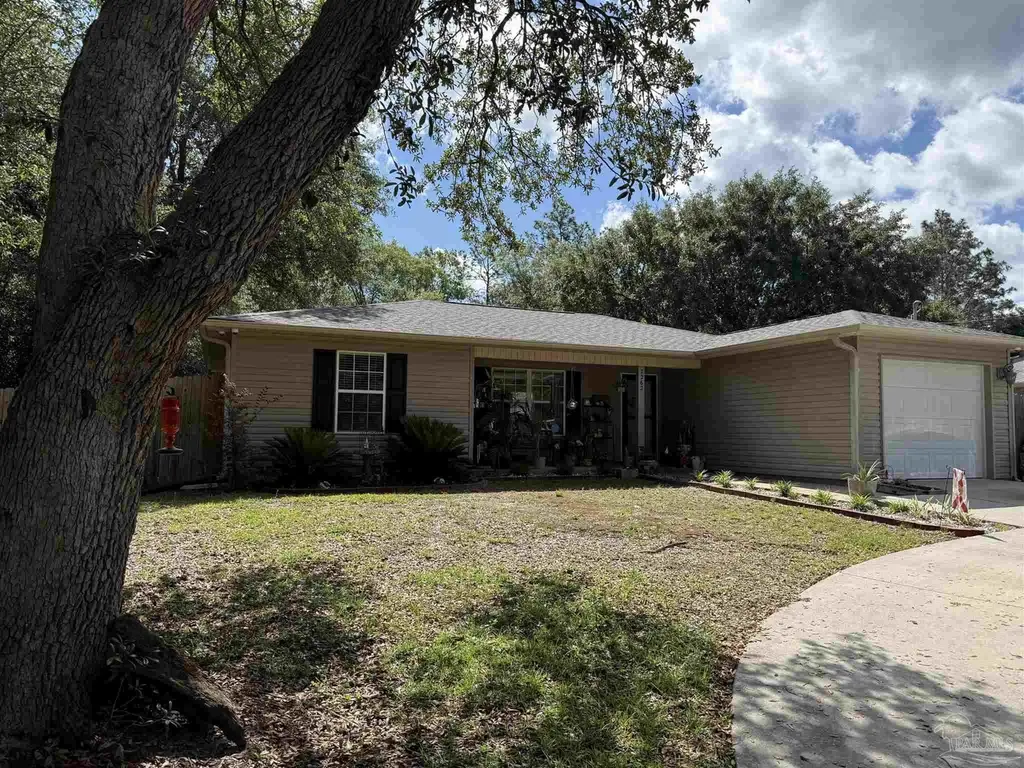
7262 Birdie Ln · Point Baker, FL
Flood risk 1/10 · Minimal
- FEMA flood zone
- X (unshaded)
- Chance of flooding over 30 yrs
- 0.0%
- Est. flood insurance / yr
- $507 – $1,088
Fire risk 6/10 · Moderate
- Est. fire insurance / yr
- $947 – $1,759
Heat risk 9/10 · Severe
- Hot days now (above 106°F)
- 7 days/yr
- Hot days in 30 yrs
- 20 days/yr
Wind risk 9/10 · Severe
- Chance of severe wind over 30 yrs
- 99.0%
Air-quality risk 1/10 · Minimal
- Unhealthy air days now
- 0 days/yr
- Unhealthy air days in 30 yrs
- 0 days/yr
Risk factors via First Street. Map © Google.
Why this score? — see what drove the D+ grade
The composite is a weighted blend of 9 inputs, each scored 0–100. Each bar is that input's sub-score; the figure is the points it added to the 100-point composite (weight × sub-score).
- Cash flow +18.2/30.0
- ARV discount +6.7/15.0
- DSCR +5.7/10.0
- Schools +5.3/10.0
- 1% rule +3.6/10.0
- Rent growth +3.2/5.0
- Livability +3.2/5.0
- Condition / age +2.5/5.0
- Appreciation +0.0/10.0
$225,000
🖨 Deal sheet 📄 Offer letter ✓ Due diligence
Listing remarks MLS
Lovely 3 bedroom 2 bath home sitting on nice private lot. Very convenient to Whiting Field and excellent Berryhill Elementary just right down the road. New wood laminate in great room. Small breakfast room adjoins kitchen. Vaulted ceiling in family room. Split bedroom plan. This home is in great condition. Storage building in back with electric.
Key facts
- Open design
- Walk-in closet
- Split floor plan
Tags
Property features AI
Finance
- Other: Lot dimensions approx. 81 x 198 (0.36 acres); Building area about 1,062 square feet; Directions: North on Pine Blossom, left on Eagle Drive, right on Birdie Lane; home will be on the right
- HOA & community: No homeowners association
Exterior
- Parking: Attached garage; 4 or more car garage; Circular driveway; Open parking included (total parking for 4 vehicles)
- Utilities: Public water; Septic tank sewer; Circuit breaker electrical service
- Home design: Single-story home; Resale property; Not attached to another property; Homestead exempt
- Construction: Frame construction; Slab foundation; Composition roof; Built on one level
- Exterior features: Interior lot; Paved, county-maintained road access
Interior
- Kitchen: Kitchen on the first floor; Electric water heater
- Bedrooms: Primary bedroom on the first floor (approx. 11.5' x 12.5')
- Flooring: Tile
- Bathrooms: 2 full bathrooms; Bathrooms not updated
- Heating & cooling: Central heating; Central air; Ceiling fan(s)
- Interior features: Tile flooring; Living/dining combo
- Laundry & utility: No specific laundry details provided
Neighborhood map
What this means for you Summary
Snapshot
- This is a 3-bed/2.0-bath single-family listed at $225k.
Deal economics
- At list price, monthly cash flow is $202 ($2k/yr) — positive.
- The deal already cash-flows at list — no discount required.
- To meet the 1% rule (rent ≥ 1% of price), the offer needs to be $194k (13.8% below list).
- Recommended offer: $194k (13.8% below list) — sets the bar for 1% rule.
- Cap rate 7.4% vs local median 4.2% in Point Baker — top-decile yield for the area; either an underpriced asset or a hidden risk that comps aren't pricing in. Stress-test before assuming the spread holds.
Location & tenants
- Location reads 63/100 on livability (#735 in FL) — a middle-class / working-renter tenant base. Strengths: crime A+, cost of living A+, housing A+; Watch: schools F, amenities F, commute F.
- Santa Rosa (suburban): math 63% / reading 60% proficiency, ranked #8 of 73 in FL (top 11%) — acceptable for families but not a draw, mixed tenant base, ~2y average lease.
- Market conditions: Rents rising (+2.7%/yr); 360 active listings in the ZIP; solid renter incomes; 1,983 units permitted in Santa Rosa County in 2024 (128 in 5+ unit buildings).
- This rent runs 30% of the median local income ($77k/yr) — at the standard rent-burdened threshold; future hikes will face affordability resistance.
Forward outlook
- Local home prices are declining (-3.0%/yr); year-one equity from $2k of loan paydown is wiped out by about $7k of value loss. Plan a longer hold.
- Santa Rosa County population projected at +31% by 2050 — long-run rental-demand tailwind backs the buy-and-hold thesis.
Negotiation context
- It's been on market 28 days — a 2% lower offer ($222k) is reasonable based on typical stale-listing flexibility.
- 4 sale attempts since 20y ago with the ask held roughly flat each time — persistent listings suggest the price (not the market) is what's stuck; bring a comps-based counter.
- Current owner paid $95k; list at $225k implies a 137% gain — meaningful room to come down on a strong offer.
Risks & watch-outs
- Climate carrying-cost: severe wind risk, 99% chance of damaging wind over 30y; major wildfire risk; extreme-heat days projected 7→20/yr by 2055 (HVAC capex compounding) — expect insurance premiums to compound above CPI over the hold.
Questions for the listing agent
- Is there a deadline driving the sale (1031 exchange, divorce, estate, relocation)? That informs how much negotiation room exists.
- Schools are F-rated, which usually means shorter tenancies and higher turnover. Who's the typical renter profile here, and what's been the actual vacancy rate?
- The area grade is low — what's the realistic commute time and amenity access for the typical tenant pool here? Any planned neighborhood developments (good or bad) we should know about?
- What's the average days-on-market for RENTAL listings here right now (not sales)? A rising rental-DOM trend means longer vacancies and softer asking-rent achievability than the comps imply.
- What's the recent tenant-quality profile in this submarket — average credit score on applications, eviction rate, late-payment / NSF rate, and stable-employment percentage? A property-management company in the area should have these aggregated.
- How much new for-sale + rental construction is in the pipeline within 1–3 miles? Heavy new supply typically softens prices + rents 12–24 months out; constrained supply supports both.
Investment metrics
- 1% rule
- 0.86% ✗
- Cap rate
- 7.37%
- Cash-on-cash
- 3.85%
- DSCR
- 1.17
- GRM
- 9.7
CMA / ARV
- ARV (on-the-fly)
- $220,896
- Comps found
- 4
Show comp detail 4 sales within ~0.75 mi
| Address | Dist | Beds/Ba | Sqft | Sold | Price | $/sf | Match |
|---|---|---|---|---|---|---|---|
| 7253 Pro Ln | 0.13mi | 2/2.0 (-1) | 1,000 (-6%) | 6mo | $220,000 | $220 | 74 |
| 7201 Bogey Ln | 0.13mi | 3/2.0 | 1,150 (+8%) | 10mo | $225,000 | $196 | 71 |
| 5691 Eagle Dr | 0.22mi | 3/2.0 | 1,107 (+4%) | 14mo | $230,000 | $208 | 71 |
| 7216 Par Ln | 0.25mi | 3/2.0 | 1,200 (+13%) | 14mo | $230,000 | $192 | 55 |
Match score weights: distance 35% · size 25% · config 20% · recency 20%. Top-matched comps best support the ARV.
Projected returns pro-forma
-3.0% appreciation · 2.7% rent growth · sell at horizon
- IRR
- -10.6%
- Equity multiple
- 0.61×
- Total profit
- $-24,291
- Equity at exit
- $33,548
- IRR
- -1.8%
- Equity multiple
- 0.88×
- Total profit
- $-7,414
- Equity at exit
- $19,454
Cash invested: $63,000 (down + closing). Projections, not guarantees.
Landlord ↔ Tenant lean methodology
- Overall (STATE)
- 87 Strongly Landlord-Friendly
- State Florida
- 87 Strongly Landlord-Friendly · R+3
- County
- — inherits STATE
- City
- — inherits STATE
ZIP-level market 32570
- Home prices YoY
- -15.1%
- Rents YoY
- 2.7%
- Active inventory
- 360
- Price-to-rent
- 9.7×
Monthly cashflow live
- Estimated rent
- $1,940 medium interval (Pro) →
- Mortgage (P&I)
- −$1,180
- Tax from tax record
- −$57 /mo · $679/yr
- Insurance
- −$94
- HOA
- −$0
- Vacancy / Maint / Mgmt
- −$407
- Net cashflow
- $202
Break-even live
UW: 25.0% down · 7.5% · 30yr · 1.5% tax · 5.0% vac · 8.0% maint · 8.0% mgmt
Financing live
Cash to close
- Down payment
- $56,250
- Closing costs
- $6,750
- Reserves months
- —
- Total cash needed
- —
Loan-product check · same deal, 3 products live
Conventional
25% down · 7.5% · 30yr
- Down + closing
- —
- Monthly P&I
- —
- Monthly cashflow
- —
- DSCR
- —
- Eligible?
- —
Personal DTI + credit; lowest rate.
DSCR
20% down · 8.5% · 30yr
- Down + closing
- —
- Monthly P&I
- —
- Monthly cashflow
- —
- DSCR
- —
- Eligible?
- —
No personal income docs; deal must DSCR.
Hard money
10% down · 12.0% · 12mo
- Down + closing
- —
- Monthly P&I
- —
- Monthly cashflow
- —
- DSCR
- —
- Eligible?
- —
Short-term bridge; refi at stabilization.
Listing history 24 events
-
2026-06-18days on market $225,000 Active 28 DOM
-
2026-06-17days on market $225,000 Active 27 DOM
-
2026-06-16days on market $225,000 Active 26 DOM
-
2026-06-15days on market $225,000 Active 25 DOM
-
2026-06-14days on market $225,000 Active 23 DOM
-
2026-06-10days on market $225,000 Active 20 DOM
-
2026-06-09days on market $225,000 Active 19 DOM
-
2026-06-08days on market $225,000 Active 18 DOM
-
2026-06-07days on market $225,000 Active 17 DOM
-
2026-06-05days on market $225,000 Active 14 DOM
-
2026-06-03days on market $225,000 Active 13 DOM
-
2026-06-02days on market $225,000 Active 12 DOM
-
2026-06-01days on market $225,000 Active 11 DOM
-
2026-05-31days on market $225,000 Active 10 DOM
-
2026-05-31days on market $225,000 Active 9 DOM
-
2026-05-21$225,000 Active
-
2014-11-21soldstatus $95,000
-
2014-11-14soldstatus $95,000 347-char remark
Show marketing remark (347 chars)
Lovely 3 bedroom 2 bath home sitting on nice private lot. Very convenient to Whiting Field and excellent Berryhill Elementary just right down the road. New wood laminate in great room. Small breakfast room adjoins kitchen. Vaulted ceiling in family room. Split bedroom plan. This home is in great condition. Storage building in back with electric.
-
2014-07-14$98,000 347-char remark
Show marketing remark (347 chars)
Lovely 3 bedroom 2 bath home sitting on nice private lot. Very convenient to Whiting Field and excellent Berryhill Elementary just right down the road. New wood laminate in great room. Small breakfast room adjoins kitchen. Vaulted ceiling in family room. Split bedroom plan. This home is in great condition. Storage building in back with electric.
-
2009-07-23soldstatus $85,000 352-char remark
Show marketing remark (352 chars)
Home under 90,000? We have it. Home was previously occupied, builder has home back and is doing minor repairs. 3/2 split floor plan. Very open. Maintance free exterior 1 car garage with opener. Berber carpet will be cleaned and 2 bedrooms repainted. Great area close but yet alittle country. Buyer to satisfy themselves of schools and square footage.
-
2009-04-21$87,500 352-char remark
Show marketing remark (352 chars)
Home under 90,000? We have it. Home was previously occupied, builder has home back and is doing minor repairs. 3/2 split floor plan. Very open. Maintance free exterior 1 car garage with opener. Berber carpet will be cleaned and 2 bedrooms repainted. Great area close but yet alittle country. Buyer to satisfy themselves of schools and square footage.
-
2006-02-21historical
-
2006-01-05$125,000
-
2005-05-10soldstatus $138,000
ⓘ Source: listings_history table (triggers on properties + properties_extension) + one-shot
backfill from property_details.listing_events for pre-trigger history.
Tax reassessment forecast FL · Resets to sale price
- Current annual tax
- $679 · $57/mo
- Projected year-2 tax
- $1,868 · $156/mo
- Expected delta
- +$1,188/yr (+$99/mo · 175.0%)
ⓘ Screening estimate from a state-policy table — verify with the county assessor before closing.
Climate risk First Street
- Flood 1/10 Low FEMA zone X (unshaded) · 0% chance over 30 yrs
- Wildfire 6/10 Major
- Heat 9/10 Extreme 7 d/yr ≥106°F today · 20 d/yr by 30 yrs out
- Wind 9/10 Extreme 99% chance of damaging wind over 30 yrs
- Air quality 1/10 Low 0 unhealthy d/yr today · 0 by 30 yrs out
Nearby sold comps map
Loading sold comps map…
Walkable amenities ~0.75 mi
Loading nearby amenities…
Taxation est. · year 1
- Rental income
- $23,274
- − Mortgage interest
- −$12,603
- − Property taxes
- −$679
- − Insurance
- −$1,125
- − Repairs & maintenance
- −$1,862
- − Management
- −$1,862
- − Depreciation
- −$6,545
- Taxable loss
- −$1,403
- Est. tax savings @ 24.0%
- +$337
- After-tax cash flow
- $2,760/yr
For passive investors: Depreciation is non-cash, so a rental often shows a tax loss while cash-flowing — sheltering income. Rental losses are passive: they offset passive income freely, and up to $25,000/yr can offset ordinary (W-2) income if you actively participate and your MAGI is under $100k (phasing out to $0 by $150k); unused losses carry forward. On sale, claimed depreciation is recaptured at up to 25%, and gains may owe capital-gains tax (a 1031 exchange can defer both). Figures are a year-1 estimate at your 24.0% rate — not tax advice; consult a CPA.
Schools (NCES district)
- District
- Santa Rosa
- NCES district ID
- 1201650
- Math proficiency
- 63% ▼ -6.00%
- Reading proficiency
- 60% ▼ -5.00%
- Median HH income
- $58,161
- Composite
- 53.12/100
- National rank
- #1511
- State rank
- #8 of 73 in FL
Livability — Point Baker
- Score
- 63/100
- State rank
- #735
- US rank
- #15840
Category grades
Schools grade is shown separately in the Schools card above.
Census & demographics
- County
- Santa Rosa County · 194,764 people
- Metro
- Pensacola-Ferry Pass-Brent, FL
- Population (ZIP)
- 37,197
- Household income
- $77,222
- Rent vs Own
- Severe rent burden
- 590.0
Population outlook (Santa Rosa County) Hauer SSP2
- Today (2025)
- 195,978 people
- By 2030
- 209,782 · +7.0%
- By 2040
- 235,293 · +20.1%
- By 2050
- 256,408 · +30.8%
- By 2075
- 298,074 · +52.1%
- By 2100
- 303,216 · +54.7%
Race, ethnicity, and origin ACS 2023
- Neighborhood character
- Predominantly White (80%)
- Race & ethnicity
- White 80% Two or more races 7% Black 6% Hispanic / Latino 6% Asian 1%
- Hispanic origin (detail)
- Mexican 2% Puerto Rican 2%
- Common ancestry
- Italian 4% Lithuanian 3% Portuguese 2%
- Foreign-born
- 4% · Canada
- Languages at home
- 94% English-only · Spanish 4% Other Asian/Pacific 1%
Political lean MEDSL · Santa Rosa
- 2024 margin
- Solid R (+51.0) · D 24.1% · R 75.0%
- 2008→2024 swing
- -3.0pp toward R · 2008: -47.9pp · 2024: -51.0pp
- All cycles
- 2024: R+51.0 2020: R+46.5 2016: R+53.5 2012: R+52.6 2008: R+47.9
Not yet ingested
- Civics
- —
Market trends
- HPI YoY
- ▼ -51.06%
- Current HPI
- 287.7469
- Rent YoY
- ▲ 2.70%
- Metro
- Pensacola-Ferry Pass-Brent, FL
- State GDP YoY
- ▲ 3.28%
- F500 in state
- 36
Industry mix (Fortune 500 HQ in FL)
| Industry | F500 HQs | Revenue |
|---|---|---|
| Industrial Technology | 2 | $29B |
|
||
| Insurance | 2 | $17B |
|
||
| Retail | 1 | $60B |
|
||
| Technology Distribution | 1 | $58B |
|
||
| Homebuilding | 1 | $35B |
|
||
| Technology Manufacturing | 1 | $35B |
|
||
Price history
+63.0% since first listed9 events — show timeline
- 2026-05-21 Listed $225,000 PARMLS
- 2014-11-21 Sold (Public Records) $95,000 Public Records
- 2014-11-14 Sold (MLS) $95,000 PARMLS
- 2014-07-14 Listed $98,000 PARMLS
- 2009-07-23 Sold (MLS) $85,000 PARMLS
- 2009-04-21 Listed $87,500 PARMLS
- 2006-02-21 Listing Removed — PARMLS
- 2006-01-05 Listed $125,000 PARMLS
- 2005-05-10 Sold (Public Records) $138,000 Public Records
Property tax history
+1.9%/yrLatest (2025): $679 · +8.7% YoY. Source: county tax records.
Cash-flow waterfall
monthlySold comps — $/sqft
last 12 mo · ≤1 miLoading sold comps…