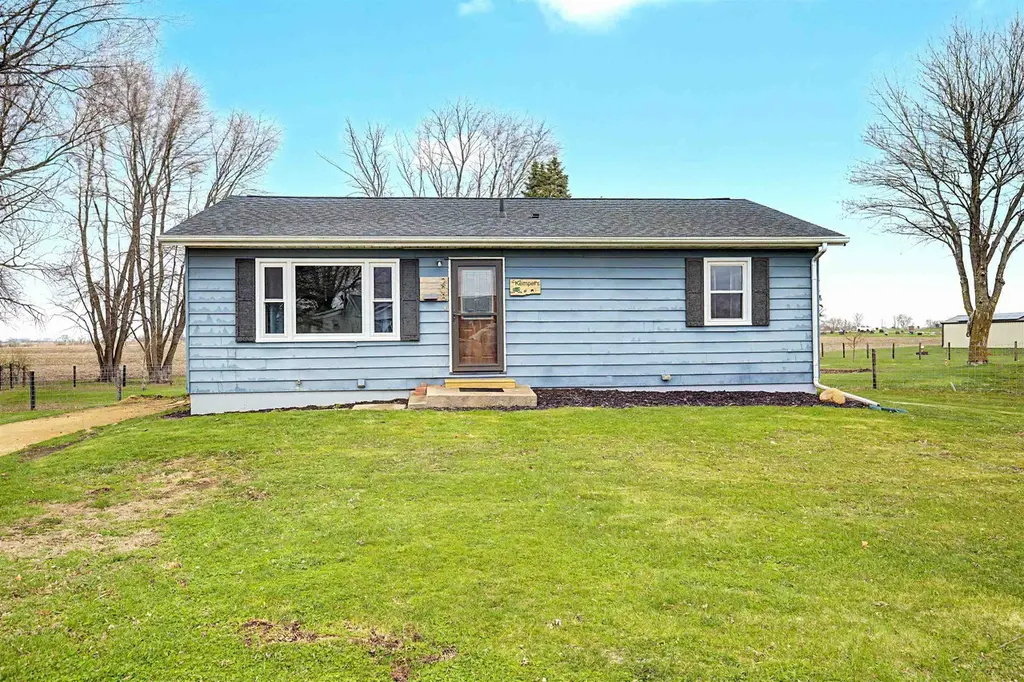
208 W Garfield St · Pearl City, IL
Flood risk 1/10 · Minimal
- FEMA flood zone
- X (unshaded)
- Chance of flooding over 30 yrs
- 0.0%
- Est. flood insurance / yr
- $473 – $860
Fire risk 1/10 · Minimal
- Est. fire insurance / yr
- $804 – $1,492
Heat risk 2/10 · Minimal
- Hot days now (above 101°F)
- 7 days/yr
- Hot days in 30 yrs
- 15 days/yr
Wind risk 2/10 · Minimal
- Chance of severe wind over 30 yrs
- —
Air-quality risk 2/10 · Minimal
- Unhealthy air days now
- 1 days/yr
- Unhealthy air days in 30 yrs
- 1 days/yr
Risk factors via First Street. Map © Google.
Why this score? — see what drove the B+ grade
The composite is a weighted blend of 9 inputs, each scored 0–100. Each bar is that input's sub-score; the figure is the points it added to the 100-point composite (weight × sub-score).
- Cash flow +26.2/30.0
- ARV discount +15.0/15.0
- DSCR +8.9/10.0
- Appreciation +8.4/10.0
- 1% rule +7.2/10.0
- Livability +3.5/5.0
- Schools +3.0/10.0
- Rent growth +2.5/5.0
- Condition / age +2.5/5.0
$119,900
🖨 Deal sheet (PDF) 📄 Offer letter ✓ Due diligence
Listing remarks MLS
Reduced over $20,000 ! 3 Br ranch, move-in ready other than flooring, situated on quiet dead end street near park and schools. Newer siding and roof. Large ( 1.2 acre ) lot backs up to a field for privacy. No offer not considered. $1,000 carpet allowance offered at successful closing.
Key facts
- Renovated kitchen
- Open living space
- Cul-de-sac
Tags
Neighborhood map
What this means for you Summary
Snapshot
- This is a 3-bed/1.0-bath single-family listed at $120k.
Deal economics
- At list price, monthly cash flow is $307 ($4k/yr) — positive.
- The deal already cash-flows at list — no discount required.
- Meets the 1% rule at list price ($1k rent vs $120k).
Location & tenants
- Location reads 69/100 on livability (#437 in IL) — a middle-class / working-renter tenant base. Strengths: cost of living A+, housing A+, employment A-; Watch: crime D+, amenities F, commute F.
- Pearl City CUSD 200 (rural): math 35% / reading 33% proficiency, ranked #191 of 620 in IL (top 31%) — families likely to look elsewhere, expect single-tenant / working-renter base with shorter leases.
- Zoned schools: Pearl City High School (math 34% / reading 15%, grade F, #252 of 693 statewide, top 37%, 137 students, 0% FRL) — zoned schools average 0% FRL vs 22% district-wide (22 pts lower); this property's tenant base skews higher-income than the district average.
- Market conditions: 9 active listings in the ZIP; 7 units permitted in Stephenson County in 2024 (0 in 5+ unit buildings).
Forward outlook
- In year one you build about $9k of equity ($829 loan paydown + $8k appreciation (6.9% local appreciation)).
- Stephenson County population projected at -29% by 2050 — secular population decline; favor cash flow + early exit over multi-decade hold.
- At projected returns (6.9% appreciation + 3.0% rent growth), your $34k cash investment doubles in ~3 years — after that, you're playing with house money.
- By year 4, paydown + projected appreciation supports a ~$31k cash-out refi (75% LTV) — recoverable capital for the next deal without selling this one.
Negotiation context
- Only 8 days on market — expect competitive offers; lowballing is unlikely to land.
- 2 sale attempts since 12y ago with the ask held roughly flat each time — persistent listings suggest the price (not the market) is what's stuck; bring a comps-based counter.
- Current owner paid $41k; list at $120k implies a 192% gain — meaningful room to come down on a strong offer.
Questions for the listing agent
- Built in 1974 — when were the roof, HVAC, electrical panel, plumbing, and water heater last replaced?
- Is there a deadline driving the sale (1031 exchange, divorce, estate, relocation)? That informs how much negotiation room exists.
- Crime grade is D in this area — have there been break-ins, vandalism, or insurance claims at this property in the last 3 years? What carrier currently insures it and at what premium?
- What's the average days-on-market for RENTAL listings here right now (not sales)? A rising rental-DOM trend means longer vacancies and softer asking-rent achievability than the comps imply.
- What's the recent tenant-quality profile in this submarket — average credit score on applications, eviction rate, late-payment / NSF rate, and stable-employment percentage? A property-management company in the area should have these aggregated.
- How much new for-sale + rental construction is in the pipeline within 1–3 miles? Heavy new supply typically softens prices + rents 12–24 months out; constrained supply supports both.
Investment metrics
- 1% rule
- 1.22% ✓
- Cap rate
- 9.36%
- Cash-on-cash
- 10.96%
- DSCR
- 1.49
- GRM
- 6.8
CMA / ARV
- ARV (on-the-fly)
- $188,328
- Comps found
- 2
Show comp detail 2 sales within ~0.75 mi
| Address | Dist | Beds/Ba | Sqft | Sold | Price | $/sf | Match |
|---|---|---|---|---|---|---|---|
| 208 W Garfield St | 0.00mi | 3/1.0 | 1,064 (0%) | 0mo | $115,000 | $108 | 100 |
| 312 W Garfield St | 0.06mi | 3/1.0 | 960 (-10%) | 4mo | $170,000 | $177 | 77 |
Match score weights: distance 35% · size 25% · config 20% · recency 20%. Top-matched comps best support the ARV.
Projected returns pro-forma
6.86% appreciation · 3.0% rent growth · sell at horizon
- IRR
- 26.2%
- Equity multiple
- 2.80×
- Total profit
- $60,375
- Equity at exit
- $81,958
- IRR
- 24.1%
- Equity multiple
- 5.80×
- Total profit
- $161,058
- Equity at exit
- $154,671
Cash invested: $33,572 (down + closing). Projections, not guarantees.
Landlord ↔ Tenant lean methodology
- Overall (STATE)
- 43 Moderately Tenant-Leaning
- State Illinois
- 43 Moderately Tenant-Leaning · D+7
- County
- — inherits STATE
- City
- — inherits STATE
ZIP-level market 61062
- Home prices YoY
- 2.8%
- Active inventory
- 9
- Price-to-rent
- 6.8×
Monthly cashflow live
- Estimated rent
- $1,461 medium interval (Pro) →
- Mortgage (P&I)
- −$629
- Tax from tax record
- −$169 /mo · $2,024/yr
- Insurance
- −$50
- HOA
- −$0
- Vacancy / Maint / Mgmt
- −$307
- Net cashflow
- $307
Break-even live
Sensitivity live
| Price | -10% $375 | -5% $341 | +0% $307 | +5% $273 | +10% $239 |
|---|---|---|---|---|---|
| Rent | -10% $191 | -5% $249 | +0% $307 | +5% $364 | +10% $422 |
| Rate | -1.0pp $367 | -0.5pp $337 | base $307 | +0.5pp $276 | +1.0pp $244 |
UW: 25.0% down · 7.5% · 30yr · 1.5% tax · 5.0% vac · 8.0% maint · 8.0% mgmt
Financing live
Cash to close
- Down payment
- $29,975
- Closing costs
- $3,597
- Reserves months
- —
- Total cash needed
- —
Loan-product check · same deal, 3 products live
Conventional
25% down · 7.5% · 30yr
- Down + closing
- —
- Monthly P&I
- —
- Monthly cashflow
- —
- DSCR
- —
- Eligible?
- —
Personal DTI + credit; lowest rate.
DSCR
20% down · 8.5% · 30yr
- Down + closing
- —
- Monthly P&I
- —
- Monthly cashflow
- —
- DSCR
- —
- Eligible?
- —
No personal income docs; deal must DSCR.
Hard money
10% down · 12.0% · 12mo
- Down + closing
- —
- Monthly P&I
- —
- Monthly cashflow
- —
- DSCR
- —
- Eligible?
- —
Short-term bridge; refi at stabilization.
Listing history 8 events
-
2026-04-22status Pending
-
2026-04-14$119,900 Active
-
2025-10-21price $124,900
-
2025-08-26price $130,900
-
2025-08-14price $135,900
-
2015-04-30soldstatus $41,000
-
2015-04-26soldstatus $41,000 285-char remark
Show marketing remark (285 chars)
Reduced over $20,000 ! 3 Br ranch, move-in ready other than flooring, situated on quiet dead end street near park and schools. Newer siding and roof. Large ( 1.2 acre ) lot backs up to a field for privacy. No offer not considered. $1,000 carpet allowance offered at successful closing.
-
2014-09-03$47,900 285-char remark
Show marketing remark (285 chars)
Reduced over $20,000 ! 3 Br ranch, move-in ready other than flooring, situated on quiet dead end street near park and schools. Newer siding and roof. Large ( 1.2 acre ) lot backs up to a field for privacy. No offer not considered. $1,000 carpet allowance offered at successful closing.
ⓘ Source: listings_history table (triggers on properties + properties_extension) + one-shot
backfill from property_details.listing_events for pre-trigger history.
Tax reassessment forecast IL · Partial reset (capped growth)
- Current annual tax
- $2,024 · $169/mo
- Projected year-2 tax
- $2,373 · $198/mo
- Expected delta
- +$349/yr (+$29/mo · 17.2%)
ⓘ Screening estimate from a state-policy table — verify with the county assessor before closing.
Climate risk First Street
- Flood 1/10 Low FEMA zone X (unshaded) · 0% chance over 30 yrs
- Wildfire 1/10 Low
- Heat 2/10 Low 7 d/yr ≥101°F today · 15 d/yr by 30 yrs out
- Wind 2/10 Low
- Air quality 2/10 Low 1 unhealthy d/yr today · 1 by 30 yrs out
Nearby sold comps map
Loading sold comps map…
Walkable amenities ~0.75 mi
Loading nearby amenities…
Taxation est. · year 1
- Rental income
- $17,531
- − Mortgage interest
- −$6,716
- − Property taxes
- −$2,024
- − Insurance
- −$600
- − Repairs & maintenance
- −$1,403
- − Management
- −$1,403
- − Depreciation
- −$3,488
- Taxable income
- $1,898
- Est. tax owed @ 24.0%
- −$456
- After-tax cash flow
- $3,225/yr
For passive investors: Depreciation is non-cash, so a rental often shows a tax loss while cash-flowing — sheltering income. Rental losses are passive: they offset passive income freely, and up to $25,000/yr can offset ordinary (W-2) income if you actively participate and your MAGI is under $100k (phasing out to $0 by $150k); unused losses carry forward. On sale, claimed depreciation is recaptured at up to 25%, and gains may owe capital-gains tax (a 1031 exchange can defer both). Figures are a year-1 estimate at your 24.0% rate — not tax advice; consult a CPA.
Schools (NCES district)
- District
- Pearl City CUSD 200
- NCES district ID
- 1731020
- Math proficiency
- 35% ▼ -8.00%
- Reading proficiency
- 33% ▼ -15.00%
- Median HH income
- $59,208
- Composite
- 30.41/100
- National rank
- #6247
- State rank
- #191 of 620 in IL
Livability — Pearl City
- Score
- 69/100
- State rank
- #437
- US rank
- #8917
Category grades
Schools grade is shown separately in the Schools card above.
Census & demographics
- Census place
- Pearl City, IL
- Population (ZIP)
- 1,881
Population outlook (Stephenson County) Hauer SSP2
- Today (2025)
- 41,802 people
- By 2030
- 39,487 · -5.5%
- By 2040
- 34,534 · -17.4%
- By 2050
- 29,693 · -29.0%
- By 2075
- 21,196 · -49.3%
- By 2100
- 14,596 · -65.1%
Race, ethnicity, and origin ACS 2023
- Neighborhood character
- Predominantly White (91%)
- Race & ethnicity
- White 91% Hispanic / Latino 5% Black 4% Two or more races 2%
- Common ancestry
- Iranian 6% Italian 3% Romanian 1%
- Foreign-born
- 3% · Canada
- Languages at home
- 92% English-only · Spanish 4% German/W. Germanic 3%
Political lean MEDSL · Stephenson
- 2024 margin
- R (+19.4) · D 39.5% · R 58.9% · Other 1.6%
- 2008→2024 swing
- -26.1pp toward R · 2008: 6.7pp · 2024: -19.4pp
- All cycles
- 2024: R+19.4 2020: R+15.7 2016: R+17.0 2012: R+4.6 2008: D+6.7
Not yet ingested
- Civics
- —
Market trends
- HPI YoY
- ▲ 6.86%
- Current HPI
- 251.0511
- Rent YoY
- —
- Metro
- —
- State GDP YoY
- ▲ 1.59%
- F500 in state
- 60
Industry mix (Fortune 500 HQ in IL)
| Industry | F500 HQs | Revenue |
|---|---|---|
| Insurance | 4 | $201B |
|
||
| Consumer Goods | 4 | $87B |
|
||
| Industrial Machinery | 3 | $64B |
|
||
| Healthcare | 2 | $55B |
|
||
| Retail / Pharmacy | 1 | $148B |
|
||
| Agriculture / Food | 1 | $86B |
|
||
Price history
+150.3% since first listed8 events — show timeline
- 2026-04-22 Pending — NWIAR
- 2026-04-14 Listed $119,900 NWIAR
- 2025-10-21 Price Changed $124,900 NWIAR
- 2025-08-26 Price Changed $130,900 NWIAR
- 2025-08-14 Price Changed $135,900 NWIAR
- 2015-04-30 Sold (Public Records) $41,000 Public Records
- 2015-04-26 Sold (MLS) $41,000 NWIAR
- 2014-09-03 Listed $47,900 NWIAR
Property tax history
+1.5%/yrLatest (2024): $2,024 · +9.3% YoY. Source: county tax records.
Cash-flow waterfall
monthlySold comps — $/sqft
last 12 mo · ≤1 miLoading sold comps…