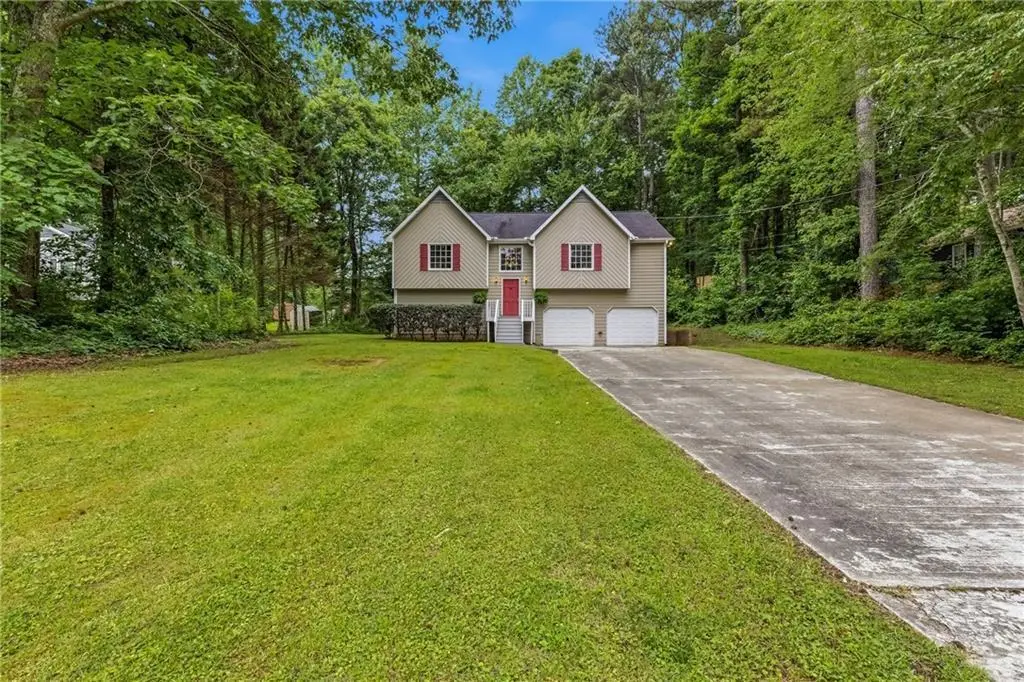
94 Hollis Cir · Hiram, GA
Flood risk 1/10 · Minimal
- FEMA flood zone
- X (unshaded)
- Chance of flooding over 30 yrs
- 0.0%
- Est. flood insurance / yr
- $473 – $860
Fire risk 4/10 · Minor
- Est. fire insurance / yr
- $963 – $1,789
Heat risk 5/10 · Moderate
- Hot days now (above 104°F)
- 7 days/yr
- Hot days in 30 yrs
- 18 days/yr
Wind risk 4/10 · Minor
- Chance of severe wind over 30 yrs
- 16.0%
Air-quality risk 4/10 · Minor
- Unhealthy air days now
- 4 days/yr
- Unhealthy air days in 30 yrs
- 5 days/yr
Risk factors via First Street. Map © Google.
Why this score? — see what drove the D grade
The composite is a weighted blend of 9 inputs, each scored 0–100. Each bar is that input's sub-score; the figure is the points it added to the 100-point composite (weight × sub-score).
- Cash flow +14.5/30.0
- ARV discount +11.9/15.0
- DSCR +4.4/10.0
- Schools +3.6/10.0
- Livability +3.4/5.0
- 1% rule +2.7/10.0
- Condition / age +2.5/5.0
- Rent growth +1.8/5.0
- Appreciation +0.0/10.0
$285,000
🖨 Deal sheet (PDF) 📄 Offer letter ✓ Due diligence
Listing remarks
Stop renting and start building equity! This move-in-ready Dallas gem is the perfect opportunity for a homebuyer looking for a solid, reliable home with NO HOA restrictions. Bring your work truck, camper, or hobby gear! Inside, you are greeted by a bright, freshly painted interior and brand-new flooring throughout the main living areas. The kitchen and bathrooms are clean and fully functional, featuring a brand-new electric stove and brand-new garage doors and openers. What truly makes this the ultimate starter home is the incredible peace of mind behind the scenes. You get a top-tier AquaGuard sump pump system with a transferable lifetime warranty for a completely dry lower level, a wat
Key facts
- 0.54 acre lot
- 2 garage spots
- Built 1989
Property features AI
Exterior
- Parking: 2-car garage with garage door opener, garage faces front
- Utilities: Public water; Septic tank sewer; 110V and 220V electric service; Cable available; Electricity available; Natural gas available; Phone available; Water available
- Home design: Three or more levels; Resale property
- Construction: Composition roof; Slab foundation; Built with other exterior materials
- Exterior features: Private yard; Deck; Front porch; Rear porch
Interior
- Kitchen: Eat-in kitchen with stained cabinets; Breakfast room; Laminate counters; Electric oven; Dishwasher
- Bedrooms: Oversized master bedroom; Two main-level bedrooms; Two lower-level bedrooms
- Flooring: Carpet; Hardwood; Laminate
- Bathrooms: Two full bathrooms; One half bathroom; Main level has one full and one half bath; Lower level includes one full bath; Master bath with separate tub and shower and a soaking tub
- Heating & cooling: Central heating; Central air conditioning
- Interior features: Two-story entrance foyer; One fireplace located in the family room; Wood window frames; No shared/common walls
- Laundry & utility: Laundry room located on the lower level
Neighborhood map
What this means for you Summary
Snapshot
- This is a 4-bed/2.0-bath single-family listed at $285k.
Deal economics
- At list price, monthly cash flow is $61 ($729/yr) — positive.
- The deal already cash-flows at list — no discount required.
- To meet the 1% rule (rent ≥ 1% of price), the offer needs to be $219k (23.0% below list).
- Recommended offer: $219k (23.0% below list) — sets the bar for 1% rule.
- Cap rate 6.5% vs local median 3.8% in Hiram — top-decile yield for the area; either an underpriced asset or a hidden risk that comps aren't pricing in. Stress-test before assuming the spread holds.
Location & tenants
- Location reads 68/100 on livability (#152 in GA) — a middle-class / working-renter tenant base. Strengths: employment A+, cost of living A+, housing A+; Watch: amenities D+, crime F, commute F.
- Paulding County (suburban): math 39% / reading 42% proficiency, ranked #33 of 174 in GA (top 19%) — families likely to look elsewhere, expect single-tenant / working-renter base with shorter leases.
- Zoned schools: C. A. Roberts Elementary School (math 53% / reading 48%, grade D+, #249 of 1,228 statewide, top 21%, 677 students, 45% FRL); East Paulding Middle School (math 39% / reading 46%, grade D-, #122 of 470 statewide, top 26%, 858 students, 39% FRL); East Paulding High School (math 11% / reading 31%, grade F, #225 of 424 statewide, top 54%, 1,905 students, 38% FRL).
- Market conditions: Rents soft (-2.8%/yr); 598 active listings in the ZIP; 6 comparable units currently listed for rent nearby; rentals at typical pace (median 25d on market — plan ~3-4 weeks tenant-placement turnaround); solid renter incomes; 1,458 units permitted in Paulding County in 2024 (0 in 5+ unit buildings).
Forward outlook
- Local home prices are declining (-3.0%/yr); year-one equity from $2k of loan paydown is wiped out by about $9k of value loss. Plan a longer hold.
- Paulding County population projected at +24% by 2050 — long-run rental-demand tailwind backs the buy-and-hold thesis.
Negotiation context
- Only 7 days on market — expect competitive offers; lowballing is unlikely to land.
Risks & watch-outs
- Climate carrying-cost: extreme-heat days projected 7→18/yr by 2055 (HVAC capex compounding) — expect insurance premiums to compound above CPI over the hold.
Questions for the listing agent
- Is there a deadline driving the sale (1031 exchange, divorce, estate, relocation)? That informs how much negotiation room exists.
- Schools are D-rated, which usually means shorter tenancies and higher turnover. Who's the typical renter profile here, and what's been the actual vacancy rate?
- Crime grade is F in this area — have there been break-ins, vandalism, or insurance claims at this property in the last 3 years? What carrier currently insures it and at what premium?
- The area grade is low — what's the realistic commute time and amenity access for the typical tenant pool here? Any planned neighborhood developments (good or bad) we should know about?
- What's the average days-on-market for RENTAL listings here right now (not sales)? A rising rental-DOM trend means longer vacancies and softer asking-rent achievability than the comps imply.
- What's the recent tenant-quality profile in this submarket — average credit score on applications, eviction rate, late-payment / NSF rate, and stable-employment percentage? A property-management company in the area should have these aggregated.
- How much new for-sale + rental construction is in the pipeline within 1–3 miles? Heavy new supply typically softens prices + rents 12–24 months out; constrained supply supports both.
Investment metrics
- 1% rule
- 0.77% ✗
- Cap rate
- 6.55%
- Cash-on-cash
- 0.91%
- DSCR
- 1.04
- GRM
- 10.8
CMA / ARV
- ARV (on-the-fly)
- $315,590
- Comps found
- 12
Show comp detail 12 sales within ~0.75 mi
| Address | Dist | Beds/Ba | Sqft | Sold | Price | $/sf | Match |
|---|---|---|---|---|---|---|---|
| 263 Hollis Cir | 0.13mi | 3/2.0 (-1) | 1,514 (+0%) | 2mo | $305,000 | $201 | 86 |
| 130 Crestwood Dr | 0.24mi | 3/2.0 (-1) | 1,540 (+2%) | 6mo | $298,900 | $194 | 76 |
| 189 Hollis Cir | 0.12mi | 3/2.0 (-1) | 1,567 (+4%) | 9mo | $328,000 | $209 | 75 |
| 277 Hope Dr | 0.18mi | 3/2.0 (-1) | 1,434 (-5%) | 10mo | $273,000 | $190 | 70 |
| 160 Summer Lake Dr | 0.55mi | 3/2.0 (-1) | 1,451 (-4%) | 8mo | $315,000 | $217 | 56 |
| 134 Summer Lake Dr | 0.55mi | 3/2.0 (-1) | 1,442 (-4%) | 7mo | $320,000 | $222 | 56 |
| 86 Kelly Ct | 0.29mi | 3/2.0 (-1) | 1,352 (-10%) | 10mo | $282,000 | $209 | 56 |
| 64 Lakeview Pt | 0.55mi | 3/2.0 (-1) | 1,618 (+7%) | 3mo | $389,990 | $241 | 55 |
| 64 Acorn Dr | 0.63mi | 3/1.5 (-1) | 1,523 (+1%) | 10mo | $242,700 | $159 | 54 |
| 85 Lakeview Pt | 0.56mi | 3/2.0 (-1) | 1,618 (+7%) | 5mo | $369,990 | $229 | 53 |
| 11 Fern Leaf Ct | 0.71mi | 3/2.0 (-1) | 1,608 (+6%) | 1mo | $350,000 | $218 | 50 |
| 440 Gunnell Rd | 0.67mi | 3/2.5 (-1) | 1,362 (-10%) | 4mo | $265,000 | $195 | 42 |
Match score weights: distance 35% · size 25% · config 20% · recency 20%. Top-matched comps best support the ARV.
Projected returns pro-forma
-3.0% appreciation · 0.0% rent growth · sell at horizon
- IRR
- -17.8%
- Equity multiple
- 0.39×
- Total profit
- $-48,892
- Equity at exit
- $42,494
- IRR
- -15.9%
- Equity multiple
- 0.21×
- Total profit
- $-63,046
- Equity at exit
- $24,642
Cash invested: $79,800 (down + closing). Projections, not guarantees.
Landlord ↔ Tenant lean methodology
- Overall (STATE)
- 90 Strongly Landlord-Friendly
- State Georgia
- 90 Strongly Landlord-Friendly · R+3
- County
- — inherits STATE
- City
- — inherits STATE
ZIP-level market 30157
- Home prices YoY
- -9.4%
- Rents YoY
- -2.8%
- Active inventory
- 598
- Price-to-rent
- 10.8×
Monthly cashflow live
- Estimated rent
- $2,194 high interval (Pro) →
- Mortgage (P&I)
- −$1,495
- Tax from tax record
- −$59 /mo · $708/yr
- Insurance
- −$119
- HOA
- −$0
- Vacancy / Maint / Mgmt
- −$461
- Net cashflow
- $61
Break-even live
Sensitivity live
| Price | -10% $222 | -5% $141 | +0% $61 | +5% $-20 | +10% $-101 |
|---|---|---|---|---|---|
| Rent | -10% $-113 | -5% $-26 | +0% $61 | +5% $147 | +10% $234 |
| Rate | -1.0pp $204 | -0.5pp $133 | base $61 | +0.5pp $-13 | +1.0pp $-88 |
UW: 25.0% down · 7.5% · 30yr · 1.5% tax · 5.0% vac · 8.0% maint · 8.0% mgmt
Financing live
Cash to close
- Down payment
- $71,250
- Closing costs
- $8,550
- Reserves months
- —
- Total cash needed
- —
Loan-product check · same deal, 3 products live
Conventional
25% down · 7.5% · 30yr
- Down + closing
- —
- Monthly P&I
- —
- Monthly cashflow
- —
- DSCR
- —
- Eligible?
- —
Personal DTI + credit; lowest rate.
DSCR
20% down · 8.5% · 30yr
- Down + closing
- —
- Monthly P&I
- —
- Monthly cashflow
- —
- DSCR
- —
- Eligible?
- —
No personal income docs; deal must DSCR.
Hard money
10% down · 12.0% · 12mo
- Down + closing
- —
- Monthly P&I
- —
- Monthly cashflow
- —
- DSCR
- —
- Eligible?
- —
Short-term bridge; refi at stabilization.
Rent comps 6 comps
| Address | Beds | Baths | Sqft | Rent | $/sqft | DOM | Units | Dist |
|---|---|---|---|---|---|---|---|---|
| 209 Kelly Ct Dallas, GA | 4.0 | 2.0 | 1661 | $1,711 | $1.03 | 25d | 1 | 0.21mi |
| 87 Acorn Dr Dallas, GA | 3.0 | 2.0 | 1209 | $1,900 | $1.57 | 44d | 1 | 0.66mi |
| 97 Summer Creek Dr Dallas, GA | 4.0 | 3.0 | 1614 | $2,095 | $1.30 | 5d | 1 | 0.70mi |
| 118 Jade Ln Dallas, GA | 3.0 | 2.5 | 1790 | $2,000 | $1.12 | 44d | 1 | 0.86mi |
| 167 Bickers Rd Dallas, GA | 3.0 | 2.5 | 1676 | $2,250 | $1.34 | 22d | 1 | 0.96mi |
| 335 Lost Meadows Dr Dallas, GA | 3.0 | 2.0 | 2214 | $1,686 | $0.76 | 13d | 1 | 0.99mi |
Listing history 6 events
-
2026-06-13statusdays on market $285,000 Pending 7 DOM
-
2026-06-09statusdays on market $285,000 Active Under Contract 5 DOM
-
2026-06-08days on market $285,000 Active 4 DOM
-
2026-06-07days on market $285,000 Active 3 DOM
-
2026-06-04remarks 699-char remark
-
2026-06-04$285,000 Active 1 DOM
ⓘ Source: listings_history table (triggers on properties + properties_extension) + one-shot
backfill from property_details.listing_events for pre-trigger history.
Tax reassessment forecast GA · Resets to sale price
- Current annual tax
- $708 · $59/mo
- Projected year-2 tax
- $2,622 · $218/mo
- Expected delta
- +$1,914/yr (+$160/mo · 270.6%)
ⓘ Screening estimate from a state-policy table — verify with the county assessor before closing.
Climate risk First Street
- Flood 1/10 Low FEMA zone X (unshaded) · 0% chance over 30 yrs
- Wildfire 4/10 Moderate
- Heat 5/10 Major 7 d/yr ≥104°F today · 18 d/yr by 30 yrs out
- Wind 4/10 Moderate 16% chance of damaging wind over 30 yrs
- Air quality 4/10 Moderate 4 unhealthy d/yr today · 5 by 30 yrs out
Nearby sold comps map
Loading sold comps map…
Walkable amenities ~0.75 mi
Loading nearby amenities…
Taxation est. · year 1
- Rental income
- $26,324
- − Mortgage interest
- −$15,964
- − Property taxes
- −$708
- − Insurance
- −$1,425
- − Repairs & maintenance
- −$2,106
- − Management
- −$2,106
- − Depreciation
- −$8,291
- Taxable loss
- −$4,275
- Est. tax savings @ 24.0%
- +$1,026
- After-tax cash flow
- $1,755/yr
For passive investors: Depreciation is non-cash, so a rental often shows a tax loss while cash-flowing — sheltering income. Rental losses are passive: they offset passive income freely, and up to $25,000/yr can offset ordinary (W-2) income if you actively participate and your MAGI is under $100k (phasing out to $0 by $150k); unused losses carry forward. On sale, claimed depreciation is recaptured at up to 25%, and gains may owe capital-gains tax (a 1031 exchange can defer both). Figures are a year-1 estimate at your 24.0% rate — not tax advice; consult a CPA.
Schools (NCES district)
- District
- Paulding County
- NCES district ID
- 1304020
- Math proficiency
- 39% ▼ -6.00%
- Reading proficiency
- 42% ▼ -7.00%
- Median HH income
- $61,447
- Composite
- 36.0/100
- National rank
- #4784
- State rank
- #33 of 174 in GA
Livability — Hiram
- Score
- 68/100
- State rank
- #152
- US rank
- #9861
Category grades
Schools grade is shown separately in the Schools card above.
Census & demographics
- County
- Paulding County · 134,013 people
- City population
- 27,220
- Metro
- Atlanta-Sandy Springs-Alpharetta, GA
- Population (ZIP)
- 53,445
- Household income
- $93,625
- Rent vs Own
- Severe rent burden
- 375.0
Population outlook (Paulding County) Hauer SSP2
- Today (2025)
- 175,714 people
- By 2030
- 186,082 · +5.9%
- By 2040
- 204,414 · +16.3%
- By 2050
- 217,040 · +23.5%
- By 2075
- 236,980 · +34.9%
- By 2100
- 238,314 · +35.6%
Race, ethnicity, and origin ACS 2023
- Neighborhood character
- Predominantly White (72%)
- Race & ethnicity
- White 72% Black 13% Two or more races 9% Hispanic / Latino 8% Asian 1%
- Hispanic origin (detail)
- Mexican 3% Puerto Rican 2%
- Common ancestry
- Lithuanian 2% Italian 2% Slovak 1%
- Foreign-born
- 5% · Canada
- Languages at home
- 93% English-only · Spanish 5% French/Haitian/Cajun 1% Other Asian/Pacific 1%
Political lean MEDSL · Paulding
- 2024 margin
- Strong R (+24.1) · D 37.6% · R 61.7%
- 2008→2024 swing
- +14.4pp toward D · 2008: -38.5pp · 2024: -24.1pp
- All cycles
- 2024: R+24.1 2020: R+29.1 2016: R+41.2 2012: R+43.6 2008: R+38.5
Not yet ingested
- Civics
- —
Market trends
- HPI YoY
- ▼ -34.28%
- Current HPI
- 330.3487
- Rent YoY
- ▼ -2.83%
- Metro
- Atlanta-Sandy Springs-Alpharetta, GA
- State GDP YoY
- ▲ 2.66%
- F500 in state
- 28
Industry mix (Fortune 500 HQ in GA)
| Industry | F500 HQs | Revenue |
|---|---|---|
| Paper / Packaging | 2 | $29B |
|
||
| Retail | 1 | $160B |
|
||
| Transportation / Logistics | 1 | $91B |
|
||
| Airlines | 1 | $62B |
|
||
| Consumer Goods | 1 | $47B |
|
||
| Utilities | 1 | $25B |
|
||
Price history
+0.0% since first listed2 events — show timeline
- 2026-06-04 Listed $285,000 FMLS
- 2026-06-03 Coming Soon $285,000 FMLS
Property tax history
-3.8%/yrLatest (2025): $708 · -53.9% YoY. Source: county tax records.
Cash-flow waterfall
monthlySold comps — $/sqft
last 12 mo · ≤1 miLoading sold comps…