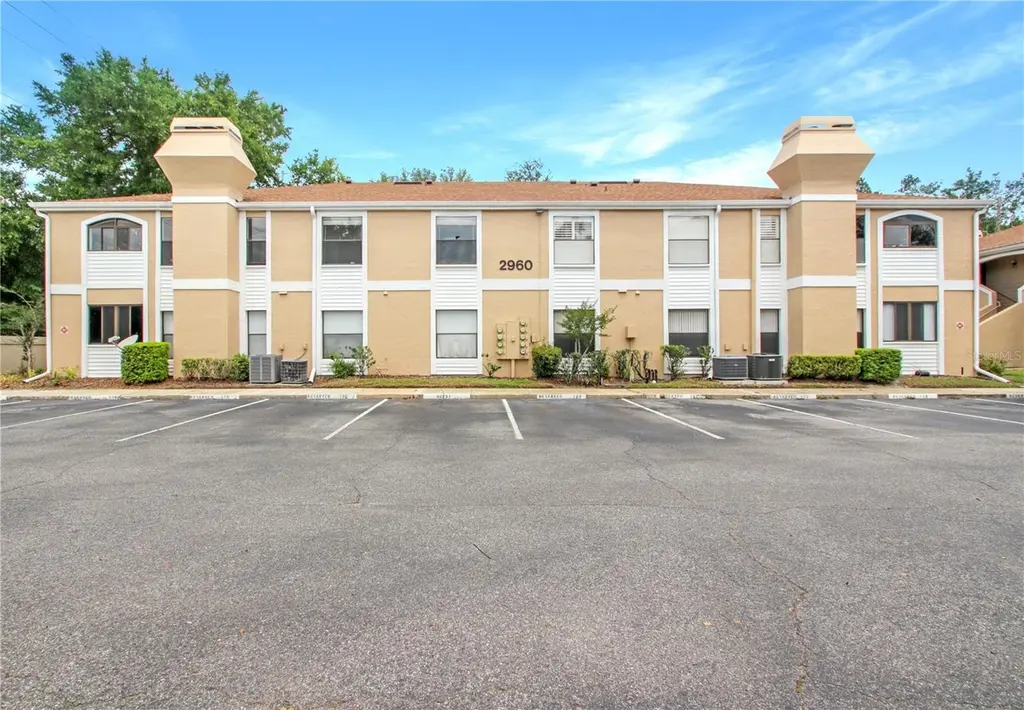
2960 S Semoran Blvd #1503 · Orlando, FL
Flood risk No data
- FEMA flood zone
- —
- Chance of flooding over 30 yrs
- —
- Est. flood insurance / yr
- —
Fire risk No data
- Est. fire insurance / yr
- —
Heat risk No data
- Hot days now (above threshold)
- —
- Hot days in 30 yrs
- —
Wind risk No data
- Chance of severe wind over 30 yrs
- —
Air-quality risk No data
- Unhealthy air days now
- —
- Unhealthy air days in 30 yrs
- —
Risk factors via First Street. Map © Google.
Why this score? — see what drove the C- grade
The composite is a weighted blend of 9 inputs, each scored 0–100. Each bar is that input's sub-score; the figure is the points it added to the 100-point composite (weight × sub-score).
- Cash flow +15.4/30.0
- 1% rule +9.7/10.0
- ARV discount +7.5/15.0
- DSCR +4.7/10.0
- Livability +4.3/5.0
- Schools +4.1/10.0
- Condition / age +2.5/5.0
- Rent growth +2.3/5.0
- Appreciation +0.0/10.0
$110,000
🖨 Deal sheet 📄 Offer letter ✓ Due diligence
Listing remarks
Conveniently located in the gated community of Wimbledon Park, this 2-bedroom, 2-bathroom condominium offers a functional 889 sq. ft. layout featuring a kitchen/family room combo. This residence provides an effortless, low-maintenance lifestyle as the monthly association fee includes water, sewer, and trash removal, along with exterior upkeep. Residents enjoy access to a full suite of resort-style amenities, including a sparkling community pool, clubhouse, on-site gym, and sports courts for tennis and racquetball. Perfectly positioned for easy commuting, you are minutes away from the Orlando International Airport (MCO) and major transit routes like the 408 and 528, with Downtown Orlando jus
Key facts
- Gated community
- Clubhouse
- Community pool
Tags
Property features AI
Finance
- Other: Buyer approval required for community; Unfurnished
- Financial info: Lease restrictions apply
- HOA & community: HOA managed by Morgan Property Solutions; Monthly condo fee: $239; Total monthly fees: $376 (includes condo fee); Total annual fees: $4,512; Association approval required; Monthly fee covers pool, sewer, water, trash, insurance, management, maintenance (grounds), and escrow reserves; Community amenities: clubhouse, fitness center, pool, tennis courts, sidewalks, community mailbox; Community has deed restrictions and vehicle restrictions; Pets allowed with restrictions (breed and size limits); cats and dogs allowed
Exterior
- Parking: No specific parking details provided
- Security: Gated community
- Utilities: Public water; Public sewer; Public utilities
- Home design: Residential condominium; Attached property; 2 total stories (unit on floor 1); East-facing
- Construction: Block and stucco construction; Shingle roof; Slab foundation; Built in a multi-story building (building number 2960)
- Exterior features: Enclosed patio/porch; Exterior lighting; Rain gutters; Sidewalk; Exterior storage; Mature landscaping with trees; Lot is cleared, landscaped and in city limits; Located on a cul-de-sac; Paved roads with private maintenance
Interior
- Kitchen: Dishwasher; Disposal; Microwave; Range; Refrigerator
- Bedrooms: 2 bedrooms
- Flooring: Ceramic tile
- Bathrooms: 2 full bathrooms
- Heating & cooling: Central heating; Central air conditioning
- Interior features: Ceiling fans; Eat-in kitchen; High ceilings; Living room / dining room combo; Open floorplan; Split bedroom layout; Fireplace in living room
- Laundry & utility: Washer hookup; Dryer hookup (electric); Laundry closet; Laundry inside unit
Neighborhood map
What this means for you Summary
Snapshot
- This is a 2-bed/2.0-bath condo listed at $110k.
Deal economics
- At list price, monthly cash flow is $43 ($517/yr) — positive.
- The deal already cash-flows at list — no discount required.
- Meets the 1% rule at list price ($2k rent vs $110k).
- Recommended offer: $108k (1.5% below list) — sets the bar for market timing.
- Cap rate 6.8% vs local median 3.0% in Orlando — top-decile yield for the area; either an underpriced asset or a hidden risk that comps aren't pricing in. Stress-test before assuming the spread holds.
Location & tenants
- Location reads 86/100 on livability (#12 in FL, #360 nationally) — a professional / high-income tenant draw. Strengths: amenities A+, commute A+, housing A+.
- Orange (suburban): math 46% / reading 51% proficiency, ranked #43 of 73 in FL (top 59%) — families likely to look elsewhere, expect single-tenant / working-renter base with shorter leases.
- Zoned schools: Lake George Elementary (math 54% / reading 50%, grade C-, #990 of 2,144 statewide, top 48%, 452 students, 58% FRL); William R Boone High (math 36% / reading 58%, grade D-, #207 of 667 statewide, top 32%, 2,780 students, 44% FRL).
- Market conditions: Rents soft (-0.7%/yr); 372 active listings in the ZIP; 40 comparable units currently listed for rent nearby; rentals at typical pace (median 15d on market — plan ~3-4 weeks tenant-placement turnaround); 8,053 units permitted in Orange County in 2024 (3,133 in 5+ unit buildings).
- This rent runs 34% of the median local income ($57k/yr) — at the standard rent-burdened threshold; future hikes will face affordability resistance.
Forward outlook
- Local home prices are declining (-3.0%/yr); year-one equity from $761 of loan paydown is wiped out by about $3k of value loss. Plan a longer hold.
- Orange County population projected at +52% by 2050 — long-run rental-demand tailwind backs the buy-and-hold thesis.
Negotiation context
- It's been on market 18 days — a 2% lower offer ($108k) is reasonable based on typical stale-listing flexibility.
- 3 sale attempts since 19y ago with the ask held roughly flat each time — persistent listings suggest the price (not the market) is what's stuck; bring a comps-based counter.
- Current owner paid $42k; list at $110k implies a 161% gain — meaningful room to come down on a strong offer.
Risks & watch-outs
- Watch-outs: property tax is 2.6% of price; HOA is 23% of rent.
Questions for the listing agent
- Property tax is high relative to price — has the assessment been appealed recently, and will the sale trigger a re-assessment?
- What does the HOA fee cover, when was the last increase, and are there any pending special assessments or reserve-fund shortfalls?
- Any open or pending special assessments — roof, HVAC, plumbing, elevator, façade? What's the per-unit balance and payoff schedule, and is the seller paying it off at close or rolling it to the buyer?
- Is there a deadline driving the sale (1031 exchange, divorce, estate, relocation)? That informs how much negotiation room exists.
- Schools are B-rated — typically a magnet for longer-tenancy family renters. What's the average tenant stay here, and is there a school-zone premium baked into asking?
- What's the average days-on-market for RENTAL listings here right now (not sales)? A rising rental-DOM trend means longer vacancies and softer asking-rent achievability than the comps imply.
- What's the recent tenant-quality profile in this submarket — average credit score on applications, eviction rate, late-payment / NSF rate, and stable-employment percentage? A property-management company in the area should have these aggregated.
- How much new apartment / multifamily construction is in the pipeline within 1–3 miles? Heavy new supply (>2% of stock underway) typically softens rents 12–24 months out; light construction supports rent growth.
Investment metrics
- 1% rule
- 1.47% ✓
- Cap rate
- 6.76%
- Cash-on-cash
- 1.68%
- DSCR
- 1.07
- GRM
- 5.7
CMA / ARV
No comps found within radius.
Projected returns pro-forma
-3.0% appreciation · 0.0% rent growth · sell at horizon
- IRR
- -18.9%
- Equity multiple
- 0.37×
- Total profit
- $-19,500
- Equity at exit
- $16,401
- IRR
- -26.8%
- Equity multiple
- 0.01×
- Total profit
- $-30,461
- Equity at exit
- $9,511
Cash invested: $30,800 (down + closing). Projections, not guarantees.
Landlord ↔ Tenant lean methodology
- Overall (STATE)
- 87 Strongly Landlord-Friendly
- State Florida
- 87 Strongly Landlord-Friendly · R+3
- County
- — inherits STATE
- City
- — inherits STATE
ZIP-level market 32822
- Home prices YoY
- -21.1%
- Rents YoY
- -0.7%
- Active inventory
- 372
- Price-to-rent
- 5.7×
Monthly cashflow live
- Estimated rent
- $1,615 high interval (Pro) →
- Mortgage (P&I)
- −$577
- Tax from tax record
- −$234 /mo · $2,811/yr
- Insurance
- −$46
- HOA
- −$376
- Vacancy / Maint / Mgmt
- −$339
- Net cashflow
- $43
Break-even live
UW: 25.0% down · 7.5% · 30yr · 1.5% tax · 5.0% vac · 8.0% maint · 8.0% mgmt
Financing live
Cash to close
- Down payment
- $27,500
- Closing costs
- $3,300
- Reserves months
- —
- Total cash needed
- —
Loan-product check · same deal, 3 products live
Conventional
25% down · 7.5% · 30yr
- Down + closing
- —
- Monthly P&I
- —
- Monthly cashflow
- —
- DSCR
- —
- Eligible?
- —
Personal DTI + credit; lowest rate.
DSCR
20% down · 8.5% · 30yr
- Down + closing
- —
- Monthly P&I
- —
- Monthly cashflow
- —
- DSCR
- —
- Eligible?
- —
No personal income docs; deal must DSCR.
Hard money
10% down · 12.0% · 12mo
- Down + closing
- —
- Monthly P&I
- —
- Monthly cashflow
- —
- DSCR
- —
- Eligible?
- —
Short-term bridge; refi at stabilization.
Rent comps 40 comps
| Address | Beds | Baths | Sqft | Rent | $/sqft | DOM | Units | Dist |
|---|---|---|---|---|---|---|---|---|
| 3100 S Semoran Blvd Unit 11 Orlando, FL | 2.0 | 2.0 | 966 | $1,700 | $1.76 | 23d | 1 | 0.04mi |
| 3284 S Semoran Blvd Orlando, FL | 2.0 | 2.0 | 1000 | $1,450 | $1.45 | 7d | 1 | 0.14mi |
| 3282 S Semoran Blvd #24 Orlando, FL | 1.0 | 1.0 | 629 | $1,295 | $2.06 | 3d | 1 | 0.15mi |
| 2948 S Semoran Blvd #1202 Orlando, FL | 1.0 | 1.0 | 925 | $900 | $0.97 | 23d | 1 | 0.17mi |
| 3211 S Semoran Blvd Orlando, FL | 1.0–3.0 | 1.0–2.0 | 880 | $1,699 | $1.93 | 2d | 12 | 0.17mi |
| 5550 E Michigan St Orlando, FL | 1.0–2.0 | 1.0–2.0 | 950 | $1,600 | $1.68 | 7d | 3 | 0.19mi |
| 5550 E Michigan St Orlando, FL | 2.0 | 2.0 | 1027 | $1,598 | $1.56 | 14d | 2 | 0.19mi |
| 5550 E Michigan St Orlando, FL | 1.0–2.0 | 1.0–2.0 | 913 | $1,600 | $1.75 | 19d | 3 | 0.19mi |
| 3312 S Semoran Blvd Orlando, FL | 3.0 | 1.0–2.0 | 820 | $1,809 | $2.21 | 2d | 15 | 0.23mi |
| 5436 E Michigan St Orlando, FL | 2.0 | 2.0 | 1114 | $1,775 | $1.59 | 16d | 2 | 0.24mi |
| 5436 E Michigan St Orlando, FL | 2.0 | 2.0 | 1114 | $1,725 | $1.55 | 4d | 1 | 0.24mi |
| 5452 E Michigan St Unit 5452-1 Orlando, FL | 2.0 | 2.0 | 1103 | $1,800 | $1.63 | 21d | 1 | 0.28mi |
| 5870 Sundown Cir Orlando, FL | 1.0–2.0 | 1.0–2.0 | 840 | $1,744 | $2.08 | 2d | 25 | 0.31mi |
| 5408 E Michigan St Orlando, FL | 1.0 | 1.0 | 851 | $1,388 | $1.63 | 23d | 2 | 0.32mi |
| 2053 Dixie Belle Dr Unit 2053J Orlando, FL | 3.0 | 2.0 | 993 | $1,550 | $1.56 | 23d | 1 | 0.41mi |
| 2053 Dixie Belle Dr Orlando, FL | 3.0 | 2.0 | 993 | $1,550 | $1.56 | 12d | 1 | 0.41mi |
| 5477 Lake Margaret Dr Orlando, FL | 2.0 | 2.0 | 919 | $1,750 | $1.90 | 21d | 1 | 0.44mi |
| 2451 Oak Park Way #120 Orlando, FL | 2.0 | 2.0 | 953 | $1,700 | $1.78 | 4d | 1 | 0.46mi |
| 5762 Folkstone Ln Orlando, FL | 1.0–3.0 | 1.0–2.0 | 1081 | $1,967 | $1.82 | 2d | 17 | 0.46mi |
| 2031 Dixie Belle Dr Unit 2031L Orlando, FL | 1.0 | 1.5 | 830 | $1,550 | $1.87 | 4d | 1 | 0.47mi |
| 2439 Oak Park Way #217 Orlando, FL | 2.0 | 2.0 | 953 | $1,650 | $1.73 | 2d | 1 | 0.48mi |
| 2065 Dixie Belle Dr Apt N Orlando, FL | 2.0 | 2.0 | 993 | $1,695 | $1.71 | 23d | 1 | 0.48mi |
| 2683 Oak Park Way #214 Orlando, FL | 2.0 | 2.0 | 950 | $1,700 | $1.79 | 23d | 1 | 0.48mi |
| 2365 Oak Park Way #109 Orlando, FL | 2.0 | 2.0 | 953 | $1,350 | $1.42 | 11d | 1 | 0.48mi |
| 3239 Candle Ridge Dr Orlando, FL | 2.0 | 2.0 | 914 | $2,100 | $2.30 | 23d | 1 | 0.49mi |
| 2019 Dixie Belle Dr Unit G Orlando, FL | 3.0 | 2.0 | 993 | $1,595 | $1.61 | 23d | 1 | 0.51mi |
| 5757 5 Flags Blvd Orlando, FL | 1.0–2.0 | 1.0–2.0 | 660 | $1,499 | $2.27 | 10d | 9 | 0.51mi |
| 3233 Candle Ridge Dr #101 Orlando, FL | 2.0 | 2.0 | 914 | $1,600 | $1.75 | 7d | 1 | 0.53mi |
| 5300 Lake Margaret Dr Orlando, FL | 2.0 | 1.0–2.0 | 729 | $1,765 | $2.42 | 2d | 38 | 0.54mi |
| 6031 Scotchwood Gln Orlando, FL | 2.0 | 2.0 | 846 | $1,625 | $1.92 | 23d | 2 | 0.54mi |
| 2025 Dixie Belle Dr Orlando, FL | 3.0 | 2.0 | 993 | $1,500 | $1.51 | 7d | 1 | 0.54mi |
| 3217 Westridge Blvd Orlando, FL | 2.0 | 2.0 | 914 | $1,800 | $1.97 | 14d | 1 | 0.54mi |
| 6043 Village Cir #6043 Orlando, FL | 2.0 | 1.5 | 860 | $1,550 | $1.80 | 17d | 1 | 0.56mi |
| 2013 Dixie Belle Dr Orlando, FL | 2.0–3.0 | 2.0 | 993 | $1,700 | $1.71 | 2d | 2 | 0.57mi |
| 2013 Dixie Belle Dr Unit 2013B Orlando, FL | 2.0 | 2.0 | 993 | $1,700 | $1.71 | 4d | 1 | 0.57mi |
| 6065 Village Cir #6065 Orlando, FL | 2.0 | 1.5 | 860 | $1,425 | $1.66 | 7d | 1 | 0.57mi |
| 6020 Village Cir N Orlando, FL | 2.0 | 1.5 | 825 | $1,390 | $1.68 | 23d | 1 | 0.57mi |
| 6032 Village Cir N #6032 Orlando, FL | 2.0 | 2.0 | 1022 | $1,800 | $1.76 | 23d | 1 | 0.58mi |
| 6077 Village Cir #6077 Orlando, FL | 2.0 | 2.0 | 1022 | $1,800 | $1.76 | 23d | 1 | 0.59mi |
| 2007 Dixie Belle Dr Unit 2007D Orlando, FL | 2.0 | 1.5 | 830 | $1,400 | $1.69 | 17d | 1 | 0.60mi |
HOA detail condo
- Monthly dues
- $376 · $4,512/yr
- Likely covers
- watersewertrashpoolgymsecurity
- Assessments
- None detected in remarks — confirm with the listing agent.
Listing history 9 events
-
2026-05-19status Pending
-
2026-05-01$110,000 Active
-
2022-06-13status Pending
-
2022-06-13$85,000 Active
-
2022-06-13historical
-
2008-04-02historical
-
2007-08-02$140,000
-
2001-05-08soldstatus $42,200
-
2001-05-08soldstatus $62,500
ⓘ Source: listings_history table (triggers on properties + properties_extension) + one-shot
backfill from property_details.listing_events for pre-trigger history.
Tax reassessment forecast FL · Resets to sale price
- Current annual tax
- $2,811 · $234/mo
- Projected year-2 tax
- $2,811 · $234/mo
- Expected delta
- $0/yr ($0/mo · 0.0%)
ⓘ Screening estimate from a state-policy table — verify with the county assessor before closing.
Nearby sold comps map
Loading sold comps map…
Walkable amenities ~0.75 mi
Loading nearby amenities…
Taxation est. · year 1
- Rental income
- $19,383
- − Mortgage interest
- −$6,162
- − Property taxes
- −$2,811
- − Insurance
- −$550
- − Repairs & maintenance
- −$1,551
- − Management
- −$1,551
- − HOA
- −$4,512
- − Depreciation
- −$3,200
- Taxable loss
- −$953
- Est. tax savings @ 24.0%
- +$229
- After-tax cash flow
- $746/yr
For passive investors: Depreciation is non-cash, so a rental often shows a tax loss while cash-flowing — sheltering income. Rental losses are passive: they offset passive income freely, and up to $25,000/yr can offset ordinary (W-2) income if you actively participate and your MAGI is under $100k (phasing out to $0 by $150k); unused losses carry forward. On sale, claimed depreciation is recaptured at up to 25%, and gains may owe capital-gains tax (a 1031 exchange can defer both). Figures are a year-1 estimate at your 24.0% rate — not tax advice; consult a CPA.
Schools (NCES district)
- District
- Orange
- NCES district ID
- 1201440
- Math proficiency
- 46% ▼ -9.00%
- Reading proficiency
- 51% ▼ -2.00%
- Median HH income
- $49,350
- Composite
- 41.47/100
- National rank
- #3461
- State rank
- #43 of 73 in FL
Livability — Orlando
- Score
- 86/100
- State rank
- #12
- US rank
- #360
Category grades
Schools grade is shown separately in the Schools card above.
Census & demographics
- Census place
- Orlando, FL
- County
- Orange County · 1,471,359 people
- City population
- 964,969
- Metro
- Orlando-Kissimmee-Sanford, FL
- Population (ZIP)
- 67,081
- Household income
- $56,540
- Rent vs Own
- Severe rent burden
- 4246.0
Population outlook (Orange County) Hauer SSP2
- Today (2025)
- 1,618,226 people
- By 2030
- 1,787,404 · +10.5%
- By 2040
- 2,125,621 · +31.4%
- By 2050
- 2,454,016 · +51.6%
- By 2075
- 3,173,711 · +96.1%
- By 2100
- 3,607,781 · +122.9%
Race, ethnicity, and origin ACS 2023
- Neighborhood character
- Predominantly Hispanic (68%)
- Race & ethnicity
- Hispanic / Latino 68% Two or more races 36% White 17% Black 10% Asian 2%
- Hispanic origin (detail)
- Mexican 2% Puerto Rican 38% Cuban 5% Dominican 5%
- Common ancestry
- Lithuanian 1% Romanian 1% Slovak 1%
- Foreign-born
- 27% · Canada, Jamaica, China
- Languages at home
- 36% English-only · Spanish 60% French/Haitian/Cajun 1% Arabic 1%
Political lean MEDSL · Orange
- 2024 margin
- D (+13.6) · D 56.1% · R 42.5% · Other 1.3%
- 2008→2024 swing
- -5.0pp toward R · 2008: 18.6pp · 2024: 13.6pp
- All cycles
- 2024: D+13.6 2020: D+23.1 2016: D+24.6 2012: D+18.2 2008: D+18.6
Not yet ingested
- Civics
- —
Market trends
- HPI YoY
- ▼ -95.17%
- Current HPI
- 355.5775
- Rent YoY
- ▼ -0.68%
- Metro
- Orlando-Kissimmee-Sanford, FL
- State GDP YoY
- ▲ 3.28%
- F500 in state
- 36
Industry mix (Fortune 500 HQ in FL)
| Industry | F500 HQs | Revenue |
|---|---|---|
| Industrial Technology | 2 | $29B |
|
||
| Insurance | 2 | $17B |
|
||
| Retail | 1 | $60B |
|
||
| Technology Distribution | 1 | $58B |
|
||
| Homebuilding | 1 | $35B |
|
||
| Technology Manufacturing | 1 | $35B |
|
||
Price history
+160.7% since first listed9 events — show timeline
- 2026-05-19 Pending — Stellar MLS as Distributed by MLS Grid
- 2026-05-01 Listed $110,000 Stellar MLS as Distributed by MLS Grid
- 2022-06-13 Pending — Stellar MLS as Distributed by MLS Grid
- 2022-06-13 Listing Removed — Stellar MLS as Distributed by MLS Grid
- 2022-06-13 Listed $85,000 Stellar MLS as Distributed by MLS Grid
- 2008-04-02 Listing Removed — Stellar MLS as Distributed by MLS Grid
- 2007-08-02 Listed $140,000 Stellar MLS as Distributed by MLS Grid
- 2001-05-08 Sold (Public Records) $62,500 Public Records
- 2001-05-08 Sold (Public Records) $42,200 Public Records
Property tax history
+27.0%/yrLatest (2025): $2,811 · +7.0% YoY. Source: county tax records.
Cash-flow waterfall
monthlySold comps — $/sqft
last 12 mo · ≤1 miLoading sold comps…