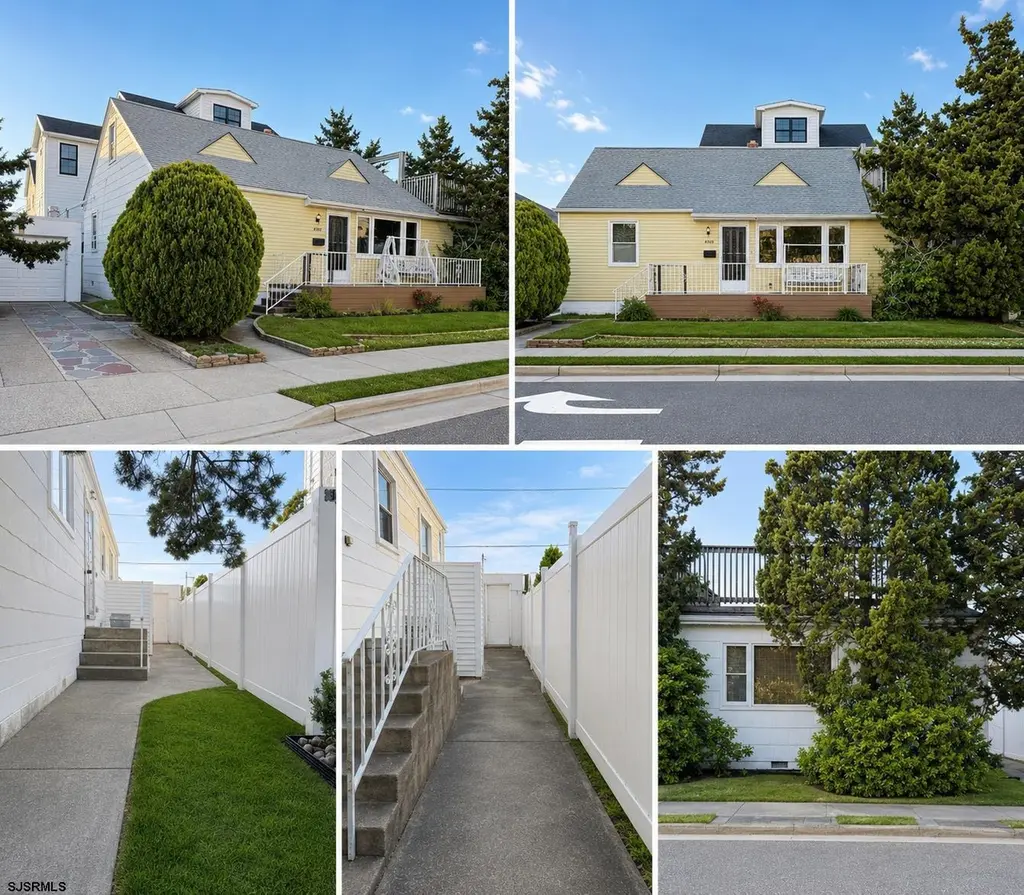
8305 Winchester Ave · Margate City, NJ
Flood risk 9/10 · Severe
- FEMA flood zone
- AE
- Chance of flooding over 30 yrs
- 0.99%
- Est. flood insurance / yr
- $1,737 – $8,500
Fire risk 2/10 · Minimal
- Est. fire insurance / yr
- $526 – $976
Heat risk 9/10 · Severe
- Hot days now (above 95°F)
- 7 days/yr
- Hot days in 30 yrs
- 16 days/yr
Wind risk 8/10 · Major
- Chance of severe wind over 30 yrs
- 80.0%
Air-quality risk 2/10 · Minimal
- Unhealthy air days now
- 1 days/yr
- Unhealthy air days in 30 yrs
- 2 days/yr
Risk factors via First Street. Map © Google.
Why this score? — see what drove the A- grade
The composite is a weighted blend of 9 inputs, each scored 0–100. Each bar is that input's sub-score; the figure is the points it added to the 100-point composite (weight × sub-score).
- Cash flow +30.0/30.0
- ARV discount +15.0/15.0
- 1% rule +10.0/10.0
- DSCR +10.0/10.0
- Appreciation +5.0/10.0
- Schools +4.8/10.0
- Livability +3.8/5.0
- Rent growth +2.5/5.0
- Condition / age +2.5/5.0
$1,100,000
🖨 Deal sheet 📄 Offer letter ✓ Due diligence
Listing remarks MLS
WELL MAINTAINED, GREAT LOCATION. FINISHED 2ND FLOOR. LARGE SUNKEN FAMILY ROOM, GARAGE, 20 X 20' DECK OFF SECOND FLOOR. EASY TO SHOW.
Key facts
- Garage
- Built 1950
- Listed 13 days
Tags
Property features AI
Finance
- Other: Lead-based paint disclosure available; Seller's property condition disclosure available
Exterior
- Parking: Two exterior parking spaces; One-car garage
- Utilities: Public water; Public sewer; Gas water heater
- Home design: Single property for sale
- Exterior features: Deck; Porch; Concrete driveway; Corner lot
Interior
- Kitchen: Eat-in kitchen; Dishwasher; Gas stove; Self-cleaning oven; Refrigerator
- Bathrooms: 1 full bath; 1 half bath
- Heating & cooling: Central air conditioning; Forced air heating (natural gas)
- Interior features: Dishwasher; Dryer; Gas stove; Refrigerator; Self-cleaning oven; Washer; Den/TV room; Eat-in kitchen; Laundry/utility room; Crawl space basement
- Laundry & utility: Washer and dryer; Laundry/utility room
Neighborhood map
What this means for you Summary
Snapshot
- This is a 4-bed/1.5-bath single-family listed at $1.10M.
Deal economics
- At list price, monthly cash flow is $11k ($130k/yr) — positive.
- The deal already cash-flows at list — no discount required.
- Meets the 1% rule at list price ($23k rent vs $1.10M).
- Cap rate 18.6% vs local median 7.4% in Margate City — top-decile yield for the area; either an underpriced asset or a hidden risk that comps aren't pricing in. Stress-test before assuming the spread holds.
Location & tenants
- Location reads 75/100 on livability (#149 in NJ, #3,893 nationally) — a middle-class / working-renter tenant base. Strengths: schools A+, crime A+, employment A+; Watch: amenities F, commute F, cost of living F.
- Margate City School District (suburban): math 50% / reading 58% proficiency, ranked #113 of 472 in NJ (top 24%) — acceptable for families but not a draw, mixed tenant base, ~2y average lease; only 8% free/reduced lunch — higher-income household profile.
- Market conditions: 6 active listings in the ZIP; 2 comparable units currently listed for rent nearby; 672 units permitted in Atlantic County in 2024 (258 in 5+ unit buildings).
Forward outlook
- In year one you build about $41k of equity ($8k loan paydown + $33k appreciation (3.0% local appreciation)).
- Atlantic County population projected at -12% by 2050 — secular population decline; favor cash flow + early exit over multi-decade hold.
- At projected returns (3.0% appreciation + 3.0% rent growth), your $308k cash investment doubles in ~2 years — after that, you're playing with house money.
- By year 2, paydown + projected appreciation supports a ~$66k cash-out refi (75% LTV) — recoverable capital for the next deal without selling this one.
Negotiation context
- Only 13 days on market — expect competitive offers; lowballing is unlikely to land.
- 2 sale attempts since 28y ago with the ask held roughly flat each time — persistent listings suggest the price (not the market) is what's stuck; bring a comps-based counter.
- Current owner paid $152k; list at $1.10M implies a 624% gain — meaningful room to come down on a strong offer.
Risks & watch-outs
- Watch-outs: flood insurance adds $427/mo; built in 1950 — expect roof / HVAC / electrical / plumbing capex.
- Climate carrying-cost: in FEMA flood zone AE (mandatory federal flood insurance); severe wind risk, 80% chance of damaging wind over 30y; extreme-heat days projected 7→16/yr by 2055 (HVAC capex compounding) — expect insurance premiums to compound above CPI over the hold.
Questions for the listing agent
- Built in 1950 — when were the roof, HVAC, electrical panel, plumbing, and water heater last replaced?
- What's the actual annual flood-insurance premium (NFIP or private), and is the property in a SFHA with mandatory coverage?
- Is there a deadline driving the sale (1031 exchange, divorce, estate, relocation)? That informs how much negotiation room exists.
- Schools are A-rated — typically a magnet for longer-tenancy family renters. What's the average tenant stay here, and is there a school-zone premium baked into asking?
- What's the average days-on-market for RENTAL listings here right now (not sales)? A rising rental-DOM trend means longer vacancies and softer asking-rent achievability than the comps imply.
- What's the recent tenant-quality profile in this submarket — average credit score on applications, eviction rate, late-payment / NSF rate, and stable-employment percentage? A property-management company in the area should have these aggregated.
- How much new for-sale + rental construction is in the pipeline within 1–3 miles? Heavy new supply typically softens prices + rents 12–24 months out; constrained supply supports both.
Investment metrics
- 1% rule
- 2.07% ✓
- Cap rate
- 18.60%
- Cash-on-cash
- 43.94%
- DSCR
- 2.96
- GRM
- 4.0
CMA / ARV
- ARV (on-the-fly)
- $1,619,380
- Comps found
- 2
Show comp detail 2 sales within ~0.75 mi
| Address | Dist | Beds/Ba | Sqft | Sold | Price | $/sf | Match |
|---|---|---|---|---|---|---|---|
| 26 N Iroquois | 0.05mi | 3/2.0 (-1) | 1,362 (+13%) | 10mo | $999,999 | $734 | 61 |
| 111 S Decatur Ave | 0.71mi | 3/2.5 (-1) | 1,264 (+5%) | 14mo | $1,700,000 | $1,345 | 38 |
Match score weights: distance 35% · size 25% · config 20% · recency 20%. Top-matched comps best support the ARV.
Projected returns pro-forma
3.0% appreciation · 3.0% rent growth · sell at horizon
- IRR
- 47.7%
- Equity multiple
- 3.67×
- Total profit
- $823,739
- Equity at exit
- $494,608
- IRR
- 47.4%
- Equity multiple
- 7.38×
- Total profit
- $1,964,050
- Equity at exit
- $762,249
Cash invested: $308,000 (down + closing). Projections, not guarantees.
Landlord ↔ Tenant lean methodology
- Overall (STATE)
- 21 Tenant-Leaning
- State New Jersey
- 21 Tenant-Leaning · D+6
- County
- — inherits STATE
- City
- — inherits STATE
ZIP-level market 08401-9999
- Active inventory
- 6
- Price-to-rent
- 4.0×
Monthly cashflow live
- Estimated rent
- $22,781 medium interval (Pro) →
- Mortgage (P&I)
- −$5,769
- Tax from tax record
- −$492 /mo · $5,902/yr
- Insurance
- −$458
- Flood insurance flood zone
- −$427 /mo · $5,118/yr
- HOA
- −$0
- Vacancy / Maint / Mgmt
- −$4,784
- Net cashflow
- $10,852
Break-even live
UW: 25.0% down · 7.5% · 30yr · 1.5% tax · 5.0% vac · 8.0% maint · 8.0% mgmt
Financing live
Cash to close
- Down payment
- $275,000
- Closing costs
- $33,000
- Reserves months
- —
- Total cash needed
- —
Loan-product check · same deal, 3 products live
Conventional
25% down · 7.5% · 30yr
- Down + closing
- —
- Monthly P&I
- —
- Monthly cashflow
- —
- DSCR
- —
- Eligible?
- —
Personal DTI + credit; lowest rate.
DSCR
20% down · 8.5% · 30yr
- Down + closing
- —
- Monthly P&I
- —
- Monthly cashflow
- —
- DSCR
- —
- Eligible?
- —
No personal income docs; deal must DSCR.
Hard money
10% down · 12.0% · 12mo
- Down + closing
- —
- Monthly P&I
- —
- Monthly cashflow
- —
- DSCR
- —
- Eligible?
- —
Short-term bridge; refi at stabilization.
Rent comps 2 comps
| Address | Beds | Baths | Sqft | Rent | $/sqft | DOM | Units | Dist |
|---|---|---|---|---|---|---|---|---|
| 201 N Coolidge Ave Unit A1 Margate City, NJ | 3.0 | 2.0 | 1258 | $35,000 | $27.82 | 44d | 1 | 0.97mi |
| 120 N Harvard Ave Ventnor City, NJ | 3.0 | 1.0 | 1000 | $2,100 | $2.10 | 44d | 1 | 1.42mi |
Listing history 10 events
-
2026-06-15days on market $1,100,000 Active 13 DOM
-
2026-06-14days on market $1,100,000 Active 11 DOM
-
2026-06-13days on market $1,100,000 Active 10 DOM
-
2026-06-10days on market $1,100,000 Active 8 DOM
-
2026-06-09days on market $1,100,000 Active 7 DOM
-
2026-06-08days on market $1,100,000 Active 6 DOM
-
2026-06-07days on market $1,100,000 Active 5 DOM
-
2026-06-05days on market $1,100,000 Active 2 DOM
-
2026-06-03remarks 699-char remark
-
2026-06-03$1,100,000 Active 1 DOM
ⓘ Source: listings_history table (triggers on properties + properties_extension) + one-shot
backfill from property_details.listing_events for pre-trigger history.
Tax reassessment forecast NJ · Partial reset (capped growth)
- Current annual tax
- $5,902 · $492/mo
- Projected year-2 tax
- $16,646 · $1,387/mo
- Expected delta
- +$10,744/yr (+$895/mo · 182.0%)
ⓘ Screening estimate from a state-policy table — verify with the county assessor before closing.
Climate risk First Street
- Flood 9/10 Extreme FEMA zone AE · 99% chance over 30 yrs
- Wildfire 2/10 Low
- Heat 9/10 Extreme 7 d/yr ≥95°F today · 16 d/yr by 30 yrs out
- Wind 8/10 Severe 80% chance of damaging wind over 30 yrs
- Air quality 2/10 Low 1 unhealthy d/yr today · 2 by 30 yrs out
Nearby sold comps map
Loading sold comps map…
Walkable amenities ~0.75 mi
Loading nearby amenities…
Taxation est. · year 1
- Rental income
- $273,375
- − Mortgage interest
- −$61,617
- − Property taxes
- −$5,902
- − Insurance
- −$10,618
- − Repairs & maintenance
- −$21,870
- − Management
- −$21,870
- − Depreciation
- −$32,000
- Taxable income
- $119,497
- Est. tax owed @ 24.0%
- −$28,679
- After-tax cash flow
- $101,544/yr
For passive investors: Depreciation is non-cash, so a rental often shows a tax loss while cash-flowing — sheltering income. Rental losses are passive: they offset passive income freely, and up to $25,000/yr can offset ordinary (W-2) income if you actively participate and your MAGI is under $100k (phasing out to $0 by $150k); unused losses carry forward. On sale, claimed depreciation is recaptured at up to 25%, and gains may owe capital-gains tax (a 1031 exchange can defer both). Figures are a year-1 estimate at your 24.0% rate — not tax advice; consult a CPA.
Schools (NCES district)
- District
- Margate City School District
- NCES district ID
- 3409690
- Math proficiency
- 50% ▼ -26.00%
- Reading proficiency
- 58% ▼ -28.00%
- Median HH income
- $67,112
- Composite
- 47.71/100
- National rank
- #2241
- State rank
- #113 of 472 in NJ
Livability — Margate City
- Score
- 75/100
- State rank
- #149
- US rank
- #3893
Category grades
Schools grade is shown separately in the Schools card above.
Census & demographics
- Census place
- Margate City, NJ
Population outlook (Atlantic County) Hauer SSP2
- Today (2025)
- 268,948 people
- By 2030
- 264,497 · -1.7%
- By 2040
- 252,261 · -6.2%
- By 2050
- 237,846 · -11.6%
- By 2075
- 210,650 · -21.7%
- By 2100
- 180,234 · -33.0%
Not yet ingested
- Political lean
- —
- Race & ethnicity
- —
- Common origin
- —
- Civics
- —
Market trends
- HPI YoY
- —
- Current HPI
- —
- Rent YoY
- —
- Metro
- —
- State GDP YoY
- ▲ 2.05%
- F500 in state
- 34
Industry mix (Fortune 500 HQ in NJ)
| Industry | F500 HQs | Revenue |
|---|---|---|
| Consumer Goods | 3 | $31B |
|
||
| Pharmaceuticals | 2 | $153B |
|
||
| Technology | 2 | $21B |
|
||
| Insurance | 2 | $20B |
|
||
| Healthcare | 2 | $19B |
|
||
| Financial Services | 1 | $70B |
|
||
Price history
+600.6% since first listed7 events — show timeline
- 2026-06-02 Listed $1,100,000 SJSRMLS
- 1999-06-08 Sold (Public Records) $152,000 Public Records
- 1999-04-26 Sold (Public Records) $152,000 Public Records
- 1999-04-16 Sold (MLS) $152,000 SJSRMLS
- 1999-02-02 Listing Removed — SJSRMLS
- 1998-04-27 Listed $169,900 SJSRMLS
- 1990-01-05 Sold (Public Records) $157,000 Public Records
Property tax history
+1.9%/yrLatest (2025): $5,902 · +4.6% YoY. Source: county tax records.
Cash-flow waterfall
monthlySold comps — $/sqft
last 12 mo · ≤1 miLoading sold comps…