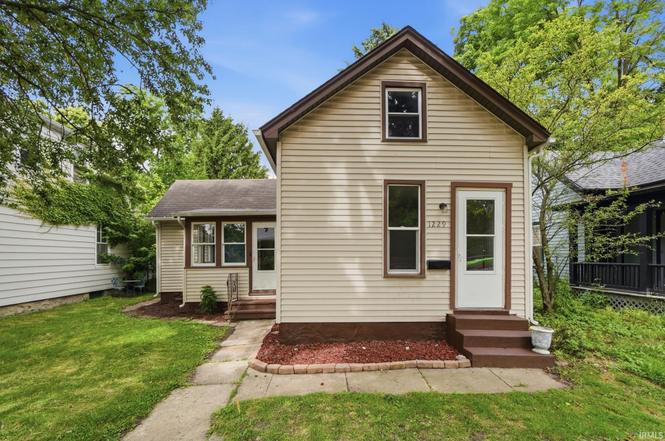
1229 Wefel St · Fort Wayne, IN
Flood risk 1/10 · Minimal
- FEMA flood zone
- X
- Chance of flooding over 30 yrs
- 0.0%
- Est. flood insurance / yr
- $473 – $860
Fire risk 1/10 · Minimal
- Est. fire insurance / yr
- $717 – $1,331
Heat risk 3/10 · Minor
- Hot days now (above 100°F)
- 7 days/yr
- Hot days in 30 yrs
- 17 days/yr
Wind risk 2/10 · Minimal
- Chance of severe wind over 30 yrs
- —
Air-quality risk 3/10 · Minor
- Unhealthy air days now
- 2 days/yr
- Unhealthy air days in 30 yrs
- 3 days/yr
Risk factors via First Street. Map © Google.
Why this score? — see what drove the D grade
The composite is a weighted blend of 9 inputs, each scored 0–100. Each bar is that input's sub-score; the figure is the points it added to the 100-point composite (weight × sub-score).
- Cash flow +14.2/30.0
- ARV discount +9.4/15.0
- DSCR +4.3/10.0
- Rent growth +4.2/5.0
- Livability +4.2/5.0
- 1% rule +3.7/10.0
- Condition / age +2.5/5.0
- Schools +2.2/10.0
- Appreciation +0.0/10.0
$129,900
🖨 Deal sheet 📄 Offer letter ✓ Due diligence
Listing remarks MLS
Come check out this 2 bedroom investment property! The property is in need of some TLC. All trash, debris, and personal property will be removed before closing. Selling As-Is, Cash Only.
Key facts
- New gas range
- Open-concept kitchen
- New vanity sink
Tags
Property features AI
Finance
- Other: Lot dimensions approximately 40 x 150 (0.14 acre)
- HOA & community: No association amenities
Exterior
- Parking: Off-street parking
- Security: Smoke detector(s)
- Utilities: Public water; Public sewer; Cable available; Electric water heater
- Home design: Single-family site-built home; One story; Subdivision: Sweetzer(s)
- Construction: Vinyl siding; Shingle roof; Built on a traditional foundation (basement present)
- Exterior features: Patio; Porch; Storm door(s); Chain link full fenced yard; Level lot
Interior
- Kitchen: Refrigerator; Gas range
- Bedrooms: Total of 5 rooms (bedroom count not specified)
- Flooring: Hardwood; Carpet
- Bathrooms: One full bathroom (located on the main level)
- Heating & cooling: No central cooling indicated
- Interior features: Eat-in kitchen; Natural woodwork; Laminate countertops; Full unfinished basement; Smoke detector(s)
- Laundry & utility: Gas dryer hookup on the main level; Electric water heater
Neighborhood map
What this means for you Summary
Snapshot
- This is a 2-bed/1.0-bath single-family listed at $130k.
Deal economics
- At list price, monthly cash flow is $20 ($243/yr) — positive.
- The deal already cash-flows at list — no discount required.
- To meet the 1% rule (rent ≥ 1% of price), the offer needs to be $114k (12.6% below list).
- Recommended offer: $114k (12.6% below list) — sets the bar for 1% rule.
- Cap rate 6.5% vs local median 4.8% in Fort Wayne — top-decile yield for the area; either an underpriced asset or a hidden risk that comps aren't pricing in. Stress-test before assuming the spread holds.
Location & tenants
- Location reads 84/100 on livability (#6 in IN, #676 nationally) — a professional / high-income tenant draw. Strengths: amenities A+, commute A+, cost of living A+; Watch: crime C-, employment D+.
- Fort Wayne Community Schools (urban): math 22% / reading 29% proficiency, ranked #263 of 301 in IN (top 87%) — low school quality limits family demand, transient renter base, plan for 1-2y turnover; 60% free/reduced lunch — lower-income household profile, screen leases tightly.
- Zoned schools: Bloomingdale Elementary School (math 12% / reading 8%, grade F, #921 of 994 statewide, top 94%, 300 students, 81% FRL); Northwood Middle School (math 14% / reading 22%, grade F, #279 of 330 statewide, top 86%, 587 students, 70% FRL); North Side High School (math 19% / reading 51%, grade F, #266 of 369 statewide, top 73%, 1,474 students, 66% FRL).
- Market conditions: Rents rising fast (+7.0%/yr); 87 active listings in the ZIP; 32 comparable units currently listed for rent nearby; rentals at typical pace (median 21d on market — plan ~3-4 weeks tenant-placement turnaround); 1,861 units permitted in Allen County in 2024 (576 in 5+ unit buildings).
Forward outlook
- Local home prices are declining (-3.0%/yr); year-one equity from $898 of loan paydown is wiped out by about $4k of value loss. Plan a longer hold.
- Allen County population projected at +10% by 2050 — modest demand growth; plan on rents tracking national, not racing it.
Negotiation context
- Only 1 days on market — expect competitive offers; lowballing is unlikely to land.
- 2 sale attempts since 4y ago with the ask held roughly flat each time — persistent listings suggest the price (not the market) is what's stuck; bring a comps-based counter.
- Current owner paid $50k; list at $130k implies a 160% gain — meaningful room to come down on a strong offer.
Risks & watch-outs
- Watch-outs: built in 1900 — expect roof / HVAC / electrical / plumbing capex.
Questions for the listing agent
- Built in 1900 — when were the roof, HVAC, electrical panel, plumbing, and water heater last replaced?
- Is there a deadline driving the sale (1031 exchange, divorce, estate, relocation)? That informs how much negotiation room exists.
- Schools are D-rated, which usually means shorter tenancies and higher turnover. Who's the typical renter profile here, and what's been the actual vacancy rate?
- The area grade is low — what's the realistic commute time and amenity access for the typical tenant pool here? Any planned neighborhood developments (good or bad) we should know about?
- What's the average days-on-market for RENTAL listings here right now (not sales)? A rising rental-DOM trend means longer vacancies and softer asking-rent achievability than the comps imply.
- What's the recent tenant-quality profile in this submarket — average credit score on applications, eviction rate, late-payment / NSF rate, and stable-employment percentage? A property-management company in the area should have these aggregated.
- How much new for-sale + rental construction is in the pipeline within 1–3 miles? Heavy new supply typically softens prices + rents 12–24 months out; constrained supply supports both.
Investment metrics
- 1% rule
- 0.87% ✗
- Cap rate
- 6.48%
- Cash-on-cash
- 0.67%
- DSCR
- 1.03
- GRM
- 9.5
CMA / ARV
- ARV (on-the-fly)
- $135,564
- Comps found
- 12
Show comp detail 12 sales within ~0.75 mi
| Address | Dist | Beds/Ba | Sqft | Sold | Price | $/sf | Match |
|---|---|---|---|---|---|---|---|
| 1101 Saint Marys Ave | 0.25mi | 2/1.0 | 908 (-4%) | 1mo | $130,000 | $143 | 80 |
| 1016 Putnam St | 0.43mi | 2/1.0 | 1,000 (+6%) | 2mo | $145,000 | $145 | 70 |
| 1918 Short St | 0.54mi | 2/1.0 | 974 (+3%) | 8mo | $139,900 | $144 | 63 |
| 657 Florence Ave | 0.63mi | 2/1.0 | 960 (+1%) | 10mo | $136,000 | $142 | 60 |
| 638 W 4th St | 0.18mi | 2/1.0 | 816 (-14%) | 10mo | $130,000 | $159 | 60 |
| 1006 Archer Ave | 0.49mi | 3/1.0 (+1) | 988 (+4%) | 12mo | $139,900 | $142 | 55 |
| 2006 Saint Marys Ave | 0.57mi | 2/1.0 | 872 (-8%) | 7mo | $73,000 | $84 | 54 |
| 630 W 4th St | 0.19mi | 3/1.0 (+1) | 1,087 (+15%) | 10mo | $120,000 | $110 | 54 |
| 1132 Burgess St | 0.35mi | 2/1.0 | 1,072 (+13%) | 13mo | $142,900 | $133 | 51 |
| 1427 Margaret Ave | 0.70mi | 2/1.0 | 850 (-10%) | 2mo | $148,000 | $174 | 48 |
| 1714 Spring St | 0.70mi | 2/1.0 | 864 (-9%) | 8mo | $117,000 | $135 | 46 |
| 1501 Runnion Ave | 0.74mi | 2/1.0 | 864 (-9%) | 10mo | $167,900 | $194 | 43 |
Match score weights: distance 35% · size 25% · config 20% · recency 20%. Top-matched comps best support the ARV.
Projected returns pro-forma
-3.0% appreciation · 6.98% rent growth · sell at horizon
- IRR
- -11.0%
- Equity multiple
- 0.59×
- Total profit
- $-15,027
- Equity at exit
- $19,369
- IRR
- 3.1%
- Equity multiple
- 1.27×
- Total profit
- $9,654
- Equity at exit
- $11,231
Cash invested: $36,372 (down + closing). Projections, not guarantees.
Landlord ↔ Tenant lean methodology
- Overall (STATE)
- 90 Strongly Landlord-Friendly
- State Indiana
- 90 Strongly Landlord-Friendly · R+11
- County
- — inherits STATE
- City
- — inherits STATE
ZIP-level market 46808
- Rents YoY
- 7.0%
- Active inventory
- 87
- Price-to-rent
- 9.5×
Monthly cashflow live
- Estimated rent
- $1,135 high interval (Pro) →
- Mortgage (P&I)
- −$681
- Tax from tax record
- −$141 /mo · $1,694/yr
- Insurance
- −$54
- HOA
- −$0
- Vacancy / Maint / Mgmt
- −$238
- Net cashflow
- $20
Break-even live
UW: 25.0% down · 7.5% · 30yr · 1.5% tax · 5.0% vac · 8.0% maint · 8.0% mgmt
Financing live
Cash to close
- Down payment
- $32,475
- Closing costs
- $3,897
- Reserves months
- —
- Total cash needed
- —
Loan-product check · same deal, 3 products live
Conventional
25% down · 7.5% · 30yr
- Down + closing
- —
- Monthly P&I
- —
- Monthly cashflow
- —
- DSCR
- —
- Eligible?
- —
Personal DTI + credit; lowest rate.
DSCR
20% down · 8.5% · 30yr
- Down + closing
- —
- Monthly P&I
- —
- Monthly cashflow
- —
- DSCR
- —
- Eligible?
- —
No personal income docs; deal must DSCR.
Hard money
10% down · 12.0% · 12mo
- Down + closing
- —
- Monthly P&I
- —
- Monthly cashflow
- —
- DSCR
- —
- Eligible?
- —
Short-term bridge; refi at stabilization.
Rent comps 32 comps
| Address | Beds | Baths | Sqft | Rent | $/sqft | DOM | Units | Dist |
|---|---|---|---|---|---|---|---|---|
| 706 3rd St Unit 1 Fort Wayne, IN | 2.0 | 1.0 | 930 | $995 | $1.07 | 43d | 1 | 0.08mi |
| 1437 Oakland St Fort Wayne, IN | 3.0 | 1.0 | 1000 | $1,250 | $1.25 | 43d | 1 | 0.19mi |
| 835 Van Buren St Fort Wayne, IN | 2.0 | 1.0–2.0 | 750 | $1,995 | $2.66 | 13d | 29 | 0.61mi |
| 116 W Columbia St Fort Wayne, IN | 1.0 | 1.0 | 689 | $1,305 | $1.89 | 13d | 3 | 0.66mi |
| 2131 N Wells St Apt 1 Fort Wayne, IN | 1.0 | 1.0 | 800 | $800 | $1.00 | 13d | 1 | 0.68mi |
| 112 W Washington Blvd Fort Wayne, IN | 1.0–2.0 | 1.0–2.0 | 768 | $1,500 | $1.95 | 21d | 2 | 0.88mi |
| 101 Three Rivers N Fort Wayne, IN | 2.0 | 1.0 | 760 | $2,102 | $2.76 | 21d | 11 | 0.89mi |
| 1250 Ewing St Fort Wayne, IN | 2.0 | 1.0–2.0 | 980 | $2,081 | $2.12 | 21d | 24 | 0.91mi |
| 1915 Ellen Ave Fort Wayne, IN | 2.0 | 1.0 | 1100 | $950 | $0.86 | 13d | 1 | 0.92mi |
| 424 Nussbaum Ave Fort Wayne, IN | 2.0 | 1.0 | 650 | $1,200 | $1.85 | 21d | 1 | 0.92mi |
| 877 Lavina St Fort Wayne, IN | 1.0–3.0 | 1.0–2.0 | 997 | $2,187 | $2.19 | 43d | 17 | 0.93mi |
| 608 Anderson Ave Unit 1 Fort Wayne, IN | 2.0 | 1.0 | 804 | $875 | $1.09 | 21d | 1 | 0.99mi |
| 2718 Sherman Blvd Fort Wayne, IN | 2.0 | 1.0 | 900 | $925 | $1.03 | 21d | 1 | 1.03mi |
| 425 E Wayne St Fort Wayne, IN | 1.0 | 1.0 | 578 | $795 | $1.38 | 21d | 1 | 1.06mi |
| 1332 Swinney Ave Fort Wayne, IN | 2.0 | 1.0 | 1035 | $1,300 | $1.26 | 43d | 1 | 1.13mi |
| 1421 Swinney Ave Unit 2 Fort Wayne, IN | 1.0 | 1.0 | 950 | $850 | $0.89 | 43d | 1 | 1.17mi |
| 1829 Broadway Unit 1831 Fort Wayne, IN | 1.0 | 1.0 | 600 | $950 | $1.58 | 43d | 1 | 1.17mi |
| 805 Edgewater Ave Fort Wayne, IN | 3.0 | 1.0 | 1075 | $1,550 | $1.44 | 13d | 1 | 1.20mi |
| 807 Edgewater Ave Fort Wayne, IN | 3.0 | 1.0 | 1075 | $1,450 | $1.35 | 21d | 1 | 1.21mi |
| 840 Columbia Ave Unit A Fort Wayne, IN | 1.0 | 1.0 | 650 | $650 | $1.00 | 13d | 1 | 1.25mi |
| 1905 Hillside Ave Apt 1 Fort Wayne, IN | 1.0 | 1.0 | 680 | $825 | $1.21 | 43d | 1 | 1.32mi |
| 937 Columbia Ave Unit 937-4 Fort Wayne, IN | 1.0 | 1.0 | 630 | $850 | $1.35 | 13d | 1 | 1.32mi |
| 1005 Columbia Ave Unit 1005-1 Fort Wayne, IN | 2.0 | 1.0 | 680 | $950 | $1.40 | 13d | 1 | 1.34mi |
| 217 W Masterson Ave Fort Wayne, IN | 2.0 | 1.0 | 1100 | $995 | $0.90 | 21d | 1 | 1.36mi |
| 2005 Bayer Ave Fort Wayne, IN | 2.0 | 1.0 | 840 | $895 | $1.07 | 43d | 1 | 1.39mi |
| 2136 Miner St #2 Fort Wayne, IN | 2.0 | 1.0 | 850 | $1,200 | $1.41 | 43d | 1 | 1.39mi |
| 309 W Williams St Unit 1 Fort Wayne, IN | 2.0 | 1.0 | 900 | $900 | $1.00 | 21d | 1 | 1.42mi |
| 344 Dunnwood Dr Unit 1 Fort Wayne, IN | 2.0 | 1.0 | 800 | $695 | $0.87 | 43d | 1 | 1.42mi |
| 227 W Williams St Unit 3 Fort Wayne, IN | 1.0 | 1.0 | 590 | $650 | $1.10 | 43d | 1 | 1.44mi |
| 2133 Riedmiller Ave Fort Wayne, IN | 3.0 | 1.0 | 1056 | $1,050 | $0.99 | 21d | 1 | 1.46mi |
| 607 Curdes Ave Fort Wayne, IN | 3.0 | 1.5 | 1072 | $1,450 | $1.35 | 21d | 1 | 1.47mi |
| 1115 Edgewater Ave Unit 1115-2 Fort Wayne, IN | 1.0 | 1.0 | 550 | $825 | $1.50 | 13d | 1 | 1.48mi |
Listing history 2 events
-
2026-06-19remarks 699-char remark
-
2026-06-19$129,900 Active 1 DOM
ⓘ Source: listings_history table (triggers on properties + properties_extension) + one-shot
backfill from property_details.listing_events for pre-trigger history.
Tax reassessment forecast IN · Partial reset (capped growth)
- Current annual tax
- $1,694 · $141/mo
- Projected year-2 tax
- $1,694 · $141/mo
- Expected delta
- $0/yr ($0/mo · 0.0%)
ⓘ Screening estimate from a state-policy table — verify with the county assessor before closing.
Climate risk First Street
- Flood 1/10 Low FEMA zone X · 0% chance over 30 yrs
- Wildfire 1/10 Low
- Heat 3/10 Moderate 7 d/yr ≥100°F today · 17 d/yr by 30 yrs out
- Wind 2/10 Low
- Air quality 3/10 Moderate 2 unhealthy d/yr today · 3 by 30 yrs out
Nearby sold comps map
Loading sold comps map…
Walkable amenities ~0.75 mi
Loading nearby amenities…
Taxation est. · year 1
- Rental income
- $13,622
- − Mortgage interest
- −$7,276
- − Property taxes
- −$1,694
- − Insurance
- −$650
- − Repairs & maintenance
- −$1,090
- − Management
- −$1,090
- − Depreciation
- −$3,779
- Taxable loss
- −$1,956
- Est. tax savings @ 24.0%
- +$470
- After-tax cash flow
- $713/yr
For passive investors: Depreciation is non-cash, so a rental often shows a tax loss while cash-flowing — sheltering income. Rental losses are passive: they offset passive income freely, and up to $25,000/yr can offset ordinary (W-2) income if you actively participate and your MAGI is under $100k (phasing out to $0 by $150k); unused losses carry forward. On sale, claimed depreciation is recaptured at up to 25%, and gains may owe capital-gains tax (a 1031 exchange can defer both). Figures are a year-1 estimate at your 24.0% rate — not tax advice; consult a CPA.
Schools (NCES district)
- District
- Fort Wayne Community Schools
- NCES district ID
- 1803630
- Math proficiency
- 22% ▼ -11.00%
- Reading proficiency
- 29% ▼ -7.00%
- Median HH income
- $41,951
- Composite
- 21.68/100
- National rank
- #8275
- State rank
- #263 of 301 in IN
Livability — Fort Wayne
- Score
- 84/100
- State rank
- #6
- US rank
- #676
Category grades
Schools grade is shown separately in the Schools card above.
Census & demographics
- Census place
- Fort Wayne, IN
- County
- Allen County · 326,813 people
- City population
- 326,813
- Metro
- Fort Wayne, IN
- Population (ZIP)
- 19,684
- Household income
- $53,359
- Rent vs Own
- Severe rent burden
- 625.0
Population outlook (Allen County) Hauer SSP2
- Today (2025)
- 394,020 people
- By 2030
- 405,128 · +2.8%
- By 2040
- 423,476 · +7.5%
- By 2050
- 435,137 · +10.4%
- By 2075
- 450,293 · +14.3%
- By 2100
- 424,101 · +7.6%
Race, ethnicity, and origin ACS 2023
- Neighborhood character
- Predominantly White (71%)
- Race & ethnicity
- White 71% Hispanic / Latino 13% Two or more races 9% Black 9% Asian 2%
- Hispanic origin (detail)
- Mexican 10% Puerto Rican 2%
- Common ancestry
- Romanian 3% Lithuanian 2% Slovak 2%
- Foreign-born
- 7% · Canada, Philippines, South Korea
- Languages at home
- 86% English-only · Spanish 10% Korean 2% Other Asian/Pacific 1%
Political lean MEDSL · Allen
- 2024 margin
- R (+12.5) · D 42.9% · R 55.4% · Other 1.7%
- 2008→2024 swing
- -8.1pp toward R · 2008: -4.3pp · 2024: -12.5pp
- All cycles
- 2024: R+12.5 2020: R+11.2 2016: R+19.6 2012: R+16.8 2008: R+4.3
Not yet ingested
- Civics
- —
Market trends
- HPI YoY
- ▼ -288.51%
- Current HPI
- 239.6115
- Rent YoY
- ▲ 6.98%
- Metro
- Fort Wayne, IN
- State GDP YoY
- ▲ 2.90%
- F500 in state
- 18
Industry mix (Fortune 500 HQ in IN)
| Industry | F500 HQs | Revenue |
|---|---|---|
| Industrial Machinery | 2 | $37B |
|
||
| Healthcare | 1 | $177B |
|
||
| Pharmaceuticals | 1 | $45B |
|
||
| Metals / Steel | 1 | $18B |
|
||
| Agriculture | 1 | $17B |
|
||
| Packaging | 1 | $12B |
|
||
Price history
+136.6% since first listed3 events — show timeline
- 2026-06-18 Listed $129,900 IRMLS
- 2022-02-17 Sold (MLS) $50,000 IRMLS
- 2022-01-31 Listed $54,900 IRMLS
Property tax history
+0.8%/yrLatest (2024): $1,694 · +21.1% YoY. Source: county tax records.
Cash-flow waterfall
monthlySold comps — $/sqft
last 12 mo · ≤1 miLoading sold comps…