 Triplex
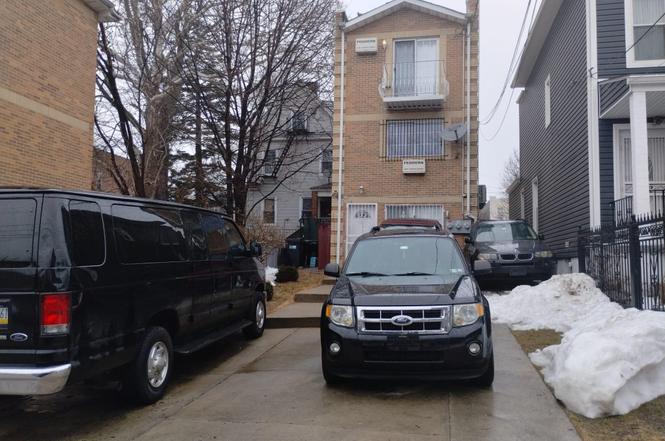
933 Tilden St · New York, NY
Flood risk 1/10 · Minimal
- FEMA flood zone
- X (unshaded)
- Chance of flooding over 30 yrs
- 0.0%
- Est. flood insurance / yr
- $507 – $1,088
Fire risk 1/10 · Minimal
- Est. fire insurance / yr
- $691 – $1,283
Heat risk 6/10 · Moderate
- Hot days now (above 99°F)
- 7 days/yr
- Hot days in 30 yrs
- 15 days/yr
Wind risk 6/10 · Moderate
- Chance of severe wind over 30 yrs
- 27.0%
Air-quality risk 3/10 · Minor
- Unhealthy air days now
- 3 days/yr
- Unhealthy air days in 30 yrs
- 4 days/yr
Risk factors via First Street. Map © Google.
Why this score? — see what drove the D- grade
The composite is a weighted blend of 9 inputs, each scored 0–100. Each bar is that input's sub-score; the figure is the points it added to the 100-point composite (weight × sub-score).
- Cash flow +13.0/30.0
- Schools +5.0/10.0
- DSCR +3.9/10.0
- Livability +3.8/5.0
- Rent growth +3.6/5.0
- 1% rule +2.8/10.0
- Condition / age +2.5/5.0
- ARV discount +2.3/15.0
- Appreciation +0.0/10.0
$1,189,000
🖨 Deal sheet (PDF) 📄 Offer letter ✓ Due diligence
Multi-family units
County records classify this as Multi-Family (2-4 Unit). Listing-text estimate: 3 units. confirmed
Listing remarks
Newer construction. Only 20 years old with modern appliances and two full bathrooms in each of the 2 three bedrooms units. Each has large ensuite master bedroom. All appliances, installations are according to the City's required codes. Private swimming pool installed in the back yard for summertime and barbecue enjoyment. This beautiful building is accessible from both E 213th Street and the main front door entrance on Tilden, is a little set back from Tilden Street. 933 Tilden comes with driveway parking for 4 or more cars. House is very well maintained both inside and out, with flowery plants and shrubs in garden style. Located in a highly sort after Bronxwood Avenue and Paulding Avenue N
Key facts
- Walk to shops
- Driveway parking
- 3,811 sq ft lot
Tags
Property features AI
Finance
- Other: Property is a triplex; Lawn maintenance equipment may be negotiable
- HOA & community: No association amenities
Exterior
- Parking: Assigned parking; Carport (4 spaces); Driveway parking; Off-street parking; Total 4 parking spaces
- Utilities: Public sewer; Electricity available and connected; Natural gas available and connected; Sewer connected; Public trash collection
- Home design: Triplex; Actual property condition
- Construction: Built with block, brick and frame construction; Block foundation
- Exterior features: Private pool; Back yard; Front yard; Garden; Landscaped; Level lot; Near public transit; Near shops; Paved areas; Other lot features; Chain link, cross fenced and front yard fencing
Interior
- Kitchen: Open kitchen; Granite counters
- Bedrooms: One 2-bedroom unit; Two 3-bedroom units
- Bathrooms: Five full bathrooms
- Heating & cooling: Electric heating (forced air); ENERGY STAR qualified heating equipment; Electric cooling; ENERGY STAR qualified cooling equipment
- Interior features: Ceiling fans; Chandelier; Granite counters; In-law floorplan; Open kitchen; Primary bathroom; Soaking tub
- Laundry & utility: Lawn maintenance equipment negotiable
Neighborhood map
What this means for you Summary
Snapshot
- This is a 3 × 3-bed/2.7-bath units multifamily listed at $1.19M.
Deal economics
- At list price, monthly cash flow is $-74 ($-892/yr) — negative. Per door: $-25/mo.
- To cash-flow at today's rent, offer at most $1.18M (1.1% below list).
- To meet the 1% rule (rent ≥ 1% of price), the offer needs to be $923k (22.4% below list).
- Recommended offer: $923k (22.4% below list) — sets the bar for 1% rule.
- Cap rate 6.2% vs local median 2.6% in New York — top-decile yield for the area; either an underpriced asset or a hidden risk that comps aren't pricing in. Stress-test before assuming the spread holds.
Location & tenants
- Location reads 75/100 on livability (#268 in NY, #4,188 nationally) — a middle-class / working-renter tenant base. Strengths: amenities A+, commute A+, health & safety A; Watch: crime F, cost of living F.
- Zoned schools: Elm Tree Elementary School (math 27% / reading 52%, grade F, #1,444 of 2,108 statewide, top 71%, 806 students, 94% FRL); Jhs 383 Philippa Schuyler (math 32% / reading 67%, grade C, #280 of 729 statewide, top 40%, 822 students, 85% FRL); Midwood High School (math 94% / reading 96%, grade A+, #83 of 1,100 statewide, top 8%, 4,062 students, 73% FRL).
- Market conditions: Rents rising fast (+4.3%/yr); 203 active listings in the ZIP; solid renter incomes; 6,929 units permitted in Bronx County in 2024 (6,829 in 5+ unit buildings).
- At $9,231/mo this rent would consume 146% of the median local household income ($76k/yr) (locally 3706% of renters already pay >50% of income on rent) — very limited rent-growth headroom before tenants either downsize or default.
Forward outlook
- Local home prices are declining (-3.0%/yr); year-one equity from $8k of loan paydown is wiped out by about $36k of value loss. Plan a longer hold.
- Bronx County population projected at +21% by 2050 — long-run rental-demand tailwind backs the buy-and-hold thesis.
Negotiation context
- It's been on market 112 days — a 9% lower offer ($1.08M) is reasonable based on typical stale-listing flexibility.
- Current owner paid $210k; list at $1.19M implies a 466% gain — meaningful room to come down on a strong offer.
Risks & watch-outs
- Climate carrying-cost: major wind risk, 27% chance of damaging wind over 30y; extreme-heat days projected 7→15/yr by 2055 (HVAC capex compounding) — expect insurance premiums to compound above CPI over the hold.
Questions for the listing agent
- What do current leases actually rent for vs. the listed asking? Can we see a recent rent roll and the last 12 months of T-12 income?
- It's been on market 112 days. Have you received any prior offers? Is the seller open to a 22% concession, seller financing, or rate buy-down credit?
- Can we see the unit-by-unit rent roll, current vacancy, and any below-market leases? What's the average tenancy length?
- What capital expenditures (roof, boiler, parking lot, exteriors) have been made in the last 5 years, and what's planned in the next 2?
- Why hasn't it sold? Are there any deal-killer items the seller is aware of (foundation, flood, title, zoning, code violations)?
- Is there a deadline driving the sale (1031 exchange, divorce, estate, relocation)? That informs how much negotiation room exists.
- Schools are B-rated — typically a magnet for longer-tenancy family renters. What's the average tenant stay here, and is there a school-zone premium baked into asking?
- Crime grade is F in this area — have there been break-ins, vandalism, or insurance claims at this property in the last 3 years? What carrier currently insures it and at what premium?
- The area grade is low — what's the realistic commute time and amenity access for the typical tenant pool here? Any planned neighborhood developments (good or bad) we should know about?
- What's the average days-on-market for RENTAL listings here right now (not sales)? A rising rental-DOM trend means longer vacancies and softer asking-rent achievability than the comps imply.
- What's the recent tenant-quality profile in this submarket — average credit score on applications, eviction rate, late-payment / NSF rate, and stable-employment percentage? A property-management company in the area should have these aggregated.
- How much new apartment / multifamily construction is in the pipeline within 1–3 miles? Heavy new supply (>2% of stock underway) typically softens rents 12–24 months out; light construction supports rent growth.
Investment metrics
- 1% rule
- 0.78% ✗
- Cap rate
- 6.22%
- Cash-on-cash
- -0.27%
- DSCR
- 0.99
- GRM
- 10.7
CMA / ARV
- ARV (on-the-fly)
- $1,064,880
- Comps found
- 8
Show comp detail 8 sales within ~0.75 mi
| Address | Dist | Beds/Ba | Sqft | Sold | Price | $/sf | Match |
|---|---|---|---|---|---|---|---|
| 822 E 215th St | 0.20mi | 8/3.0 (-1) | 3,420 (+12%) | 1mo | $1,190,000 | $348 | 50 |
| 709 East 213th St | 0.37mi | 8/3.0 (-1) | 3,120 (+2%) | 14mo | $1,040,000 | $333 | 48 |
| 3002 Barnes Ave | 0.56mi | 8/4.0 (-1) | 3,214 (+5%) | 9mo | $1,225,000 | $381 | 38 |
| 3016 Bouck Ave | 0.67mi | 9/5.0 | 3,100 (+1%) | 20mo | $1,222,222 | $394 | 38 |
| 725 E 216th St | 0.37mi | 8/6.0 (-1) | 3,330 (+9%) | 21mo | $980,000 | $294 | 37 |
| 3641 Olinville Ave | 0.52mi | 8/4.0 (-1) | 2,826 (-8%) | 13mo | $1,000,007 | $354 | 32 |
| 3001 Olinville Ave | 0.73mi | 8/5.0 (-1) | 3,340 (+9%) | 6mo | $1,100,000 | $329 | 28 |
| 855 E 223rd St | 0.56mi | 8/5.0 (-1) | 3,252 (+6%) | 22mo | $960,000 | $295 | 28 |
Match score weights: distance 35% · size 25% · config 20% · recency 20%. Top-matched comps best support the ARV.
Projected returns pro-forma
-3.0% appreciation · 4.33% rent growth · sell at horizon
- IRR
- -15.5%
- Equity multiple
- 0.44×
- Total profit
- $-185,270
- Equity at exit
- $177,284
- IRR
- -5.1%
- Equity multiple
- 0.65×
- Total profit
- $-116,209
- Equity at exit
- $102,803
Cash invested: $332,920 (down + closing). Projections, not guarantees.
Landlord ↔ Tenant lean methodology
- Overall (CITY)
- 0 Strongly Tenant-Friendly
- State New York
- 15 Strongly Tenant-Friendly · D+10
- County
- — inherits STATE
- City New York
- 0 Strongly Tenant-Friendly · D+34
ZIP-level market 10469
- Rents YoY
- 4.3%
- Active inventory
- 203
- Price-to-rent
- 32.2×
Monthly cashflow live
- Estimated rent
- $9,231 medium interval (Pro) →
- Mortgage (P&I)
- −$6,235
- Tax from tax record
- −$636 /mo · $7,634/yr
- Insurance
- −$495
- HOA
- −$0
- Vacancy / Maint / Mgmt
- −$1,939
- Net cashflow
- $-74
Break-even live
Sensitivity live
| Price | -10% $599 | -5% $262 | +0% $-74 | +5% $-411 | +10% $-747 |
|---|---|---|---|---|---|
| Rent | -10% $-804 | -5% $-439 | +0% $-74 | +5% $290 | +10% $655 |
| Rate | -1.0pp $524 | -0.5pp $228 | base $-74 | +0.5pp $-382 | +1.0pp $-696 |
3-unit breakdown (identical units grouped — click to expand)
| Units | Beds | Baths | Est. rent |
|---|---|---|---|
| 3× units | 3 | 2.7 | $9,231 |
| #1 | 3 | 2.7 | $3,077 |
| #2 | 3 | 2.7 | $3,077 |
| #3 | 3 | 2.7 | $3,077 |
| Total (3 units) | $9,231 | ||
UW: 25.0% down · 7.5% · 30yr · 1.5% tax · 5.0% vac · 8.0% maint · 8.0% mgmt
Financing live
Cash to close
- Down payment
- $297,250
- Closing costs
- $35,670
- Reserves months
- —
- Total cash needed
- —
Loan-product check · same deal, 3 products live
Conventional
25% down · 7.5% · 30yr
- Down + closing
- —
- Monthly P&I
- —
- Monthly cashflow
- —
- DSCR
- —
- Eligible?
- —
Personal DTI + credit; lowest rate.
DSCR
20% down · 8.5% · 30yr
- Down + closing
- —
- Monthly P&I
- —
- Monthly cashflow
- —
- DSCR
- —
- Eligible?
- —
No personal income docs; deal must DSCR.
Hard money
10% down · 12.0% · 12mo
- Down + closing
- —
- Monthly P&I
- —
- Monthly cashflow
- —
- DSCR
- —
- Eligible?
- —
Short-term bridge; refi at stabilization.
Listing history 14 events
-
2026-06-21days on market $1,189,000 Active 112 DOM
-
2026-06-18days on market $1,189,000 Active 109 DOM
-
2026-06-17days on market $1,189,000 Active 108 DOM
-
2026-06-15days on market $1,189,000 Active 106 DOM
-
2026-06-13days on market $1,189,000 Active 104 DOM
-
2026-06-10days on market $1,189,000 Active 100 DOM
-
2026-06-08days on market $1,189,000 Active 99 DOM
-
2026-06-08days on market $1,189,000 Active 98 DOM
-
2026-06-04days on market $1,189,000 Active 95 DOM
-
2026-06-03days on market $1,189,000 Active 94 DOM
-
2026-06-01days on market $1,189,000 Active 92 DOM
-
2026-05-31days on market $1,189,000 Active 91 DOM
-
2026-03-01$1,189,000 Active
-
2004-04-06soldstatus $210,000
ⓘ Source: listings_history table (triggers on properties + properties_extension) + one-shot
backfill from property_details.listing_events for pre-trigger history.
Tax reassessment forecast NY · Partial reset (capped growth)
- Current annual tax
- $7,634 · $636/mo
- Projected year-2 tax
- $13,864 · $1,155/mo
- Expected delta
- +$6,230/yr (+$519/mo · 81.6%)
ⓘ Screening estimate from a state-policy table — verify with the county assessor before closing.
Climate risk First Street
- Flood 1/10 Low FEMA zone X (unshaded) · 0% chance over 30 yrs
- Wildfire 1/10 Low
- Heat 6/10 Major 7 d/yr ≥99°F today · 15 d/yr by 30 yrs out
- Wind 6/10 Major 27% chance of damaging wind over 30 yrs
- Air quality 3/10 Moderate 3 unhealthy d/yr today · 4 by 30 yrs out
Nearby sold comps map
Loading sold comps map…
Walkable amenities ~0.75 mi
Loading nearby amenities…
Taxation est. · year 1
- Rental income
- $110,772
- − Mortgage interest
- −$66,602
- − Property taxes
- −$7,634
- − Insurance
- −$5,945
- − Repairs & maintenance
- −$8,862
- − Management
- −$8,862
- − Depreciation
- −$34,589
- Taxable loss
- −$21,722
- Est. tax savings @ 24.0%
- +$5,213
- After-tax cash flow
- $4,321/yr
For passive investors: Depreciation is non-cash, so a rental often shows a tax loss while cash-flowing — sheltering income. Rental losses are passive: they offset passive income freely, and up to $25,000/yr can offset ordinary (W-2) income if you actively participate and your MAGI is under $100k (phasing out to $0 by $150k); unused losses carry forward. On sale, claimed depreciation is recaptured at up to 25%, and gains may owe capital-gains tax (a 1031 exchange can defer both). Figures are a year-1 estimate at your 24.0% rate — not tax advice; consult a CPA.
Schools (NCES district)
No district data.
Livability — New York
- Score
- 75/100
- State rank
- #268
- US rank
- #4188
Category grades
Schools grade is shown separately in the Schools card above.
Census & demographics
- Census place
- New York, NY
- County
- Bronx County · 1,197,324 people
- City population
- 7,731,280
- Metro
- New York-Newark-Jersey City, NY-NJ-PA
- Population (ZIP)
- 68,521
- Household income
- $76,020
- Rent vs Own
- Severe rent burden
- 3706.0
Population outlook (Bronx County) Hauer SSP2
- Today (2025)
- 1,607,353 people
- By 2030
- 1,681,852 · +4.6%
- By 2040
- 1,824,421 · +13.5%
- By 2050
- 1,945,470 · +21.0%
- By 2075
- 2,187,887 · +36.1%
- By 2100
- 2,244,136 · +39.6%
Race, ethnicity, and origin ACS 2023
- Neighborhood character
- Diverse neighborhood (Simpson 0.62)
- Race & ethnicity
- Black 54% Hispanic / Latino 27% White 8% Two or more races 8% Asian 6%
- Hispanic origin (detail)
- Mexican 1% Puerto Rican 11% Dominican 9%
- Foreign-born
- 37% · Canada, Vietnam, China
- Languages at home
- 62% English-only · Spanish 22% Other Indo-European 5% French/Haitian/Cajun 3%
Political lean MEDSL · Bronx
- 2024 margin
- Solid D (+45.4) · D 72.7% · R 27.3%
- 2008→2024 swing
- -32.3pp toward R · 2008: 77.8pp · 2024: 45.4pp
- All cycles
- 2024: D+45.4 2020: D+67.6 2016: D+79.1 2012: D+82.9 2008: D+77.8
Not yet ingested
- Civics
- —
Market trends
- HPI YoY
- ▼ -524.76%
- Current HPI
- 321.9213
- Rent YoY
- ▲ 4.33%
- Metro
- New York-Newark-Jersey City, NY-NJ-PA
- State GDP YoY
- ▲ 2.60%
- F500 in state
- 92
Industry mix (Fortune 500 HQ in NY)
| Industry | F500 HQs | Revenue |
|---|---|---|
| Financial Services | 10 | $950B |
|
||
| Consumer Goods | 9 | $162B |
|
||
| Insurance | 4 | $225B |
|
||
| Telecommunications | 2 | $144B |
|
||
| Pharmaceuticals | 2 | $112B |
|
||
| Media / Entertainment | 2 | $69B |
|
||
Price history
+466.2% since first listed2 events — show timeline
- 2026-03-01 Listed $1,189,000 OneKey® MLS as Distributed by MLS Grid
- 2004-04-06 Sold (Public Records) $210,000 Public Records
Property tax history
+2.2%/yrLatest (2025): $7,634 · +6.0% YoY. Source: county tax records.
Cash-flow waterfall
monthlySold comps — $/sqft
last 12 mo · ≤1 miLoading sold comps…