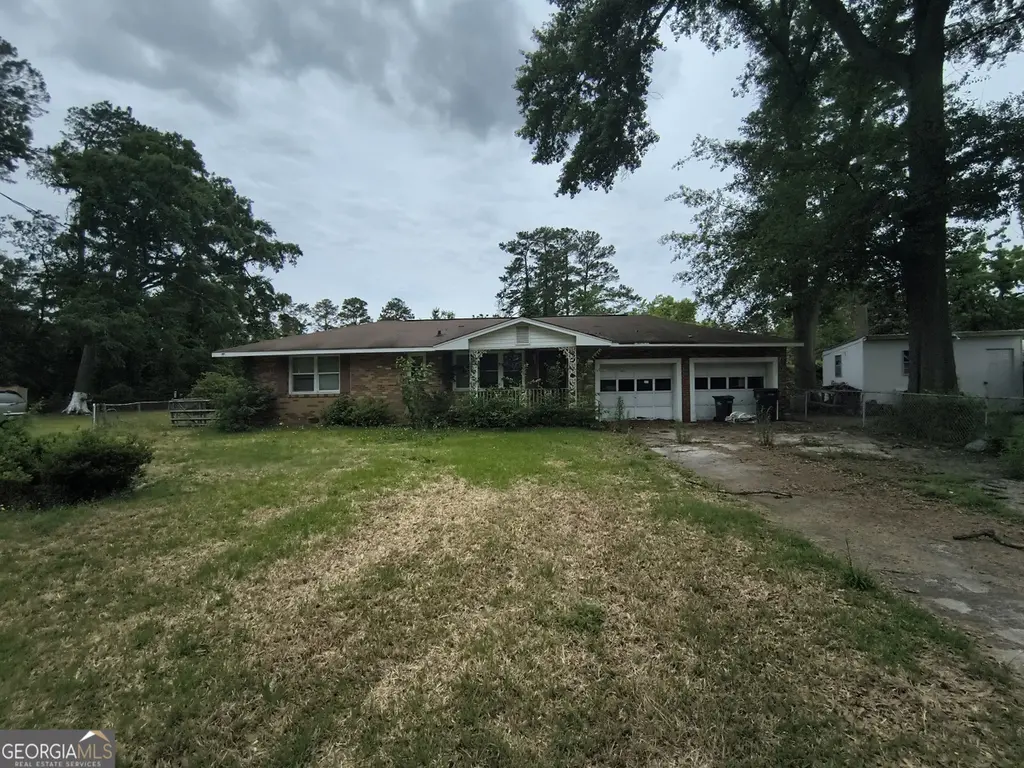
1762 Cornell Dr · Augusta-Richmond County consolidated government (balance), GA
Flood risk 1/10 · Minimal
- FEMA flood zone
- X (unshaded)
- Chance of flooding over 30 yrs
- 0.0%
- Est. flood insurance / yr
- $507 – $1,088
Fire risk 1/10 · Minimal
- Est. fire insurance / yr
- $963 – $1,789
Heat risk 8/10 · Major
- Hot days now (above 108°F)
- 7 days/yr
- Hot days in 30 yrs
- 17 days/yr
Wind risk 6/10 · Moderate
- Chance of severe wind over 30 yrs
- 73.0%
Air-quality risk 4/10 · Minor
- Unhealthy air days now
- 4 days/yr
- Unhealthy air days in 30 yrs
- 4 days/yr
Risk factors via First Street. Map © Google.
Why this score? — see what drove the B- grade
The composite is a weighted blend of 9 inputs, each scored 0–100. Each bar is that input's sub-score; the figure is the points it added to the 100-point composite (weight × sub-score).
- Cash flow +30.0/30.0
- 1% rule +10.0/10.0
- DSCR +10.0/10.0
- ARV discount +7.5/15.0
- Rent growth +3.6/5.0
- Livability +2.5/5.0
- Condition / age +2.5/5.0
- Schools +1.3/10.0
- Appreciation +0.0/10.0
$96,810
🖨 Deal sheet 📄 Offer letter ✓ Due diligence
Listing remarks
All offers must be submitted through Auction during the auction period. Decisions may take up to one week. Bank employees, individual insiders, impacted third parties, and their household members are prohibited from purchasing. Property is sold as-is. Although the property is vacant, do not enter unless interior access is available. No for sale sign.
Key facts
- 0.33 acre lot
- Garage
- Built 1955
Property features AI
Finance
- Financial info: Listing offered As-Is; Financing accepted: Cash, Conventional, FHA, VA
- HOA & community: Has association; association fee covers other items
Exterior
- Parking: Attached garage with space for 2 vehicles
- Utilities: Public water; Public sewer; Utilities: Other
- Home design: Single-family house; Residential resale; One story
- Construction: Built in 1955; Brick construction; Composition roof
- Exterior features: Corner lot; Community sidewalks and street lights
Interior
- Kitchen: Appliances: Other
- Bedrooms: 4 bedrooms on the main level
- Flooring: Hardwood
- Bathrooms: 2 full bathrooms (both on the main level)
- Heating & cooling: Heating: Other; Cooling: Other
- Interior features: One-level layout; Fireplace (1); Hardwood flooring; Public records list living area as 1,985
- Laundry & utility: Laundry features: Other
Neighborhood map
What this means for you Summary
Snapshot
- This is a 4-bed/2.0-bath single-family listed at $97k.
Deal economics
- At list price, monthly cash flow is $651 ($8k/yr) — positive.
- The deal already cash-flows at list — no discount required.
- Meets the 1% rule at list price ($2k rent vs $97k).
- Recommended offer: $95k (1.5% below list) — sets the bar for market timing.
- Cap rate 14.4% vs local median 5.3% in Augusta-Richmond County consolidated government (balance) — top-decile yield for the area; either an underpriced asset or a hidden risk that comps aren't pricing in. Stress-test before assuming the spread holds.
Location & tenants
- Location reads: area grade B — affects rentability + tenant quality, not the cash-flow math above.
- Richmond County (urban): math 12% / reading 20% proficiency, ranked #154 of 174 in GA (top 88%) — low school quality limits family demand, transient renter base, plan for 1-2y turnover; 72% free/reduced lunch — lower-income household profile, screen leases tightly.
- Zoned schools: Wilkinson Gardens Elementary School (math 2% / reading 8%, grade F, #1,160 of 1,228 statewide, top 98%, 466 students, 98% FRL); Murphey Middle School (math 0% / reading 6%, grade F, #469 of 470 statewide, top 100%, 635 students, 98% FRL) — zoned schools average 98% FRL vs 72% district-wide (26 pts higher); higher-poverty schools than district average — tighter screening recommended.
- Market conditions: Rents rising fast (+4.3%/yr); 222 active listings in the ZIP; 17 comparable units currently listed for rent nearby; rentals lingering (median 44d on market — plan ~5-8 weeks vacancy on turnover, expect pricing pressure); 59% of comp listings sitting > 30 days — soft ceiling on asking rent; 561 units permitted in Richmond County in 2024 (0 in 5+ unit buildings).
- This rent runs 45% of the median local income ($47k/yr) — at the standard rent-burdened threshold; future hikes will face affordability resistance.
Forward outlook
- Local home prices are declining (-3.0%/yr); year-one equity from $670 of loan paydown is wiped out by about $3k of value loss. Plan a longer hold.
- Richmond County population projected to shrink 5% by 2050 — rents likely to lag national; underwrite the cash flow, not the appreciation.
- At projected returns (-3.0% appreciation + 4.3% rent growth), your $27k cash investment doubles in ~4 years — after that, you're playing with house money.
Negotiation context
- It's been on market 27 days — a 2% lower offer ($95k) is reasonable based on typical stale-listing flexibility.
- Current owner paid $57k; list at $97k implies a 70% gain — meaningful room to come down on a strong offer.
Risks & watch-outs
- Watch-outs: built in 1955 — expect roof / HVAC / electrical / plumbing capex.
- Climate carrying-cost: major wind risk, 73% chance of damaging wind over 30y; extreme-heat days projected 7→17/yr by 2055 (HVAC capex compounding) — expect insurance premiums to compound above CPI over the hold.
Questions for the listing agent
- Built in 1955 — when were the roof, HVAC, electrical panel, plumbing, and water heater last replaced?
- Is there a deadline driving the sale (1031 exchange, divorce, estate, relocation)? That informs how much negotiation room exists.
- What's the average days-on-market for RENTAL listings here right now (not sales)? A rising rental-DOM trend means longer vacancies and softer asking-rent achievability than the comps imply.
- What's the recent tenant-quality profile in this submarket — average credit score on applications, eviction rate, late-payment / NSF rate, and stable-employment percentage? A property-management company in the area should have these aggregated.
- How much new for-sale + rental construction is in the pipeline within 1–3 miles? Heavy new supply typically softens prices + rents 12–24 months out; constrained supply supports both.
Investment metrics
- 1% rule
- 1.79% ✓
- Cap rate
- 14.37%
- Cash-on-cash
- 28.84%
- DSCR
- 2.28
- GRM
- 4.7
CMA / ARV
- ARV (on-the-fly)
- $198,500
- Comps found
- 6
Show comp detail 6 sales within ~0.75 mi
| Address | Dist | Beds/Ba | Sqft | Sold | Price | $/sf | Match |
|---|---|---|---|---|---|---|---|
| 2277 Hampton Ct | 0.39mi | 4/3.5 | 1,950 (-2%) | 11mo | $190,000 | $97 | 64 |
| 1613 Kissingbower Rd | 0.53mi | 3/2.0 (-1) | 1,904 (-4%) | 6mo | $190,000 | $100 | 58 |
| 1730 King Woods Dr | 0.32mi | 3/2.0 (-1) | 1,827 (-8%) | 13mo | $261,500 | $143 | 56 |
| 1822 Kissingbower RD Rd | 0.41mi | 3/1.5 (-1) | 1,810 (-9%) | 12mo | $140,000 | $77 | 49 |
| 1506 Myrtle Ln | 0.64mi | 3/2.0 (-1) | 1,768 (-11%) | 7mo | $298,000 | $169 | 41 |
| 2010 Ryan Rd | 0.65mi | 5/2.0 (+1) | 2,216 (+12%) | 9mo | $154,900 | $70 | 38 |
Match score weights: distance 35% · size 25% · config 20% · recency 20%. Top-matched comps best support the ARV.
Projected returns pro-forma
-3.0% appreciation · 4.29% rent growth · sell at horizon
- IRR
- 24.7%
- Equity multiple
- 2.04×
- Total profit
- $28,132
- Equity at exit
- $14,435
- IRR
- 33.3%
- Equity multiple
- 4.24×
- Total profit
- $87,738
- Equity at exit
- $8,370
Cash invested: $27,107 (down + closing). Projections, not guarantees.
Landlord ↔ Tenant lean methodology
- Overall (STATE)
- 90 Strongly Landlord-Friendly
- State Georgia
- 90 Strongly Landlord-Friendly · R+3
- County
- — inherits STATE
- City
- — inherits STATE
ZIP-level market 30904
- Rents YoY
- 4.3%
- Active inventory
- 222
- Price-to-rent
- 4.7×
Monthly cashflow live
- Estimated rent
- $1,733 high interval (Pro) →
- Mortgage (P&I)
- −$508
- Tax from tax record
- −$169 /mo · $2,033/yr
- Insurance
- −$40
- HOA
- −$0
- Vacancy / Maint / Mgmt
- −$364
- Net cashflow
- $651
Break-even live
UW: 25.0% down · 7.5% · 30yr · 1.5% tax · 5.0% vac · 8.0% maint · 8.0% mgmt
Financing live
Cash to close
- Down payment
- $24,202
- Closing costs
- $2,904
- Reserves months
- —
- Total cash needed
- —
Loan-product check · same deal, 3 products live
Conventional
25% down · 7.5% · 30yr
- Down + closing
- —
- Monthly P&I
- —
- Monthly cashflow
- —
- DSCR
- —
- Eligible?
- —
Personal DTI + credit; lowest rate.
DSCR
20% down · 8.5% · 30yr
- Down + closing
- —
- Monthly P&I
- —
- Monthly cashflow
- —
- DSCR
- —
- Eligible?
- —
No personal income docs; deal must DSCR.
Hard money
10% down · 12.0% · 12mo
- Down + closing
- —
- Monthly P&I
- —
- Monthly cashflow
- —
- DSCR
- —
- Eligible?
- —
Short-term bridge; refi at stabilization.
Rent comps 17 comps
| Address | Beds | Baths | Sqft | Rent | $/sqft | DOM | Units | Dist |
|---|---|---|---|---|---|---|---|---|
| 1613 Pendleton Rd Augusta, GA | 3.0 | 2.0 | 1418 | $1,695 | $1.20 | 13d | 1 | 0.59mi |
| 1508 Heard Ave Augusta, GA | 3.0 | 2.0 | 1314 | $1,400 | $1.07 | 43d | 1 | 0.68mi |
| 2730 Lakewood Dr Augusta, GA | 3.0 | 1.5 | 1460 | $1,550 | $1.06 | 43d | 1 | 0.77mi |
| 2730 Lakewood Dr Augusta, GA | 3.0 | 1.5 | 1460 | $1,550 | $1.06 | 23d | 1 | 0.77mi |
| 1432 Heard Ave Augusta, GA | 3.0 | 2.0 | 1278 | $1,500 | $1.17 | 43d | 1 | 0.80mi |
| 2139 Holt St Augusta, GA | 3.0 | 2.0 | 1611 | $1,550 | $0.96 | 43d | 1 | 0.85mi |
| 2139 Holt St Augusta, GA | 3.0 | 2.0 | 1611 | $1,475 | $0.92 | 23d | 1 | 0.85mi |
| 1917 Lazenby Dr Augusta, GA | 3.0 | 2.0 | 1606 | $1,300 | $0.81 | 44d | 1 | 1.12mi |
| 1917 Lazenby Dr Augusta, GA | 3.0 | 2.0 | 1606 | $1,300 | $0.81 | 43d | 1 | 1.12mi |
| 1315 Merry St Augusta, GA | 3.0 | 2.0 | 1610 | $1,450 | $0.90 | 23d | 1 | 1.21mi |
| 1812 Central Ave Augusta, GA | 3.0 | 1.5 | 1568 | $2,200 | $1.40 | 23d | 1 | 1.23mi |
| 1812 Central Ave Augusta, GA | 3.0 | 1.5 | 1568 | $2,200 | $1.40 | 43d | 1 | 1.23mi |
| 1812 Central Ave Unit 1 Augusta, GA | 3.0 | 1.5 | 1528 | $2,600 | $1.70 | 43d | 1 | 1.23mi |
| 2140 Kelly St Augusta, GA | 4.0 | 2.0 | 1650 | $1,500 | $0.91 | 43d | 1 | 1.23mi |
| 1549 Craig St Unit 00 1559 Augusta, GA | 3.0 | 3.0 | 1359 | $1,600 | $1.18 | 43d | 1 | 1.26mi |
| 1105 Merry St Augusta, GA | 3.0 | 1.0 | 1281 | $1,350 | $1.05 | 23d | 1 | 1.49mi |
| 1480 Wrightsboro Rd Augusta, GA | 1.0–3.0 | 1.0–2.0 | 1046 | $2,375 | $2.27 | 21d | 13 | 1.50mi |
Listing history 16 events
-
2026-06-18days on market $96,810 Active 27 DOM
-
2026-06-17days on market $96,810 Active 26 DOM
-
2026-06-16days on market $96,810 Active 25 DOM
-
2026-06-15days on market $96,810 Active 24 DOM
-
2026-06-14days on market $96,810 Active 22 DOM
-
2026-06-10days on market $96,810 Active 19 DOM
-
2026-06-09days on market $96,810 Active 18 DOM
-
2026-06-08days on market $96,810 Active 17 DOM
-
2026-06-07statusdays on market $96,810 Active 16 DOM
-
2026-06-03days on market $96,810 New 12 DOM
-
2026-06-02days on market $96,810 New 11 DOM
-
2026-06-01days on market $96,810 New 10 DOM
-
2026-05-31days on market $96,810 New 9 DOM
-
2026-05-30days on market $96,810 New 8 DOM
-
2026-05-22$96,810 New
-
2021-10-25soldstatus $57,000
ⓘ Source: listings_history table (triggers on properties + properties_extension) + one-shot
backfill from property_details.listing_events for pre-trigger history.
Tax reassessment forecast GA · Resets to sale price
- Current annual tax
- $2,033 · $169/mo
- Projected year-2 tax
- $2,033 · $169/mo
- Expected delta
- $0/yr ($0/mo · 0.0%)
ⓘ Screening estimate from a state-policy table — verify with the county assessor before closing.
Climate risk First Street
- Flood 1/10 Low FEMA zone X (unshaded) · 0% chance over 30 yrs
- Wildfire 1/10 Low
- Heat 8/10 Severe 7 d/yr ≥108°F today · 17 d/yr by 30 yrs out
- Wind 6/10 Major 73% chance of damaging wind over 30 yrs
- Air quality 4/10 Moderate 4 unhealthy d/yr today · 4 by 30 yrs out
Nearby sold comps map
Loading sold comps map…
Walkable amenities ~0.75 mi
Loading nearby amenities…
Taxation est. · year 1
- Rental income
- $20,791
- − Mortgage interest
- −$5,423
- − Property taxes
- −$2,033
- − Insurance
- −$484
- − Repairs & maintenance
- −$1,663
- − Management
- −$1,663
- − Depreciation
- −$2,816
- Taxable income
- $6,709
- Est. tax owed @ 24.0%
- −$1,610
- After-tax cash flow
- $6,206/yr
For passive investors: Depreciation is non-cash, so a rental often shows a tax loss while cash-flowing — sheltering income. Rental losses are passive: they offset passive income freely, and up to $25,000/yr can offset ordinary (W-2) income if you actively participate and your MAGI is under $100k (phasing out to $0 by $150k); unused losses carry forward. On sale, claimed depreciation is recaptured at up to 25%, and gains may owe capital-gains tax (a 1031 exchange can defer both). Figures are a year-1 estimate at your 24.0% rate — not tax advice; consult a CPA.
Schools (NCES district)
- District
- Richmond County
- NCES district ID
- 1304380
- Math proficiency
- 12% ▼ -9.00%
- Reading proficiency
- 20% ▼ -6.00%
- Median HH income
- $38,069
- Composite
- 13.43/100
- National rank
- #9524
- State rank
- #154 of 174 in GA
Livability — Augusta-Richmond County consolidated government (balance)
No livability data for this city. (Only ~50 U.S. cities are tracked.)
Census & demographics
- Census place
- Augusta-Richmond County consolidated government (balance), GA
- County
- Richmond County · 190,917 people
- City population
- 154,035
- Metro
- Augusta-Richmond County, GA-SC
- Population (ZIP)
- 23,400
- Household income
- $46,696
- Rent vs Own
- Severe rent burden
- 1594.0
Population outlook (Richmond County) Hauer SSP2
- Today (2025)
- 200,753 people
- By 2030
- 200,232 · -0.3%
- By 2040
- 196,813 · -2.0%
- By 2050
- 190,347 · -5.2%
- By 2075
- 172,496 · -14.1%
- By 2100
- 146,284 · -27.1%
Race, ethnicity, and origin ACS 2023
- Neighborhood character
- Diverse neighborhood (Simpson 0.61)
- Race & ethnicity
- Black 47% White 41% Hispanic / Latino 6% Two or more races 6% Asian 2%
- Hispanic origin (detail)
- Mexican 1%
- Common ancestry
- Italian 1% Slovak 1% Romanian 1%
- Foreign-born
- 3% · Canada, South Korea, Jamaica
- Languages at home
- 93% English-only · Spanish 4% Korean 1%
Political lean MEDSL · Richmond
- 2024 margin
- Solid D (+36.1) · D 67.8% · R 31.7%
- 2008→2024 swing
- +4.3pp toward D · 2008: 31.8pp · 2024: 36.1pp
- All cycles
- 2024: D+36.1 2020: D+37.2 2016: D+32.4 2012: D+33.8 2008: D+31.8
Not yet ingested
- Civics
- —
Market trends
- HPI YoY
- ▼ -211.97%
- Current HPI
- 199.0807
- Rent YoY
- ▲ 4.29%
- Metro
- Augusta-Richmond County, GA-SC
- State GDP YoY
- ▲ 2.66%
- F500 in state
- 28
Industry mix (Fortune 500 HQ in GA)
| Industry | F500 HQs | Revenue |
|---|---|---|
| Paper / Packaging | 2 | $29B |
|
||
| Retail | 1 | $160B |
|
||
| Transportation / Logistics | 1 | $91B |
|
||
| Airlines | 1 | $62B |
|
||
| Consumer Goods | 1 | $47B |
|
||
| Utilities | 1 | $25B |
|
||
Price history
+69.8% since first listed2 events — show timeline
- 2026-05-22 Listed $96,810 GAMLS
- 2021-10-25 Sold (Public Records) $57,000 Public Records
Property tax history
+12.8%/yrLatest (2025): $2,033 · +0.8% YoY. Source: county tax records.
Cash-flow waterfall
monthlySold comps — $/sqft
last 12 mo · ≤1 miLoading sold comps…