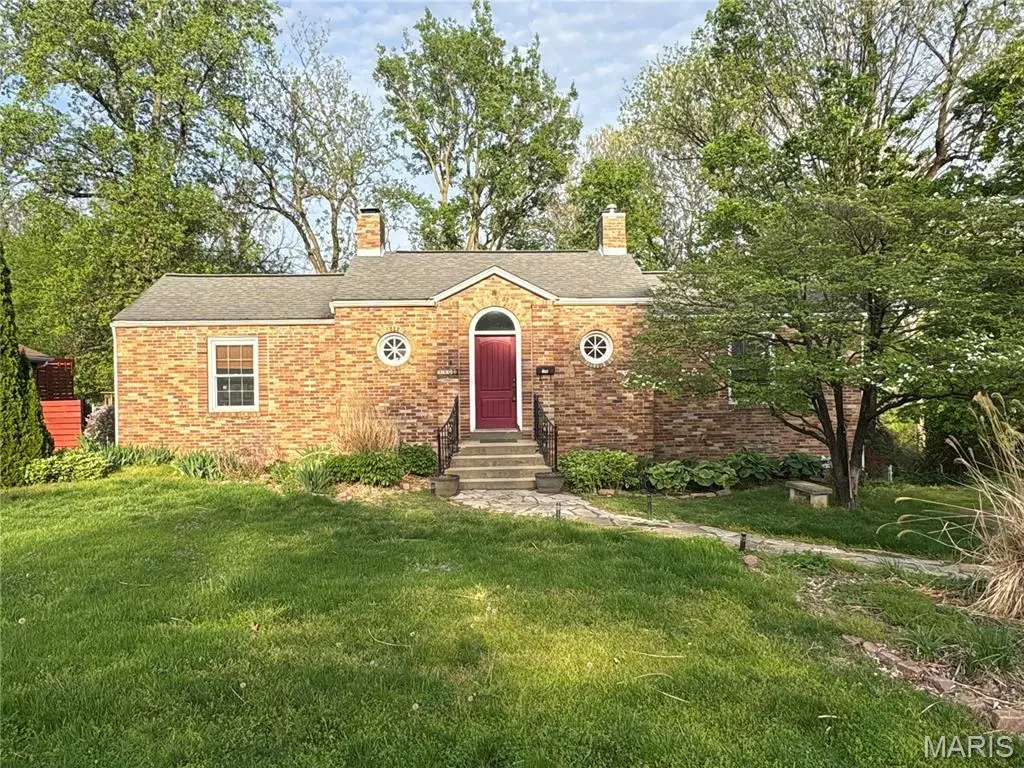
150 Helen Pl · Collinsville, IL
Flood risk 1/10 · Minimal
- FEMA flood zone
- X
- Chance of flooding over 30 yrs
- 0.0%
- Est. flood insurance / yr
- $473 – $860
Fire risk 1/10 · Minimal
- Est. fire insurance / yr
- $804 – $1,492
Heat risk 5/10 · Moderate
- Hot days now (above 107°F)
- 7 days/yr
- Hot days in 30 yrs
- 21 days/yr
Wind risk 2/10 · Minimal
- Chance of severe wind over 30 yrs
- 1.0%
Air-quality risk 3/10 · Minor
- Unhealthy air days now
- 3 days/yr
- Unhealthy air days in 30 yrs
- 4 days/yr
Risk factors via First Street. Map © Google.
Why this score? — see what drove the D grade
The composite is a weighted blend of 9 inputs, each scored 0–100. Each bar is that input's sub-score; the figure is the points it added to the 100-point composite (weight × sub-score).
- ARV discount +15.0/15.0
- Cash flow +10.9/30.0
- 1% rule +4.0/10.0
- Livability +3.4/5.0
- Rent growth +3.3/5.0
- DSCR +3.2/10.0
- Condition / age +2.5/5.0
- Schools +1.6/10.0
- Appreciation +0.0/10.0
$139,900
🖨 Deal sheet (PDF) 📄 Offer letter ✓ Due diligence
Listing remarks MLS
LOTS of UPDATES throughout. Kraftmade Kitchen Cabinets, Corian Counter tops, Roof in yr 2009. Remodled baths. New Sun Room & Deck yr 2013 measures approx 38 x 14' overlooks private fenced yard, that backs up to woods. Walk-Out Basement offers 3rd Bdrm with 2nd Fireplace, Rec Room, Half Bath, Laundry. CHARMING HOME LOADED WITH CHARACHTER & Arch doorways, French Doors & hardwood floors. Come see inside today.
Key facts
- 9,147 sq ft lot
- 2 parking spots
- Built 1938
Property features AI
Finance
- Other: Living area reported as 2,304 total (1,320 above grade, 984 below grade)
- Financial info: Lease not considered; No second mortgage on record
Exterior
- Parking: 2 parking spaces
- Utilities: Public water; Public sewer; Electric service (Ameren); Natural gas available; Electricity available; Sewer available; Water available
- Home design: Single family residence; One story
- Construction: Brick veneer exterior; Architectural shingle roof
- Exterior features: Deck; Rear porch; Back yard fencing; Few trees; Level lot
Interior
- Kitchen: Range; Refrigerator
- Bedrooms: 2 bedrooms on the main level
- Flooring: Hardwood
- Bathrooms: 1 full bath; 1 half bath; Half bath on lower level
- Heating & cooling: Forced air heating (natural gas); Central air conditioning
- Interior features: Built-in features; Walk-out basement access; Two fireplaces (living room and one other)
- Laundry & utility: Washer; Dryer
Neighborhood map
What this means for you Summary
Snapshot
- This is a 2-bed/3.0-bath single-family listed at $140k.
Deal economics
- At list price, monthly cash flow is $-62 ($-746/yr) — negative.
- To cash-flow at today's rent, offer at most $129k (7.9% below list).
- To meet the 1% rule (rent ≥ 1% of price), the offer needs to be $126k (9.8% below list).
- Recommended offer: $126k (9.8% below list) — sets the bar for 1% rule.
- Cap rate 5.8% vs local median 4.3% in Collinsville — top-decile yield for the area; either an underpriced asset or a hidden risk that comps aren't pricing in. Stress-test before assuming the spread holds.
Location & tenants
- Location reads 67/100 on livability (#491 in IL) — a middle-class / working-renter tenant base. Strengths: cost of living A+, housing A+, crime B; Watch: amenities F, commute F, health & safety F.
- Collinsville CUSD 10 (suburban): math 14% / reading 20% proficiency, ranked #465 of 620 in IL (top 75%) — low school quality limits family demand, transient renter base, plan for 1-2y turnover.
- Zoned schools: Jefferson Elem School (math 34% / reading 34%, grade F, #517 of 2,056 statewide, top 28%, 86 students, 0% FRL); Collinsville Middle School (math 11% / reading 19%, grade F, #501 of 665 statewide, top 77%, 950 students, 0% FRL); Collinsville High School (math 16% / reading 21%, grade F, #427 of 693 statewide, top 62%, 1,978 students, 0% FRL) — zoned schools average 0% FRL vs 52% district-wide (52 pts lower); this property's tenant base skews higher-income than the district average.
- Market conditions: Rents rising (+3.1%/yr); 84 active listings in the ZIP; 1 comparable units currently listed for rent nearby; 783 units permitted in St. Clair County in 2024 (378 in 5+ unit buildings).
Forward outlook
- Local home prices are declining (-3.0%/yr); year-one equity from $967 of loan paydown is wiped out by about $4k of value loss. Plan a longer hold.
- St. Clair County population projected at -23% by 2050 — secular population decline; favor cash flow + early exit over multi-decade hold.
Negotiation context
- It's been on market 15 days — a 2% lower offer ($138k) is reasonable based on typical stale-listing flexibility.
- 2 sale attempts since 12y ago; this cycle's ask has dropped $10k (7%) from the opening price — seller is motivated, your offer sets the floor, not the list.
Risks & watch-outs
- Watch-outs: built in 1938 — expect roof / HVAC / electrical / plumbing capex.
- Climate carrying-cost: extreme-heat days projected 7→21/yr by 2055 (HVAC capex compounding) — expect insurance premiums to compound above CPI over the hold.
Questions for the listing agent
- What do current leases actually rent for vs. the listed asking? Can we see a recent rent roll and the last 12 months of T-12 income?
- Built in 1938 — when were the roof, HVAC, electrical panel, plumbing, and water heater last replaced?
- Is there a deadline driving the sale (1031 exchange, divorce, estate, relocation)? That informs how much negotiation room exists.
- Schools are D-rated, which usually means shorter tenancies and higher turnover. Who's the typical renter profile here, and what's been the actual vacancy rate?
- The area grade is low — what's the realistic commute time and amenity access for the typical tenant pool here? Any planned neighborhood developments (good or bad) we should know about?
- What's the average days-on-market for RENTAL listings here right now (not sales)? A rising rental-DOM trend means longer vacancies and softer asking-rent achievability than the comps imply.
- What's the recent tenant-quality profile in this submarket — average credit score on applications, eviction rate, late-payment / NSF rate, and stable-employment percentage? A property-management company in the area should have these aggregated.
- How much new for-sale + rental construction is in the pipeline within 1–3 miles? Heavy new supply typically softens prices + rents 12–24 months out; constrained supply supports both.
Investment metrics
- 1% rule
- 0.90% ✗
- Cap rate
- 5.76%
- Cash-on-cash
- -1.90%
- DSCR
- 0.92
- GRM
- 9.2
CMA / ARV
- ARV (median comp)
- $224,671
- List price
- $139,900
- Delta
- -37.73%
- Verdict
- UNDERPRICED
- Comps
- 20 within 1.0 mi
Show comp detail 12 sales within ~0.75 mi
| Address | Dist | Beds/Ba | Sqft | Sold | Price | $/sf | Match |
|---|---|---|---|---|---|---|---|
| 2 Fieldcrest Dr | 0.36mi | 2/2.0 | 2,006 (-4%) | 4mo | $215,000 | $107 | 69 |
| 406 Cypress Creek Rd | 0.31mi | 3/2.5 (+1) | 2,001 (-4%) | 5mo | $245,500 | $123 | 68 |
| 151 Helen Pl | 0.05mi | 3/2.0 (+1) | 1,870 (-10%) | 5mo | $219,900 | $118 | 67 |
| 401 Willowbrook Ln | 0.39mi | 3/2.5 (+1) | 2,101 (+1%) | 10mo | $229,500 | $109 | 66 |
| 706 Carl St | 0.46mi | 3/2.0 (+1) | 2,214 (+6%) | 5mo | $235,000 | $106 | 56 |
| 707 Carl St | 0.47mi | 3/2.0 (+1) | 1,932 (-8%) | 2mo | $225,000 | $116 | 55 |
| 24 N Crown Dr | 0.72mi | 3/2.0 (+1) | 2,094 (+0%) | 3mo | $179,000 | $85 | 54 |
| 1033 Villa Ridge Rd | 0.49mi | 3/1.0 (+1) | 1,884 (-10%) | 2mo | $59,900 | $32 | 47 |
| 106 Shadow Xing | 0.58mi | 3/2.5 (+1) | 1,860 (-11%) | 4mo | $269,900 | $145 | 44 |
| 820 Bond Ave | 0.48mi | 3/2.0 (+1) | 1,832 (-12%) | 5mo | $134,900 | $74 | 44 |
| 89 Fox Run Rd | 0.61mi | 3/2.0 (+1) | 1,846 (-12%) | 6mo | $295,000 | $160 | 38 |
| 805 Carl St | 0.61mi | 3/1.5 (+1) | 1,784 (-15%) | 3mo | $249,900 | $140 | 34 |
Match score weights: distance 35% · size 25% · config 20% · recency 20%. Top-matched comps best support the ARV.
Projected returns pro-forma
-3.0% appreciation · 3.1% rent growth · sell at horizon
- IRR
- -19.3%
- Equity multiple
- 0.33×
- Total profit
- $-26,427
- Equity at exit
- $20,860
- IRR
- -11.6%
- Equity multiple
- 0.30×
- Total profit
- $-27,282
- Equity at exit
- $12,096
Cash invested: $39,172 (down + closing). Projections, not guarantees.
Landlord ↔ Tenant lean methodology
- Overall (STATE)
- 43 Moderately Tenant-Leaning
- State Illinois
- 43 Moderately Tenant-Leaning · D+7
- County
- — inherits STATE
- City
- — inherits STATE
ZIP-level market 62234
- Home prices YoY
- -17.1%
- Rents YoY
- 3.1%
- Active inventory
- 84
- Price-to-rent
- 9.2×
Monthly cashflow live
- Estimated rent
- $1,262 medium interval (Pro) →
- Mortgage (P&I)
- −$734
- Tax from tax record
- −$267 /mo · $3,207/yr
- Insurance
- −$58
- HOA
- −$0
- Vacancy / Maint / Mgmt
- −$265
- Net cashflow
- $-62
Break-even live
Sensitivity live
| Price | -10% $17 | -5% $-23 | +0% $-62 | +5% $-102 | +10% $-141 |
|---|---|---|---|---|---|
| Rent | -10% $-162 | -5% $-112 | +0% $-62 | +5% $-12 | +10% $38 |
| Rate | -1.0pp $8 | -0.5pp $-27 | base $-62 | +0.5pp $-98 | +1.0pp $-135 |
UW: 25.0% down · 7.5% · 30yr · 1.5% tax · 5.0% vac · 8.0% maint · 8.0% mgmt
Financing live
Cash to close
- Down payment
- $34,975
- Closing costs
- $4,197
- Reserves months
- —
- Total cash needed
- —
Loan-product check · same deal, 3 products live
Conventional
25% down · 7.5% · 30yr
- Down + closing
- —
- Monthly P&I
- —
- Monthly cashflow
- —
- DSCR
- —
- Eligible?
- —
Personal DTI + credit; lowest rate.
DSCR
20% down · 8.5% · 30yr
- Down + closing
- —
- Monthly P&I
- —
- Monthly cashflow
- —
- DSCR
- —
- Eligible?
- —
No personal income docs; deal must DSCR.
Hard money
10% down · 12.0% · 12mo
- Down + closing
- —
- Monthly P&I
- —
- Monthly cashflow
- —
- DSCR
- —
- Eligible?
- —
Short-term bridge; refi at stabilization.
Rent comps 1 comps
| Address | Beds | Baths | Sqft | Rent | $/sqft | DOM | Units | Dist |
|---|---|---|---|---|---|---|---|---|
| 108 S Hesperia St Collinsville, IL | 2.0 | 2.0 | 1450 | $1,300 | $0.90 | 9d | 1 | 0.94mi |
Listing history 8 events
-
2026-05-08status Pending 926-char remark
-
2026-04-27price $139,900 926-char remark
-
2026-04-24$150,000 Active 926-char remark
-
2026-04-22historical $150,000 926-char remark
-
2014-07-02soldstatus $126,000
-
2014-06-27soldstatus 423-char remark
Show marketing remark (423 chars)
LOTS of UPDATES throughout. Kraftmade Kitchen Cabinets, Corian Counter tops, Roof in yr 2009. Remodled baths. New Sun Room & Deck yr 2013 measures approx 38 x 14' overlooks private fenced yard, that backs up to woods. Walk-Out Basement offers 3rd Bdrm with 2nd Fireplace, Rec Room, Half Bath, Laundry. CHARMING HOME LOADED WITH CHARACHTER & Arch doorways, French Doors & hardwood floors. Come see inside today.
-
2014-04-25$129,900 423-char remark
Show marketing remark (423 chars)
LOTS of UPDATES throughout. Kraftmade Kitchen Cabinets, Corian Counter tops, Roof in yr 2009. Remodled baths. New Sun Room & Deck yr 2013 measures approx 38 x 14' overlooks private fenced yard, that backs up to woods. Walk-Out Basement offers 3rd Bdrm with 2nd Fireplace, Rec Room, Half Bath, Laundry. CHARMING HOME LOADED WITH CHARACHTER & Arch doorways, French Doors & hardwood floors. Come see inside today.
-
2003-04-02soldstatus $900,000
ⓘ Source: listings_history table (triggers on properties + properties_extension) + one-shot
backfill from property_details.listing_events for pre-trigger history.
Tax reassessment forecast IL · Partial reset (capped growth)
- Current annual tax
- $3,207 · $267/mo
- Projected year-2 tax
- $3,207 · $267/mo
- Expected delta
- $0/yr ($0/mo · 0.0%)
ⓘ Screening estimate from a state-policy table — verify with the county assessor before closing.
Climate risk First Street
- Flood 1/10 Low FEMA zone X · 0% chance over 30 yrs
- Wildfire 1/10 Low
- Heat 5/10 Major 7 d/yr ≥107°F today · 21 d/yr by 30 yrs out
- Wind 2/10 Low 100% chance of damaging wind over 30 yrs
- Air quality 3/10 Moderate 3 unhealthy d/yr today · 4 by 30 yrs out
Nearby sold comps map
Loading sold comps map…
Walkable amenities ~0.75 mi
Loading nearby amenities…
Taxation est. · year 1
- Rental income
- $15,144
- − Mortgage interest
- −$7,837
- − Property taxes
- −$3,207
- − Insurance
- −$700
- − Repairs & maintenance
- −$1,212
- − Management
- −$1,212
- − Depreciation
- −$4,070
- Taxable loss
- −$3,092
- Est. tax savings @ 24.0%
- +$742
- After-tax cash flow
- $-4/yr
For passive investors: Depreciation is non-cash, so a rental often shows a tax loss while cash-flowing — sheltering income. Rental losses are passive: they offset passive income freely, and up to $25,000/yr can offset ordinary (W-2) income if you actively participate and your MAGI is under $100k (phasing out to $0 by $150k); unused losses carry forward. On sale, claimed depreciation is recaptured at up to 25%, and gains may owe capital-gains tax (a 1031 exchange can defer both). Figures are a year-1 estimate at your 24.0% rate — not tax advice; consult a CPA.
Schools (NCES district)
- District
- Collinsville CUSD 10
- NCES district ID
- 1710650
- Math proficiency
- 14% ▼ -9.00%
- Reading proficiency
- 20% ▼ -7.00%
- Median HH income
- $52,504
- Composite
- 15.65/100
- National rank
- #9288
- State rank
- #465 of 620 in IL
Livability — Collinsville
- Score
- 67/100
- State rank
- #491
- US rank
- #10221
Category grades
Schools grade is shown separately in the Schools card above.
Census & demographics
- Census place
- Collinsville, IL
- County
- Madison County · 189,064 people
- City population
- 31,648
- Metro
- St. Louis, MO-IL
- Population (ZIP)
- 31,648
- Household income
- $69,607
- Rent vs Own
- Severe rent burden
- 801.0
Population outlook (St. Clair County) Hauer SSP2
- Today (2025)
- 250,366 people
- By 2030
- 240,511 · -3.9%
- By 2040
- 217,391 · -13.2%
- By 2050
- 192,699 · -23.0%
- By 2075
- 140,637 · -43.8%
- By 2100
- 100,499 · -59.9%
Race, ethnicity, and origin ACS 2023
- Neighborhood character
- Predominantly White (73%)
- Race & ethnicity
- White 73% Black 13% Hispanic / Latino 10% Two or more races 8%
- Hispanic origin (detail)
- Mexican 7%
- Common ancestry
- Romanian 3% Lithuanian 3% Slovak 1%
- Foreign-born
- 4% · Canada
- Languages at home
- 92% English-only · Spanish 6%
Political lean MEDSL · St. Clair
- 2024 margin
- Lean D (+7.9) · D 53.0% · R 45.1% · Other 1.8%
- 2008→2024 swing
- -14.6pp toward R · 2008: 22.4pp · 2024: 7.9pp
- All cycles
- 2024: D+7.9 2020: D+8.7 2016: D+5.6 2012: D+14.5 2008: D+22.4
Not yet ingested
- Civics
- —
Market trends
- HPI YoY
- ▼ -46.21%
- Current HPI
- 223.6438
- Rent YoY
- ▲ 3.10%
- Metro
- St. Louis, MO-IL
- State GDP YoY
- ▲ 1.59%
- F500 in state
- 60
Industry mix (Fortune 500 HQ in IL)
| Industry | F500 HQs | Revenue |
|---|---|---|
| Insurance | 4 | $201B |
|
||
| Consumer Goods | 4 | $87B |
|
||
| Industrial Machinery | 3 | $64B |
|
||
| Healthcare | 2 | $55B |
|
||
| Retail / Pharmacy | 1 | $148B |
|
||
| Agriculture / Food | 1 | $86B |
|
||
Price history
-84.5% since first listed8 events — show timeline
- 2026-05-08 Pending — MARIS as Distributed by MLS Grid
- 2026-04-27 Price Changed $139,900 MARIS as Distributed by MLS Grid
- 2026-04-24 Listed $150,000 MARIS as Distributed by MLS Grid
- 2026-04-22 Coming Soon $150,000 MARIS as Distributed by MLS Grid
- 2014-07-02 Sold (Public Records) $126,000 Public Records
- 2014-06-27 Sold (MLS) — MARIS as Distributed by MLS Grid
- 2014-04-25 Listed $129,900 MARIS as Distributed by MLS Grid
- 2003-04-02 Sold (Public Records) $900,000 Public Records
Property tax history
+7.2%/yrLatest (2024): $3,207 · +10.1% YoY. Source: county tax records.
Cash-flow waterfall
monthlySold comps — $/sqft
last 12 mo · ≤1 miLoading sold comps…