4801 NW 34th St #406 · Lauderdale Lakes, FL
Flood risk No data
- FEMA flood zone
- —
- Chance of flooding over 30 yrs
- —
- Est. flood insurance / yr
- —
Fire risk No data
- Est. fire insurance / yr
- —
Heat risk No data
- Hot days now (above threshold)
- —
- Hot days in 30 yrs
- —
Wind risk No data
- Chance of severe wind over 30 yrs
- —
Air-quality risk No data
- Unhealthy air days now
- —
- Unhealthy air days in 30 yrs
- —
Risk factors via First Street. Map © Google.
Why this score? — see what drove the D grade
The composite is a weighted blend of 9 inputs, each scored 0–100. Each bar is that input's sub-score; the figure is the points it added to the 100-point composite (weight × sub-score).
- Cash flow +10.7/30.0
- 1% rule +8.4/10.0
- ARV discount +7.5/15.0
- Schools +4.1/10.0
- Livability +4.0/5.0
- DSCR +3.1/10.0
- Condition / age +2.5/5.0
- Rent growth +2.2/5.0
- Appreciation +0.0/10.0
$115,000
🖨 Deal sheet (PDF) 📄 Offer letter ✓ Due diligence
Listing remarks
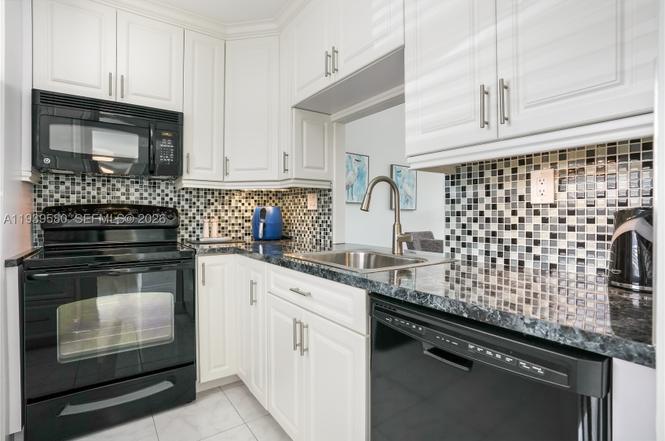
Welcome to 4801 NW 34th Street in Lauderdale Lakes! This well-maintained property offers a fantastic opportunity for homeowners or investors alike. Featuring a functional layout with generous living spaces, this home is filled with natural light and designed for comfortable everyday living. The kitchen provides ample cabinetry and workspace, while the bedroom is generously sized and the bathroom is well kept. Enjoy the outdoor area ideal for relaxing, entertaining, or future improvements. Conveniently located near major roads, shopping, dining, parks, and public transportation, with easy access to Fort Lauderdale and surrounding areas. Making it perfect for personal use or rental potential.
Key facts
- Ample cabinetry
- Outdoor area
- Functional layout
Tags
Property features AI
Finance
- Other: Senior community
- Financial info: Pets not allowed; Annual taxes listed (excluded from feature list per instructions)
- HOA & community: Monthly association fee; Association fee includes amenities, common areas, laundry, grounds maintenance, sewer, trash and water; Community amenities: clubhouse, fitness center, billiard room, library, laundry, elevator(s), storage, picnic area, barbecue, shuffleboard court, pool, trash service
Exterior
- Parking: Assigned parking; Guest parking; One designated space
- Security: Secured lobby
- Utilities: Public water; Sewer included in association; Electric service
- Home design: Condo in a 3-story building; Entry on level 1; Updated/remodeled; Attached to other units
- Construction: Block construction; Resale property
- Exterior features: Patio; Courtyard; Barbecue area; Association pool; Lakefront; Has view
Interior
- Kitchen: Dishwasher; Electric range; Microwave; Refrigerator
- Flooring: Tile
- Bathrooms: 1 full bathroom
- Heating & cooling: Central heating (electric); Central air; Ceiling fans
- Interior features: Furnished; First floor entry; Tile flooring; Lake view
- Laundry & utility: Common area laundry
Neighborhood map
What this means for you Summary
Snapshot
- This is a 1-bed/1.0-bath condo listed at $115k.
Deal economics
- At list price, monthly cash flow is $-54 ($-649/yr) — negative.
- To cash-flow at today's rent, offer at most $105k (8.3% below list).
- Meets the 1% rule at list price ($2k rent vs $115k).
- Recommended offer: $101k (12.0% below list) — sets the bar for market timing.
Location & tenants
- Location reads 81/100 on livability (#100 in FL, #1,527 nationally) — a professional / high-income tenant draw. Strengths: commute A+, cost of living A+, housing A+; Watch: crime D+, amenities F, employment F.
- Broward (suburban): math 42% / reading 53% proficiency, ranked #46 of 73 in FL (top 63%) — families likely to look elsewhere, expect single-tenant / working-renter base with shorter leases.
- Zoned schools: Park Lakes Elementary School (math 35% / reading 44%, grade F, #1,513 of 2,144 statewide, top 73%, 970 students, 82% FRL); Nova Middle School (math 44% / reading 53%, grade C-, #274 of 571 statewide, top 50%, 1,284 students, 68% FRL); Nova High School (math 22% / reading 56%, grade F, #312 of 667 statewide, top 48%, 2,227 students, 59% FRL) — zoned schools average 70% FRL vs 51% district-wide (19 pts higher); higher-poverty schools than district average — tighter screening recommended.
- Market conditions: Rents soft (-1.4%/yr); 827 active listings in the ZIP; 40 comparable units currently listed for rent nearby; rentals at typical pace (median 19d on market — plan ~3-4 weeks tenant-placement turnaround); 2,111 units permitted in Broward County in 2024 (1,265 in 5+ unit buildings).
- This rent runs 32% of the median local income ($58k/yr) — at the standard rent-burdened threshold; future hikes will face affordability resistance.
Forward outlook
- Local home prices are declining (-3.0%/yr); year-one equity from $795 of loan paydown is wiped out by about $3k of value loss. Plan a longer hold.
- Broward County population projected at +34% by 2050 — long-run rental-demand tailwind backs the buy-and-hold thesis.
Negotiation context
- It's been on market 166 days — a 12% lower offer ($101k) is reasonable based on typical stale-listing flexibility.
- 2 sale attempts with the ask held roughly flat each time — persistent listings suggest the price (not the market) is what's stuck; bring a comps-based counter.
- Current owner paid $45k; list at $115k implies a 156% gain — meaningful room to come down on a strong offer.
Risks & watch-outs
- Watch-outs: HOA is 29% of rent.
Questions for the listing agent
- What do current leases actually rent for vs. the listed asking? Can we see a recent rent roll and the last 12 months of T-12 income?
- It's been on market 166 days. Have you received any prior offers? Is the seller open to a 12% concession, seller financing, or rate buy-down credit?
- Built in 1973 — when were the roof, HVAC, electrical panel, plumbing, and water heater last replaced?
- What does the HOA fee cover, when was the last increase, and are there any pending special assessments or reserve-fund shortfalls?
- Any open or pending special assessments — roof, HVAC, plumbing, elevator, façade? What's the per-unit balance and payoff schedule, and is the seller paying it off at close or rolling it to the buyer?
- Why hasn't it sold? Are there any deal-killer items the seller is aware of (foundation, flood, title, zoning, code violations)?
- Is there a deadline driving the sale (1031 exchange, divorce, estate, relocation)? That informs how much negotiation room exists.
- Crime grade is D in this area — have there been break-ins, vandalism, or insurance claims at this property in the last 3 years? What carrier currently insures it and at what premium?
- The area grade is low — what's the realistic commute time and amenity access for the typical tenant pool here? Any planned neighborhood developments (good or bad) we should know about?
- What's the average days-on-market for RENTAL listings here right now (not sales)? A rising rental-DOM trend means longer vacancies and softer asking-rent achievability than the comps imply.
- What's the recent tenant-quality profile in this submarket — average credit score on applications, eviction rate, late-payment / NSF rate, and stable-employment percentage? A property-management company in the area should have these aggregated.
- How much new apartment / multifamily construction is in the pipeline within 1–3 miles? Heavy new supply (>2% of stock underway) typically softens rents 12–24 months out; light construction supports rent growth.
Investment metrics
- 1% rule
- 1.34% ✓
- Cap rate
- 5.73%
- Cash-on-cash
- -2.02%
- DSCR
- 0.91
- GRM
- 6.2
CMA / ARV
No comps found within radius.
Projected returns pro-forma
-3.0% appreciation · 0.0% rent growth · sell at horizon
- IRR
- -25.0%
- Equity multiple
- 0.18×
- Total profit
- $-26,272
- Equity at exit
- $17,147
- IRR
- -49.7%
- Equity multiple
- -0.35×
- Total profit
- $-43,454
- Equity at exit
- $9,943
Cash invested: $32,200 (down + closing). Projections, not guarantees.
Landlord ↔ Tenant lean methodology
- Overall (STATE)
- 87 Strongly Landlord-Friendly
- State Florida
- 87 Strongly Landlord-Friendly · R+3
- County
- — inherits STATE
- City
- — inherits STATE
ZIP-level market 33319
- Rents YoY
- -1.4%
- Active inventory
- 827
- Price-to-rent
- 6.2×
Monthly cashflow live
- Estimated rent
- $1,538 high interval (Pro) →
- Mortgage (P&I)
- −$603
- Tax from tax record
- −$176 /mo · $2,113/yr
- Insurance
- −$48
- HOA
- −$442
- Vacancy / Maint / Mgmt
- −$323
- Net cashflow
- $-54
Break-even live
Sensitivity live
| Price | -10% $11 | -5% $-22 | +0% $-54 | +5% $-87 | +10% $-119 |
|---|---|---|---|---|---|
| Rent | -10% $-176 | -5% $-115 | +0% $-54 | +5% $7 | +10% $67 |
| Rate | -1.0pp $4 | -0.5pp $-25 | base $-54 | +0.5pp $-84 | +1.0pp $-114 |
UW: 25.0% down · 7.5% · 30yr · 1.5% tax · 5.0% vac · 8.0% maint · 8.0% mgmt
Financing live
Cash to close
- Down payment
- $28,750
- Closing costs
- $3,450
- Reserves months
- —
- Total cash needed
- —
Loan-product check · same deal, 3 products live
Conventional
25% down · 7.5% · 30yr
- Down + closing
- —
- Monthly P&I
- —
- Monthly cashflow
- —
- DSCR
- —
- Eligible?
- —
Personal DTI + credit; lowest rate.
DSCR
20% down · 8.5% · 30yr
- Down + closing
- —
- Monthly P&I
- —
- Monthly cashflow
- —
- DSCR
- —
- Eligible?
- —
No personal income docs; deal must DSCR.
Hard money
10% down · 12.0% · 12mo
- Down + closing
- —
- Monthly P&I
- —
- Monthly cashflow
- —
- DSCR
- —
- Eligible?
- —
Short-term bridge; refi at stabilization.
Rent comps 40 comps
| Address | Beds | Baths | Sqft | Rent | $/sqft | DOM | Units | Dist |
|---|---|---|---|---|---|---|---|---|
| 3460 NW 50th Ave Lauderdale Lakes, FL | 1.0–2.0 | 1.0–2.0 | 750 | $1,499 | $2.00 | 18d | 3 | 0.09mi |
| 3301 NW 47th Ter #308 Lauderdale Lakes, FL | 1.0 | 2.0 | 750 | $2,200 | $2.93 | 13d | 1 | 0.13mi |
| 3531 NW 50th Ave #609 Lauderdale Lakes, FL | 1.0 | 1.0 | 684 | $1,350 | $1.97 | 26d | 1 | 0.17mi |
| 3161 NW 47th Ter #111 Lauderdale Lakes, FL | 1.0 | 1.5 | 721 | $1,500 | $2.08 | 26d | 1 | 0.23mi |
| 3161 NW 47th Ter #110 Lauderdale Lakes, FL | 1.0 | 1.5 | 721 | $1,500 | $2.08 | 7d | 1 | 0.23mi |
| 3141 NW 47th Ter Lauderdale Lakes, FL | 1.0–2.0 | 1.5–2.0 | 861 | $1,440 | $1.67 | 26d | 2 | 0.24mi |
| 5031 W Oakland Park Blvd Lauderdale Lakes, FL | 1.0 | 1.0 | 683 | $1,400 | $2.05 | 12d | 2 | 0.28mi |
| 5021 W Oakland Park Blvd Lauderdale Lakes, FL | 1.0 | 1.0 | 684 | $1,550 | $2.27 | 19d | 2 | 0.30mi |
| 2901 NW 47th Ter Unit 348B Lauderdale Lakes, FL | 1.0 | 1.5 | 662 | $1,350 | $2.04 | 26d | 1 | 0.41mi |
| 2901 NW 47th Ter Unit 247B Lauderdale Lakes, FL | 1.0 | 1.5 | 662 | $1,400 | $2.11 | 0d | 1 | 0.41mi |
| 3001 NW 48th Ave #440 Lauderdale Lakes, FL | 1.0 | 1.5 | 705 | $1,300 | $1.84 | 26d | 1 | 0.41mi |
| 3061 NW 47th Ter Unit 327B Lauderdale Lakes, FL | 1.0 | 1.5 | 662 | $1,600 | $2.42 | 9d | 1 | 0.41mi |
| 3061 NW 47th Ter Unit 335B Lauderdale Lakes, FL | 1.0 | 1.5 | 662 | $1,500 | $2.27 | 0d | 1 | 0.41mi |
| 3061 NW 47th Ter Unit 132C Lauderdale Lakes, FL | 1.0 | 1.0 | 610 | $1,500 | $2.46 | 26d | 1 | 0.41mi |
| 3061 NW 47th Ter #327 Lauderdale Lakes, FL | 1.0 | 1.5 | 662 | $1,500 | $2.27 | 26d | 1 | 0.41mi |
| 3030 NW 43rd Ter Lauderdale Lakes, FL | 1.0 | 1.0 | 592 | $1,400 | $2.36 | 3d | 2 | 0.58mi |
| 3030 NW 43rd Ter Lauderdale Lakes, FL | 1.0 | 1.0 | 592 | $1,400 | $2.36 | 0d | 2 | 0.58mi |
| 3030 NW 43rd Ter #102 Lauderdale Lakes, FL | 1.0 | 1.0 | 710 | $1,450 | $2.04 | 26d | 1 | 0.59mi |
| 4851 NW 26th Ct #338 Lauderdale Lakes, FL | 1.0 | 1.0 | 705 | $1,650 | $2.34 | 18d | 1 | 0.61mi |
| 3033 NW 43rd Ave #108 Lauderdale Lakes, FL | 1.0 | 1.0 | 650 | $1,590 | $2.45 | 15d | 1 | 0.61mi |
| 3720 Inverrary Dr Lauderhill, FL | 3.0 | 1.0–2.0 | 940 | $1,600 | $1.70 | 12d | 5 | 0.77mi |
| 4141 NW 26th St #316 Lauderhill, FL | 1.0 | 1.0 | 624 | $1,450 | $2.32 | 26d | 1 | 0.84mi |
| 4121 NW 26th St Unit T16 Lauderhill, FL | 1.0 | 1.5 | 750 | $1,500 | $2.00 | 26d | 1 | 0.86mi |
| 4174 Inverrary Dr #907 Lauderhill, FL | 1.0 | 1.0 | 675 | $1,500 | $2.22 | 26d | 1 | 0.87mi |
| 2800 NW 56th Ave Lauderhill, FL | 1.0–3.0 | 1.0–2.0 | 965 | $1,250 | $1.30 | 0d | 8 | 0.87mi |
| 2800 NW 56th Ave Lauderhill, FL | 1.0–2.0 | 1.0–2.0 | 847 | $1,175 | $1.39 | 26d | 8 | 0.87mi |
| 2800 NW 56th Ave Lauderhill, FL | 1.0–2.0 | 1.0–2.0 | 847 | $1,250 | $1.48 | 23d | 7 | 0.87mi |
| 2800 NW 56th Ave Lauderhill, FL | 1.0–2.0 | 1.0–2.0 | 847 | $1,250 | $1.48 | 6d | 8 | 0.87mi |
| 2800 NW 56th Ave Lauderhill, FL | 1.0–2.0 | 1.0–2.0 | 847 | $1,480 | $1.75 | 17d | 6 | 0.87mi |
| 3760 Inverrary Dr Lauderhill, FL | 2.0 | 1.0–2.0 | 800 | $1,725 | $2.16 | 7d | 3 | 0.94mi |
| 3760 Inverrary Dr Unit 3M Lauderhill, FL | — | 1.0 | 450 | $1,800 | $4.00 | 26d | 1 | 0.96mi |
| 3650 Inverrary Dr Lauderhill, FL | 1.0 | 1.0–1.5 | 610 | $1,570 | $2.57 | 4d | 3 | 1.02mi |
| 3650 Inverrary Dr Lauderhill, FL | 1.0 | 1.0–1.5 | 610 | $1,570 | $2.57 | 15d | 3 | 1.02mi |
| 3670 Inverrary Dr Lauderhill, FL | 1.0 | 1.0–1.5 | 650 | $1,450 | $2.23 | 16d | 2 | 1.07mi |
| 3670 Inverrary Dr Lauderhill, FL | 1.0 | 1.0–1.5 | 650 | $1,600 | $2.46 | 9d | 3 | 1.07mi |
| 3680 Inverrary Dr Unit 2M Lauderhill, FL | — | 1.0 | 420 | $1,300 | $3.10 | 26d | 1 | 1.10mi |
| 5321 NW 21st Ct Lauderhill, FL | 2.0 | 1.0 | 750 | $1,900 | $2.53 | 26d | 1 | 1.13mi |
| 3660 Inverrary Dr Lauderhill, FL | 1.0 | 1.0–1.5 | 725 | $1,799 | $2.48 | 9d | 3 | 1.14mi |
| 3660 Inverrary Dr Lauderhill, FL | 1.0 | 1.0–1.5 | 725 | $1,799 | $2.48 | 19d | 2 | 1.14mi |
| 2360 NW 56th Ave Lauderhill, FL | 1.0–3.0 | 1.0–2.0 | 924 | $1,585 | $1.72 | 0d | 20 | 1.14mi |
HOA detail condo
- Monthly dues
- $442 · $5,304/yr
- Assessments
- None detected in remarks — confirm with the listing agent.
Listing history 19 events
-
2026-06-21days on market $115,000 Active 166 DOM
-
2026-06-18days on market $115,000 Active 163 DOM
-
2026-06-17days on market $115,000 Active 162 DOM
-
2026-06-16days on market $115,000 Active 161 DOM
-
2026-06-15days on market $115,000 Active 160 DOM
-
2026-06-13days on market $115,000 Active 158 DOM
-
2026-06-09days on market $115,000 Active 154 DOM
-
2026-06-07days on market $115,000 Active 152 DOM
-
2026-06-04days on market $115,000 Active 149 DOM
-
2026-06-03days on market $115,000 Active 148 DOM
-
2026-06-02days on market $115,000 Active 147 DOM
-
2026-06-01days on market $115,000 Active 146 DOM
-
2026-05-31days on market $115,000 Active 145 DOM
-
2026-01-06$115,000 Active
-
2025-07-06historical
-
2025-03-16price $117,900
-
2025-01-06$127,900 Active
-
2012-10-05soldstatus $45,000
-
2002-04-19soldstatus $18,500
ⓘ Source: listings_history table (triggers on properties + properties_extension) + one-shot
backfill from property_details.listing_events for pre-trigger history.
Tax reassessment forecast FL · Resets to sale price
- Current annual tax
- $2,113 · $176/mo
- Projected year-2 tax
- $2,113 · $176/mo
- Expected delta
- $0/yr ($0/mo · 0.0%)
ⓘ Screening estimate from a state-policy table — verify with the county assessor before closing.
Nearby sold comps map
Loading sold comps map…
Walkable amenities ~0.75 mi
Loading nearby amenities…
Taxation est. · year 1
- Rental income
- $18,456
- − Mortgage interest
- −$6,442
- − Property taxes
- −$2,113
- − Insurance
- −$575
- − Repairs & maintenance
- −$1,476
- − Management
- −$1,476
- − HOA
- −$5,304
- − Depreciation
- −$3,345
- Taxable loss
- −$2,277
- Est. tax savings @ 24.0%
- +$546
- After-tax cash flow
- $-103/yr
For passive investors: Depreciation is non-cash, so a rental often shows a tax loss while cash-flowing — sheltering income. Rental losses are passive: they offset passive income freely, and up to $25,000/yr can offset ordinary (W-2) income if you actively participate and your MAGI is under $100k (phasing out to $0 by $150k); unused losses carry forward. On sale, claimed depreciation is recaptured at up to 25%, and gains may owe capital-gains tax (a 1031 exchange can defer both). Figures are a year-1 estimate at your 24.0% rate — not tax advice; consult a CPA.
Schools (NCES district)
- District
- Broward
- NCES district ID
- 1200180
- Math proficiency
- 42% ▼ -18.00%
- Reading proficiency
- 53% ▼ -5.00%
- Median HH income
- $52,139
- Composite
- 40.88/100
- National rank
- #3621
- State rank
- #46 of 73 in FL
Livability — Lauderdale Lakes
- Score
- 81/100
- State rank
- #100
- US rank
- #1527
Category grades
Schools grade is shown separately in the Schools card above.
Census & demographics
- Census place
- Lauderdale Lakes, FL
- County
- Broward County · 1,963,430 people
- Metro
- Miami-Fort Lauderdale-Pompano Beach, FL
- Population (ZIP)
- 54,450
- Household income
- $58,388
- Rent vs Own
- Severe rent burden
- 2809.0
Population outlook (Broward County) Hauer SSP2
- Today (2025)
- 2,207,033 people
- By 2030
- 2,360,704 · +7.0%
- By 2040
- 2,661,208 · +20.6%
- By 2050
- 2,946,698 · +33.5%
- By 2075
- 3,602,273 · +63.2%
- By 2100
- 3,970,984 · +79.9%
Race, ethnicity, and origin ACS 2023
- Neighborhood character
- Diverse neighborhood (Simpson 0.58)
- Race & ethnicity
- Black 61% Hispanic / Latino 17% White 15% Two or more races 11% Asian 4%
- Hispanic origin (detail)
- Puerto Rican 4% Cuban 2% Dominican 1%
- Common ancestry
- Hispanic 13% Romanian 1% Italian 1%
- Foreign-born
- 46% · Canada, Jamaica, Vietnam
- Languages at home
- 64% English-only · Spanish 15% French/Haitian/Cajun 15% Other Indo-European 2%
Political lean MEDSL · Broward
- 2024 margin
- D (+17.0) · D 58.0% · R 41.0%
- 2008→2024 swing
- -17.8pp toward R · 2008: 34.7pp · 2024: 17.0pp
- All cycles
- 2024: D+17.0 2020: D+29.8 2016: D+35.0 2012: D+34.9 2008: D+34.7
Not yet ingested
- Civics
- —
Market trends
- HPI YoY
- ▼ -202.84%
- Current HPI
- 328.4307
- Rent YoY
- ▼ -1.38%
- Metro
- Miami-Fort Lauderdale-Pompano Beach, FL
- State GDP YoY
- ▲ 3.28%
- F500 in state
- 36
Industry mix (Fortune 500 HQ in FL)
| Industry | F500 HQs | Revenue |
|---|---|---|
| Industrial Technology | 2 | $29B |
|
||
| Insurance | 2 | $17B |
|
||
| Retail | 1 | $60B |
|
||
| Technology Distribution | 1 | $58B |
|
||
| Homebuilding | 1 | $35B |
|
||
| Technology Manufacturing | 1 | $35B |
|
||
Price history
+521.6% since first listed6 events — show timeline
- 2026-01-06 Listed $115,000 MARMLS
- 2025-07-06 Listing Removed — MARMLS
- 2025-03-16 Price Changed $117,900 MARMLS
- 2025-01-06 Listed $127,900 MARMLS
- 2012-10-05 Sold (Public Records) $45,000 Public Records
- 2002-04-19 Sold (Public Records) $18,500 Public Records
Property tax history
+5.9%/yrLatest (2025): $2,113 · +8.5% YoY. Source: county tax records.
Cash-flow waterfall
monthlySold comps — $/sqft
last 12 mo · ≤1 miLoading sold comps…