4361 1st Ct · Atlantis, FL
Flood risk 1/10 · Minimal
- FEMA flood zone
- X (unshaded)
- Chance of flooding over 30 yrs
- 0.0%
- Est. flood insurance / yr
- $507 – $1,088
Fire risk 1/10 · Minimal
- Est. fire insurance / yr
- $947 – $1,759
Heat risk 10/10 · Severe
- Hot days now (above 105°F)
- 7 days/yr
- Hot days in 30 yrs
- 27 days/yr
Wind risk 10/10 · Severe
- Chance of severe wind over 30 yrs
- 99.0%
Air-quality risk 2/10 · Minimal
- Unhealthy air days now
- 0 days/yr
- Unhealthy air days in 30 yrs
- 2 days/yr
Risk factors via First Street. Map © Google.
Why this score? — see what drove the B grade
The composite is a weighted blend of 9 inputs, each scored 0–100. Each bar is that input's sub-score; the figure is the points it added to the 100-point composite (weight × sub-score).
- Cash flow +30.0/30.0
- 1% rule +10.0/10.0
- DSCR +10.0/10.0
- ARV discount +7.5/15.0
- Schools +4.3/10.0
- Livability +3.6/5.0
- Rent growth +3.5/5.0
- Condition / age +2.2/5.0
- Appreciation +0.0/10.0
$115,000
🖨 Deal sheet 📄 Offer letter ✓ Due diligence
Listing remarks
Just Listed !!! This home has a New Roof 2023, it has been beautifully upgraded with new kitchen and bathrooms. The kitchen has new cabinets, new stainless appliances, new granite countertops, also room for a casual dining table. The master bedroom is large and has its own bathroom with a large jacuzzi tub , separate shower and granite counters. Bedrooms 2 & 3 are split away from the master . Open floor plan as you enter the home with high ceilings and lots of windows. New ceiling fans in the bedrooms and great room. There is a large backyard with a screened room with jacuzzi, paver patio , extra large storage room with shelves. Located at the end of the street , driveway parking for
Key facts
- New kitchen
- New cabinets
- New bathrooms
Tags
Neighborhood map
What this means for you Summary
Snapshot
- This is a 3-bed/2.0-bath manufactured listed at $115k. Condition is rated fair.
Deal economics
- At list price, monthly cash flow is $1k ($17k/yr) — positive.
- The deal already cash-flows at list — no discount required.
- Meets the 1% rule at list price ($3k rent vs $115k).
Location & tenants
- Location reads 71/100 on livability (#390 in FL) — a middle-class / working-renter tenant base. Strengths: crime A+, employment A+, housing A+; Watch: amenities F, commute F, cost of living F.
- Palm Beach (suburban): math 46% / reading 53% proficiency, ranked #34 of 73 in FL (top 47%) — families likely to look elsewhere, expect single-tenant / working-renter base with shorter leases.
- Market conditions: Rents rising fast (+4.1%/yr); 383 active listings in the ZIP; 40 comparable units currently listed for rent nearby; rentals at typical pace (median 22d on market — plan ~3-4 weeks tenant-placement turnaround); 3,974 units permitted in Palm Beach County in 2024 (1,012 in 5+ unit buildings).
- At $2,841/mo this rent would consume 46% of the median local household income ($74k/yr) (locally 1852% of renters already pay >50% of income on rent) — very limited rent-growth headroom before tenants either downsize or default.
Forward outlook
- Local home prices are declining (-3.0%/yr); year-one equity from $795 of loan paydown is wiped out by about $3k of value loss. Plan a longer hold.
- Palm Beach County population projected at +30% by 2050 — long-run rental-demand tailwind backs the buy-and-hold thesis.
- At projected returns (-3.0% appreciation + 4.1% rent growth), your $32k cash investment doubles in ~3 years — after that, you're playing with house money.
Negotiation context
- Only 4 days on market — expect competitive offers; lowballing is unlikely to land.
- 5 sale attempts since 3y ago with the ask held roughly flat each time — persistent listings suggest the price (not the market) is what's stuck; bring a comps-based counter.
Risks & watch-outs
- Climate carrying-cost: severe wind risk, 99% chance of damaging wind over 30y; extreme-heat days projected 7→27/yr by 2055 (HVAC capex compounding) — expect insurance premiums to compound above CPI over the hold.
Questions for the listing agent
- Have any recent inspections been done? Can we get a copy of the seller's disclosures and any deferred-maintenance estimates?
- What does the HOA fee cover, when was the last increase, and are there any pending special assessments or reserve-fund shortfalls?
- Is there a deadline driving the sale (1031 exchange, divorce, estate, relocation)? That informs how much negotiation room exists.
- What's the average days-on-market for RENTAL listings here right now (not sales)? A rising rental-DOM trend means longer vacancies and softer asking-rent achievability than the comps imply.
- What's the recent tenant-quality profile in this submarket — average credit score on applications, eviction rate, late-payment / NSF rate, and stable-employment percentage? A property-management company in the area should have these aggregated.
- How much new for-sale + rental construction is in the pipeline within 1–3 miles? Heavy new supply typically softens prices + rents 12–24 months out; constrained supply supports both.
Investment metrics
- 1% rule
- 2.47% ✓
- Cap rate
- 20.90%
- Cash-on-cash
- 52.16%
- DSCR
- 3.32
- GRM
- 3.4
CMA / ARV
No comps found within radius.
Projected returns pro-forma
-3.0% appreciation · 4.09% rent growth · sell at horizon
- IRR
- 51.4%
- Equity multiple
- 3.29×
- Total profit
- $73,735
- Equity at exit
- $17,147
- IRR
- 57.2%
- Equity multiple
- 6.98×
- Total profit
- $192,511
- Equity at exit
- $9,943
Cash invested: $32,200 (down + closing). Projections, not guarantees.
Landlord ↔ Tenant lean methodology
- Overall (STATE)
- 87 Strongly Landlord-Friendly
- State Florida
- 87 Strongly Landlord-Friendly · R+3
- County
- — inherits STATE
- City
- — inherits STATE
ZIP-level market 33462
- Rents YoY
- 4.1%
- Active inventory
- 383
- Price-to-rent
- 3.4×
Monthly cashflow live
- Estimated rent
- $2,841 high interval (Pro) →
- Mortgage (P&I)
- −$603
- Tax est. 1.5%
- −$144 /mo · $1,725/yr
- Insurance
- −$48
- HOA
- −$50
- Vacancy / Maint / Mgmt
- −$597
- Net cashflow
- $1,400
Break-even live
UW: 25.0% down · 7.5% · 30yr · 1.5% tax · 5.0% vac · 8.0% maint · 8.0% mgmt
Financing live
Cash to close
- Down payment
- $28,750
- Closing costs
- $3,450
- Reserves months
- —
- Total cash needed
- —
Loan-product check · same deal, 3 products live
Conventional
25% down · 7.5% · 30yr
- Down + closing
- —
- Monthly P&I
- —
- Monthly cashflow
- —
- DSCR
- —
- Eligible?
- —
Personal DTI + credit; lowest rate.
DSCR
20% down · 8.5% · 30yr
- Down + closing
- —
- Monthly P&I
- —
- Monthly cashflow
- —
- DSCR
- —
- Eligible?
- —
No personal income docs; deal must DSCR.
Hard money
10% down · 12.0% · 12mo
- Down + closing
- —
- Monthly P&I
- —
- Monthly cashflow
- —
- DSCR
- —
- Eligible?
- —
Short-term bridge; refi at stabilization.
Rent comps 40 comps
| Address | Beds | Baths | Sqft | Rent | $/sqft | DOM | Units | Dist |
|---|---|---|---|---|---|---|---|---|
| 6040 Lace Wood Cir Lake Worth, FL | 3.0 | 2.0 | 1326 | $2,799 | $2.11 | 24d | 1 | 0.10mi |
| 493 Forestview Dr Lake Worth, FL | 3.0 | 2.0 | 1701 | $2,300 | $1.35 | 5d | 1 | 0.22mi |
| 4648 Silver Saw Ln Lake Worth, FL | 3.0 | 2.5 | 1718 | $3,300 | $1.92 | 11d | 1 | 0.35mi |
| 423 Pine Tree Ct #23 Lake Worth, FL | 2.0 | 2.0 | 1222 | $2,300 | $1.88 | 22d | 1 | 0.47mi |
| 3883 Island Club Cir W Lake Worth, FL | 3.0 | 2.5 | 1308 | $2,400 | $1.83 | 17d | 1 | 0.47mi |
| 6411 Birch Ln Lake Worth, FL | 3.0 | 2.0 | 1200 | $1,800 | $1.50 | 24d | 1 | 0.52mi |
| 4735 Blue Pine Cir Lake Worth, FL | 3.0 | 2.0 | 1732 | $3,500 | $2.02 | 24d | 1 | 0.53mi |
| 4983 Pinemore Ln Unit 4983 Greenacres, FL | 3.0 | 2.5 | 1628 | $2,900 | $1.78 | 24d | 1 | 0.59mi |
| 4657 Meyerson Pl Lake Worth, FL | 3.0 | 2.5 | 1635 | $2,900 | $1.77 | 20d | 1 | 0.78mi |
| 4657 Meyerson Pl Lake Worth, FL | 3.0 | 2.5 | 1635 | $2,900 | $1.77 | 24d | 1 | 0.78mi |
| 5056 Lantana Rd #4302 Lake Worth, FL | 2.0 | 2.0 | 979 | $2,295 | $2.34 | 7d | 1 | 0.84mi |
| 4350 Peregrine Way Lake Worth, FL | 1.0–3.0 | 1.0–2.0 | 1025 | $3,119 | $3.04 | 2d | 18 | 0.87mi |
| 5048 Lantana Rd #5112 Lake Worth, FL | 3.0 | 2.0 | 1115 | $2,200 | $1.97 | 7d | 1 | 0.90mi |
| 5064 Lantana Rd #6203 Lake Worth, FL | 2.0 | 2.0 | 929 | $2,100 | $2.26 | 24d | 1 | 0.90mi |
| 4616 Hollister Ave Unit 4616 Greenacres, FL | 3.0 | 2.5 | 1628 | $3,100 | $1.90 | 24d | 1 | 0.92mi |
| 4091 Plumbago Pl Lake Worth, FL | 3.0 | 2.0 | 1816 | $1,300 | $0.72 | 24d | 1 | 1.01mi |
| 6909 Blue Skies Dr Lake Worth, FL | 2.0 | 2.5 | 1293 | $2,600 | $2.01 | 24d | 1 | 1.03mi |
| 4951 Mallory St Unit 4951 Greenacres, FL | 3.0 | 2.5 | 1309 | $2,700 | $2.06 | 22d | 1 | 1.06mi |
| 4947 Grinnell St Lake Worth, FL | 3.0 | 2.5 | 1309 | $2,850 | $2.18 | 24d | 1 | 1.13mi |
| 7132 Colony Club Dr Lake Worth, FL | 1.0–3.0 | 1.0–2.0 | 1087 | $2,884 | $2.65 | 2d | 14 | 1.18mi |
| 4725 Via Bari Lake Worth, FL | 1.0–3.0 | 1.0–2.0 | 1150 | $2,829 | $2.46 | 3d | 10 | 1.22mi |
| 5005 Northern Lights Dr Unit 5005 Greenacres, FL | 3.0 | 2.5 | 1616 | $3,200 | $1.98 | 24d | 1 | 1.25mi |
| 300 John F Kennedy Dr #8 Lake Worth, FL | 3.0 | 2.0 | 1711 | $3,200 | $1.87 | 2d | 1 | 1.33mi |
| 300 John F Kennedy Dr #208 Lake Worth, FL | 3.0 | 2.0 | 1548 | $4,800 | $3.10 | 24d | 1 | 1.33mi |
| 300 John F Kennedy Dr #8 Lake Worth, FL | 3.0 | 2.0 | 1711 | $3,100 | $1.81 | 3d | 1 | 1.33mi |
| 300 John F Kennedy Dr #101 Lake Worth, FL | 3.0 | 2.0 | 1711 | $3,500 | $2.05 | 22d | 1 | 1.33mi |
| 3327 Sapphire Rd Lake Worth, FL | 4.0 | 3.0 | 1377 | $3,400 | $2.47 | 11d | 1 | 1.35mi |
| 3327 Sapphire Rd Lake Worth, FL | 4.0 | 3.0 | 1377 | $3,350 | $2.43 | 2d | 1 | 1.35mi |
| 5864 Strawberry Lakes Cir Lake Worth, FL | 3.0 | 2.0 | 1087 | $2,825 | $2.60 | 5d | 1 | 1.36mi |
| 7093 Middlebury Dr Unit 7093 Boynton Beach, FL | 4.0 | 2.0 | 1470 | $3,000 | $2.04 | 24d | 1 | 1.36mi |
| 4863 Gulfstream Rd Lake Worth Beach, FL | 3.0 | 1.0 | 1050 | $2,200 | $2.10 | 24d | 1 | 1.36mi |
| 250 John F Kennedy Dr #308 Lake Worth, FL | 3.0 | 2.0 | 1734 | $2,300 | $1.33 | 19d | 1 | 1.37mi |
| 250 John F Kennedy Dr #408 Lake Worth, FL | 3.0 | 2.0 | 1734 | $2,700 | $1.56 | 24d | 1 | 1.37mi |
| 3884 Melaleuca Ln Lake Worth, FL | 3.0 | 3.0 | 1407 | $2,750 | $1.95 | 7d | 1 | 1.38mi |
| 5012 Starblaze Dr Greenacres, FL | 3.0 | 2.5 | 1616 | $2,900 | $1.79 | 24d | 1 | 1.38mi |
| 5584 Priscilla Ln Lake Worth, FL | 4.0 | 2.0 | 1453 | $3,050 | $2.10 | 17d | 1 | 1.39mi |
| 7398 Willow Springs Cir E Boynton Beach, FL | 3.0 | 2.0 | 1390 | $2,861 | $2.06 | 5d | 1 | 1.40mi |
| 4302 Colony View Dr Unit 4302 Greenacres, FL | 3.0 | 2.5 | 1851 | $3,000 | $1.62 | 20d | 1 | 1.41mi |
| 3920 Melaleuca Ln Unit 303 Lake Worth Beach, FL | 3.0 | 3.0 | 1407 | $2,695 | $1.92 | 24d | 1 | 1.41mi |
| 4616 Villas Santorini Dr Unit 4653 Lake Worth Beach, FL | 3.0 | 2.0 | 1200 | $2,450 | $2.04 | 24d | 1 | 1.43mi |
HOA detail
- Monthly dues
- $50 · $600/yr
Listing history 10 events
-
2026-06-18days on market $115,000 Active 4 DOM
-
2026-06-17days on market $115,000 Active 3 DOM
-
2026-06-16days on market $115,000 Active 2 DOM
-
2026-06-15remarks 695-char remark
-
2026-06-15days on market $115,000 Active 1 DOM
-
2026-06-13days on market $115,000 Active 10 DOM
-
2026-06-09days on market $115,000 Active 6 DOM
-
2026-06-07days on market $115,000 Active 4 DOM
-
2026-06-04remarks 285-char remark
-
2026-06-04$115,000 Active 1 DOM
ⓘ Source: listings_history table (triggers on properties + properties_extension) + one-shot
backfill from property_details.listing_events for pre-trigger history.
Climate risk First Street
- Flood 1/10 Low FEMA zone X (unshaded) · 0% chance over 30 yrs
- Wildfire 1/10 Low
- Heat 10/10 Extreme 7 d/yr ≥105°F today · 27 d/yr by 30 yrs out
- Wind 10/10 Extreme 99% chance of damaging wind over 30 yrs
- Air quality 2/10 Low 0 unhealthy d/yr today · 2 by 30 yrs out
Nearby sold comps map
Loading sold comps map…
Walkable amenities ~0.75 mi
Loading nearby amenities…
Taxation est. · year 1
- Rental income
- $34,093
- − Mortgage interest
- −$6,442
- − Property taxes
- −$1,725
- − Insurance
- −$575
- − Repairs & maintenance
- −$2,727
- − Management
- −$2,727
- − HOA
- −$600
- − Depreciation
- −$3,345
- Taxable income
- $15,951
- Est. tax owed @ 24.0%
- −$3,828
- After-tax cash flow
- $12,968/yr
For passive investors: Depreciation is non-cash, so a rental often shows a tax loss while cash-flowing — sheltering income. Rental losses are passive: they offset passive income freely, and up to $25,000/yr can offset ordinary (W-2) income if you actively participate and your MAGI is under $100k (phasing out to $0 by $150k); unused losses carry forward. On sale, claimed depreciation is recaptured at up to 25%, and gains may owe capital-gains tax (a 1031 exchange can defer both). Figures are a year-1 estimate at your 24.0% rate — not tax advice; consult a CPA.
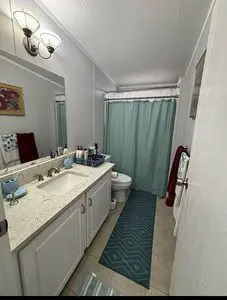
Condition & rehab AI · 1 photo
This manufactured home has fair condition with minor repairs needed in the bathroom and some maintenance required. Painting and updating the flooring can significantly improve its value.
Repairs flagged
- Minor bathroom flooring — Carpeted floor in bathroom
- Minor bathroom shower curtain — Worn shower curtain
Value-add opportunities
- Both Paint walls — Fresh paint can improve curb appeal and interior aesthetics
- Both Replace bathroom flooring — New flooring can enhance the bathroom's appearance and functionality
Renovation cost estimate screening
| Repair item | Severity | Est. cost |
|---|---|---|
| bathroom flooring · Carpeted floor in bathroom | Minor | $500–3,000 |
| bathroom shower curtain · Worn shower curtain | Minor | $500–3,000 |
| Total estimated repair cost · 2 items | $1,000–6,000 |
Value-add ROI direction
- Both Paint walls — Fresh paint can improve curb appeal and interior aesthetics ↑
- Both Replace bathroom flooring — New flooring can enhance the bathroom's appearance and functionality ↑
ⓘ Cost ranges are severity-bucket heuristics (US national rule-of-thumb). Get contractor quotes + a written scope before underwriting a rehab budget.
Schools (NCES district)
- District
- Palm Beach
- NCES district ID
- 1201500
- Math proficiency
- 46% ▼ -16.00%
- Reading proficiency
- 53% ▼ -4.00%
- Median HH income
- $53,943
- Composite
- 42.72/100
- National rank
- #3160
- State rank
- #34 of 73 in FL
Livability — Atlantis
- Score
- 71/100
- State rank
- #390
- US rank
- #6861
Category grades
Schools grade is shown separately in the Schools card above.
Census & demographics
- County
- Palm Beach County · 1,438,312 people
- Metro
- Miami-Fort Lauderdale-Pompano Beach, FL
- Population (ZIP)
- 33,371
- Household income
- $73,997
- Rent vs Own
- Severe rent burden
- 1852.0
Population outlook (Palm Beach County) Hauer SSP2
- Today (2025)
- 1,637,487 people
- By 2030
- 1,743,255 · +6.5%
- By 2040
- 1,948,712 · +19.0%
- By 2050
- 2,132,979 · +30.3%
- By 2075
- 2,530,027 · +54.5%
- By 2100
- 2,706,979 · +65.3%
Race, ethnicity, and origin ACS 2023
- Neighborhood character
- Diverse neighborhood (Simpson 0.68)
- Race & ethnicity
- White 44% Black 26% Hispanic / Latino 26% Two or more races 11% Asian 2%
- Hispanic origin (detail)
- Mexican 8% Puerto Rican 5% Cuban 3%
- Common ancestry
- Hispanic 14% Romanian 2% Scotch-Irish 2%
- Foreign-born
- 31% · Canada, Jamaica, Dominican Republic
- Languages at home
- 60% English-only · Spanish 20% French/Haitian/Cajun 16% Other Indo-European 1%
Political lean MEDSL · Palm Beach
- 2024 margin
- Toss-up / Even · D 50.0% · R 49.2%
- 2008→2024 swing
- -22.1pp toward R · 2008: 22.9pp · 2024: 0.8pp
- All cycles
- 2024: D+0.8 2020: D+12.8 2016: D+15.3 2012: D+17.0 2008: D+22.9
Not yet ingested
- Civics
- —
Market trends
- HPI YoY
- ▼ -295.48%
- Current HPI
- 361.5391
- Rent YoY
- ▲ 4.09%
- Metro
- Miami-Fort Lauderdale-Pompano Beach, FL
- State GDP YoY
- ▲ 3.28%
- F500 in state
- 36
Industry mix (Fortune 500 HQ in FL)
| Industry | F500 HQs | Revenue |
|---|---|---|
| Industrial Technology | 2 | $29B |
|
||
| Insurance | 2 | $17B |
|
||
| Retail | 1 | $60B |
|
||
| Technology Distribution | 1 | $58B |
|
||
| Homebuilding | 1 | $35B |
|
||
| Technology Manufacturing | 1 | $35B |
|
||
Price history
-2.5% since first listed16 events — show timeline
- 2026-06-04 Listed $115,000 FSBO.com
- 2026-04-30 Listing Removed — Beaches MLS
- 2026-01-28 Price Changed $123,000 Beaches MLS
- 2026-01-07 Price Changed $130,000 Beaches MLS
- 2025-11-03 Price Changed $132,000 Beaches MLS
- 2025-11-03 Listed $130,000 Beaches MLS
- 2025-09-01 Listing Removed — Beaches MLS
- 2025-05-28 Price Changed $149,000 Beaches MLS
- 2025-03-31 Price Changed $159,000 Beaches MLS
- 2025-03-31 Price Changed $169,000 Beaches MLS
- 2025-02-24 Listed $179,000 Beaches MLS
- 2024-01-29 Sold (MLS) $114,000 MCRTC
- 2024-01-22 Pending — MCRTC
- 2024-01-10 Relisted — MCRTC
- 2023-11-28 Pending — MCRTC
- 2023-11-03 Listed $117,900 MCRTC
Cash-flow waterfall
monthlySold comps — $/sqft
last 12 mo · ≤1 miLoading sold comps…