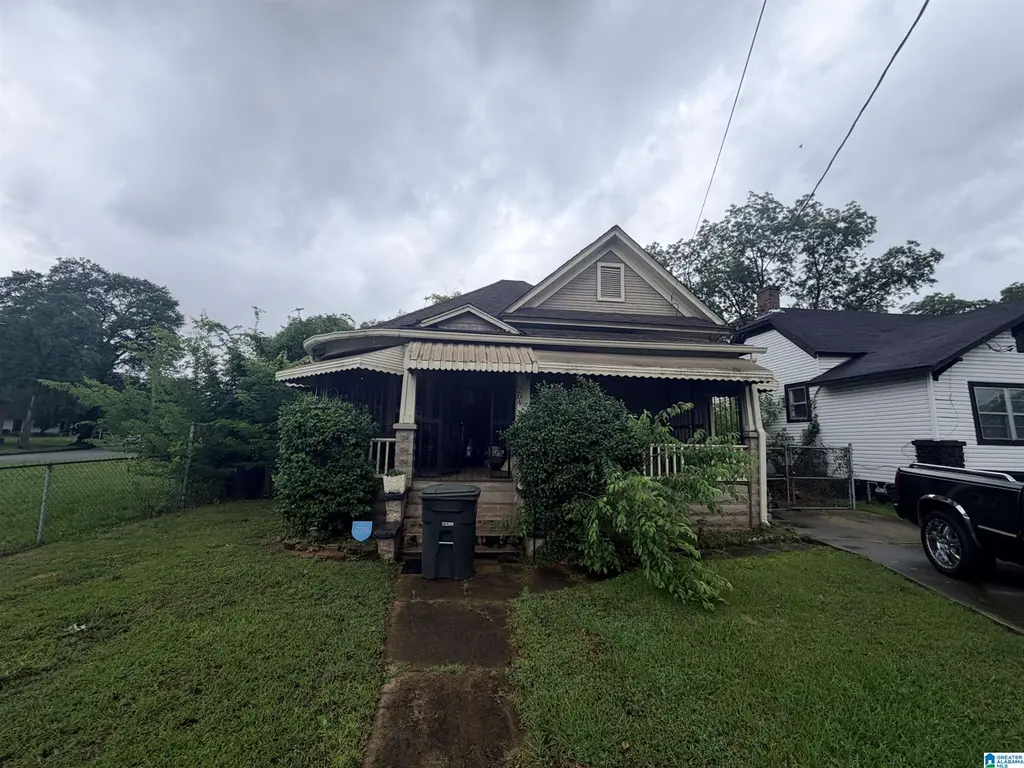
204 52nd St N · Birmingham, AL
Flood risk 1/10 · Minimal
- FEMA flood zone
- X (unshaded)
- Chance of flooding over 30 yrs
- 0.0%
- Est. flood insurance / yr
- $507 – $1,088
Fire risk 1/10 · Minimal
- Est. fire insurance / yr
- $916 – $1,700
Heat risk 6/10 · Moderate
- Hot days now (above 106°F)
- 7 days/yr
- Hot days in 30 yrs
- 19 days/yr
Wind risk 6/10 · Moderate
- Chance of severe wind over 30 yrs
- 27.0%
Air-quality risk 4/10 · Minor
- Unhealthy air days now
- 6 days/yr
- Unhealthy air days in 30 yrs
- 8 days/yr
Risk factors via First Street. Map © Google.
Why this score? — see what drove the B- grade
The composite is a weighted blend of 9 inputs, each scored 0–100. Each bar is that input's sub-score; the figure is the points it added to the 100-point composite (weight × sub-score).
- Cash flow +30.0/30.0
- DSCR +10.0/10.0
- 1% rule +9.7/10.0
- ARV discount +7.5/15.0
- Livability +3.4/5.0
- Rent growth +2.5/5.0
- Condition / age +2.5/5.0
- Schools +0.9/10.0
- Appreciation +0.0/10.0
$94,999
🖨 Deal sheet 📄 Offer letter ✓ Due diligence
Listing remarks
Charming bungalow in Birmingham's Woodlawn neighborhood! This 2BR/1BA home features beautiful hardwood floors, a spacious kitchen with plenty of cabinet space, a stunning tiled bathroom with soaking tub, and a welcoming covered front porch. Property is being sold as-is but shows well and has tremendous potential. Buyer to verify all information including square footage, schools, and room dimensions. Contact the listing agent for access.
Key facts
- Covered front porch
- Soaking tub
- Spacious kitchen
Tags
Property features AI
Finance
- Other: Lot size approximately 0.23 acres; Subdivision: WHITLE J J
Exterior
- Parking: Driveway parking; On-street parking
- Utilities: Public water; Connected sewer; Underground utilities; Gas water heater
- Home design: Existing construction; Single-story rooms (main level layout); Siding - wood exterior
- Construction: Crawl space foundation; Wood siding construction
- Exterior features: No pool, patio, decks, or garden/patio indicated; Not waterfront
Interior
- Kitchen: Laminate countertops; Gas cooktop
- Bedrooms: Bedrooms located on main level
- Flooring: Hardwood
- Bathrooms: One full bathroom with tub/shower combo
- Heating & cooling: Space heaters; Window air conditioning units
- Interior features: 9 ft. + ceilings; Hardwood floors; No special interior features noted
- Laundry & utility: Main-level laundry room; Washer hookup; Gas dryer hookup
Neighborhood map
What this means for you Summary
Snapshot
- This is a 3-bed/1.0-bath single-family listed at $95k.
Deal economics
- At list price, monthly cash flow is $521 ($6k/yr) — positive.
- The deal already cash-flows at list — no discount required.
- Meets the 1% rule at list price ($1k rent vs $95k).
- Recommended offer: $94k (1.5% below list) — sets the bar for market timing.
- Cap rate 12.9% vs local median 6.2% in Birmingham — top-decile yield for the area; either an underpriced asset or a hidden risk that comps aren't pricing in. Stress-test before assuming the spread holds.
Location & tenants
- Location reads 67/100 on livability (#78 in AL) — a middle-class / working-renter tenant base. Strengths: commute A+, cost of living A+, housing A+; Watch: amenities C-, crime F, employment F.
- Birmingham City (urban): math 4% / reading 20% proficiency, ranked #116 of 129 in AL (top 90%) — low school quality limits family demand, transient renter base, plan for 1-2y turnover; 82% free/reduced lunch — lower-income household profile, screen leases tightly.
- Zoned schools: Oliver K5 School (math 37% / reading 37%, grade F, #267 of 627 statewide, top 45%, 389 students, 87% FRL); Woodlawn High Schoolmagnet (math 2% / reading 2%, grade F, #291 of 305 statewide, top 100%, 738 students, 91% FRL).
- Market conditions: 81 active listings in the ZIP; 32 comparable units currently listed for rent nearby; rentals at typical pace (median 24d on market — plan ~3-4 weeks tenant-placement turnaround); lower-income renter base — watch delinquency; 2,114 units permitted in Jefferson County in 2024 (556 in 5+ unit buildings).
- At $1,400/mo this rent would consume 46% of the median local household income ($37k/yr) (locally 798% of renters already pay >50% of income on rent) — very limited rent-growth headroom before tenants either downsize or default.
Forward outlook
- Local home prices are declining (-3.0%/yr); year-one equity from $657 of loan paydown is wiped out by about $3k of value loss. Plan a longer hold.
- Jefferson County population projected to shrink 4% by 2050 — rents likely to lag national; underwrite the cash flow, not the appreciation.
- At projected returns (-3.0% appreciation + 3.0% rent growth), your $27k cash investment doubles in ~6 years — after that, you're playing with house money.
Negotiation context
- It's been on market 27 days — a 2% lower offer ($94k) is reasonable based on typical stale-listing flexibility.
- Current owner paid $18k; list at $95k implies a 414% gain — meaningful room to come down on a strong offer.
Risks & watch-outs
- Watch-outs: built in 1928 — expect roof / HVAC / electrical / plumbing capex.
- Climate carrying-cost: major wind risk, 27% chance of damaging wind over 30y; extreme-heat days projected 7→19/yr by 2055 (HVAC capex compounding) — expect insurance premiums to compound above CPI over the hold.
Questions for the listing agent
- Built in 1928 — when were the roof, HVAC, electrical panel, plumbing, and water heater last replaced?
- Is there a deadline driving the sale (1031 exchange, divorce, estate, relocation)? That informs how much negotiation room exists.
- Schools are F-rated, which usually means shorter tenancies and higher turnover. Who's the typical renter profile here, and what's been the actual vacancy rate?
- Crime grade is F in this area — have there been break-ins, vandalism, or insurance claims at this property in the last 3 years? What carrier currently insures it and at what premium?
- What's the average days-on-market for RENTAL listings here right now (not sales)? A rising rental-DOM trend means longer vacancies and softer asking-rent achievability than the comps imply.
- What's the recent tenant-quality profile in this submarket — average credit score on applications, eviction rate, late-payment / NSF rate, and stable-employment percentage? A property-management company in the area should have these aggregated.
- How much new for-sale + rental construction is in the pipeline within 1–3 miles? Heavy new supply typically softens prices + rents 12–24 months out; constrained supply supports both.
Investment metrics
- 1% rule
- 1.47% ✓
- Cap rate
- 12.87%
- Cash-on-cash
- 23.49%
- DSCR
- 2.05
- GRM
- 5.7
CMA / ARV
- ARV (on-the-fly)
- $255,530
- Comps found
- 12
Show comp detail 12 sales within ~0.75 mi
| Address | Dist | Beds/Ba | Sqft | Sold | Price | $/sf | Match |
|---|---|---|---|---|---|---|---|
| 833 49th St N | 0.21mi | 3/2.0 | 1,231 (-3%) | 1mo | $200,000 | $162 | 81 |
| 829 49th St N | 0.20mi | 3/2.0 | 1,322 (+4%) | 1mo | $205,000 | $155 | 78 |
| 837 49th St N | 0.21mi | 3/2.0 | 1,322 (+4%) | 2mo | $200,000 | $151 | 77 |
| 832 49th St N | 0.24mi | 3/2.0 | 1,322 (+4%) | 2mo | $195,000 | $148 | 76 |
| 4831 2nd Ave N | 0.24mi | 3/2.0 | 1,400 (+11%) | 2mo | $249,900 | $179 | 65 |
| 5617 5th Ct S | 0.63mi | 3/1.0 | 1,236 (-2%) | 2mo | $369,000 | $299 | 65 |
| 616 52nd St S | 0.51mi | 3/1.0 | 1,355 (+7%) | 3mo | $210,000 | $155 | 62 |
| 5327 7th Ave S | 0.66mi | 3/1.0 | 1,159 (-8%) | 3mo | $296,900 | $256 | 53 |
| 4910 3rd Ave S | 0.47mi | 3/1.0 | 1,088 (-14%) | 3mo | $219,900 | $202 | 53 |
| 620 49th St S | 0.65mi | 2/2.0 (-1) | 1,332 (+5%) | 2mo | $399,000 | $300 | 50 |
| 5104 8th Ct S | 0.69mi | 2/2.0 (-1) | 1,330 (+5%) | 1mo | $350,000 | $263 | 49 |
| 612 54th St S | 0.57mi | 3/2.0 | 1,426 (+13%) | 2mo | $405,000 | $284 | 47 |
Match score weights: distance 35% · size 25% · config 20% · recency 20%. Top-matched comps best support the ARV.
Projected returns pro-forma
-3.0% appreciation · 3.0% rent growth · sell at horizon
- IRR
- 16.6%
- Equity multiple
- 1.67×
- Total profit
- $17,748
- Equity at exit
- $14,165
- IRR
- 25.1%
- Equity multiple
- 3.18×
- Total profit
- $58,068
- Equity at exit
- $8,214
Cash invested: $26,600 (down + closing). Projections, not guarantees.
Landlord ↔ Tenant lean methodology
- Overall (STATE)
- 90 Strongly Landlord-Friendly
- State Alabama
- 90 Strongly Landlord-Friendly · R+15
- County
- — inherits STATE
- City
- — inherits STATE
ZIP-level market 35212
- Active inventory
- 81
- Price-to-rent
- 5.7×
Monthly cashflow live
- Estimated rent
- $1,400 high interval (Pro) →
- Mortgage (P&I)
- −$498
- Tax from tax record
- −$47 /mo · $570/yr
- Insurance
- −$40
- HOA
- −$0
- Vacancy / Maint / Mgmt
- −$294
- Net cashflow
- $521
Break-even live
UW: 25.0% down · 7.5% · 30yr · 1.5% tax · 5.0% vac · 8.0% maint · 8.0% mgmt
Financing live
Cash to close
- Down payment
- $23,750
- Closing costs
- $2,850
- Reserves months
- —
- Total cash needed
- —
Loan-product check · same deal, 3 products live
Conventional
25% down · 7.5% · 30yr
- Down + closing
- —
- Monthly P&I
- —
- Monthly cashflow
- —
- DSCR
- —
- Eligible?
- —
Personal DTI + credit; lowest rate.
DSCR
20% down · 8.5% · 30yr
- Down + closing
- —
- Monthly P&I
- —
- Monthly cashflow
- —
- DSCR
- —
- Eligible?
- —
No personal income docs; deal must DSCR.
Hard money
10% down · 12.0% · 12mo
- Down + closing
- —
- Monthly P&I
- —
- Monthly cashflow
- —
- DSCR
- —
- Eligible?
- —
Short-term bridge; refi at stabilization.
Rent comps 32 comps
| Address | Beds | Baths | Sqft | Rent | $/sqft | DOM | Units | Dist |
|---|---|---|---|---|---|---|---|---|
| 233 52nd St N Birmingham, AL | 2.0 | 1.0 | 1430 | $1,200 | $0.84 | 43d | 1 | 0.05mi |
| 821 50th St N Birmingham, AL | 3.0 | 1.5 | 1416 | $1,523 | $1.08 | 1d | 1 | 0.16mi |
| 222 49th St N Birmingham, AL | 3.0 | 2.0 | 1556 | $1,800 | $1.16 | 23d | 1 | 0.26mi |
| 236 48th St N Birmingham, AL | 3.0 | 2.0 | 1318 | $1,750 | $1.33 | 2d | 1 | 0.30mi |
| 941 47th Pl N Birmingham, AL | 3.0 | 1.0 | 879 | $950 | $1.08 | 23d | 1 | 0.38mi |
| 934 47th St N Birmingham, AL | 3.0 | 1.0 | 972 | $1,000 | $1.03 | 23d | 1 | 0.49mi |
| 620 52nd St S Birmingham, AL | 3.0 | 2.0 | 1346 | $2,750 | $2.04 | 23d | 1 | 0.51mi |
| 1101 47th St N Birmingham, AL | 3.0 | 2.0 | 1296 | $1,200 | $0.93 | 23d | 1 | 0.59mi |
| 5811 2nd Ave N Birmingham, AL | 2.0 | 1.0 | 1000 | $1,200 | $1.20 | 3d | 1 | 0.68mi |
| 1601 48th St N Birmingham, AL | 3.0 | 1.0 | 1313 | $1,200 | $0.91 | 23d | 1 | 0.73mi |
| 1304 46th St N Birmingham, AL | 3.0 | 1.0 | 1683 | $670 | $0.40 | 16d | 1 | 0.73mi |
| 1705 52nd St N Birmingham, AL | 3.0 | 1.5 | 1214 | $1,100 | $0.91 | 43d | 1 | 0.80mi |
| 5620 8th Ave S Birmingham, AL | 3.0 | 1.0 | 1508 | $2,400 | $1.59 | 11d | 1 | 0.81mi |
| 712 47th Way S Birmingham, AL | 2.0 | 1.0 | 1042 | $1,725 | $1.66 | 19d | 1 | 0.83mi |
| 724 47th Way S Unit 1019289P Birmingham, AL | 2.0 | 1.0 | 1044 | $8,438 | $8.08 | 43d | 1 | 0.86mi |
| 813 42nd Pl N Birmingham, AL | 3.0 | 2.0 | 1424 | $1,285 | $0.90 | 43d | 1 | 0.88mi |
| 936 54th St S Birmingham, AL | 3.0 | 1.5 | 1317 | $1,950 | $1.48 | 2d | 1 | 0.90mi |
| 4345 2nd Ave S Birmingham, AL | 3.0 | 2.0 | 988 | $1,800 | $1.82 | 23d | 1 | 0.90mi |
| 1117 42nd Pl N Birmingham, AL | 3.0 | 1.0 | 1026 | $900 | $0.88 | 43d | 1 | 0.94mi |
| 4108 7th Ave N Birmingham, AL | 3.0 | 1.0 | 1100 | $1,350 | $1.23 | 23d | 1 | 1.02mi |
| 559 63rd St S Birmingham, AL | 3.0 | 1.0 | 930 | $1,000 | $1.08 | 3d | 1 | 1.05mi |
| 6309 3rd Ave S Birmingham, AL | 4.0 | 2.0 | 1228 | $1,495 | $1.22 | 1d | 1 | 1.10mi |
| 1017 Cahaba St Birmingham, AL | 2.0 | 2.0 | 1035 | $1,350 | $1.30 | 3d | 1 | 1.21mi |
| 1410 46th St S Birmingham, AL | 3.0 | 1.0 | 1200 | $1,000 | $0.83 | 43d | 1 | 1.24mi |
| 6107 Crest Green Rd Birmingham, AL | 2.0 | 1.5 | 1273 | $995 | $0.78 | 43d | 1 | 1.28mi |
| 532 Athens Ct Birmingham, AL | 3.0 | 1.0 | 1138 | $1,125 | $0.99 | 43d | 1 | 1.29mi |
| 3920 11th Ave N Birmingham, AL | 3.0 | 2.0 | 1200 | $1,025 | $0.85 | 2d | 1 | 1.32mi |
| 126 66th Pl N Birmingham, AL | 2.0 | 1.0 | 1038 | $1,200 | $1.16 | 14d | 1 | 1.35mi |
| 417 Athens Ave Birmingham, AL | 3.0 | 1.5 | 978 | $1,250 | $1.28 | 23d | 1 | 1.37mi |
| 117 67th Pl N Birmingham, AL | 3.0 | 1.0 | 1202 | $800 | $0.67 | 16d | 1 | 1.46mi |
| 6241 Crest Green Rd Birmingham, AL | 3.0 | 2.0 | 1380 | $1,210 | $0.88 | 23d | 1 | 1.47mi |
| 601 Dublin Ave Birmingham, AL | 4.0 | 1.5 | 1288 | $1,050 | $0.82 | 43d | 1 | 1.47mi |
Listing history 15 events
-
2026-06-18days on market $94,999 Active 27 DOM
-
2026-06-17days on market $94,999 Active 26 DOM
-
2026-06-16days on market $94,999 Active 25 DOM
-
2026-06-15days on market $94,999 Active 24 DOM
-
2026-06-13pricedays on market $94,999 Active 22 DOM
-
2026-06-10days on market $99,000 Active 19 DOM
-
2026-06-09days on market $99,000 Active 18 DOM
-
2026-06-08days on market $99,000 Active 17 DOM
-
2026-06-07days on market $99,000 Active 16 DOM
-
2026-06-03days on market $99,000 Active 12 DOM
-
2026-06-02days on market $99,000 Active 11 DOM
-
2026-06-01pricedays on market $99,000 Active 10 DOM
-
2026-05-31days on market $105,000 Active 9 DOM
-
2026-05-22$105,000 Active
-
1981-09-01soldstatus $18,500
ⓘ Source: listings_history table (triggers on properties + properties_extension) + one-shot
backfill from property_details.listing_events for pre-trigger history.
Tax reassessment forecast AL · Resets to sale price
- Current annual tax
- $570 · $47/mo
- Projected year-2 tax
- $570 · $47/mo
- Expected delta
- $0/yr ($0/mo · 0.0%)
ⓘ Screening estimate from a state-policy table — verify with the county assessor before closing.
Climate risk First Street
- Flood 1/10 Low FEMA zone X (unshaded) · 0% chance over 30 yrs
- Wildfire 1/10 Low
- Heat 6/10 Major 7 d/yr ≥106°F today · 19 d/yr by 30 yrs out
- Wind 6/10 Major 27% chance of damaging wind over 30 yrs
- Air quality 4/10 Moderate 6 unhealthy d/yr today · 8 by 30 yrs out
Nearby sold comps map
Loading sold comps map…
Walkable amenities ~0.75 mi
Loading nearby amenities…
Taxation est. · year 1
- Rental income
- $16,800
- − Mortgage interest
- −$5,321
- − Property taxes
- −$570
- − Insurance
- −$475
- − Repairs & maintenance
- −$1,344
- − Management
- −$1,344
- − Depreciation
- −$2,764
- Taxable income
- $4,982
- Est. tax owed @ 24.0%
- −$1,196
- After-tax cash flow
- $5,053/yr
For passive investors: Depreciation is non-cash, so a rental often shows a tax loss while cash-flowing — sheltering income. Rental losses are passive: they offset passive income freely, and up to $25,000/yr can offset ordinary (W-2) income if you actively participate and your MAGI is under $100k (phasing out to $0 by $150k); unused losses carry forward. On sale, claimed depreciation is recaptured at up to 25%, and gains may owe capital-gains tax (a 1031 exchange can defer both). Figures are a year-1 estimate at your 24.0% rate — not tax advice; consult a CPA.
Schools (NCES district)
- District
- Birmingham City
- NCES district ID
- 0100390
- Math proficiency
- 4% ▼ -17.00%
- Reading proficiency
- 20% ▼ -4.00%
- Median HH income
- $31,988
- Composite
- 9.49/100
- National rank
- #9850
- State rank
- #116 of 129 in AL
Livability — Birmingham
- Score
- 67/100
- State rank
- #78
- US rank
- #10412
Category grades
Schools grade is shown separately in the Schools card above.
Census & demographics
- Census place
- Birmingham, AL
- County
- Jefferson County · 527,445 people
- City population
- 210,422
- Metro
- Birmingham-Hoover, AL
- Population (ZIP)
- 10,160
- Household income
- $36,633
- Rent vs Own
- Severe rent burden
- 798.0
Population outlook (Jefferson County) Hauer SSP2
- Today (2025)
- 669,185 people
- By 2030
- 669,694 · +0.1%
- By 2040
- 661,388 · -1.2%
- By 2050
- 643,086 · -3.9%
- By 2075
- 577,267 · -13.7%
- By 2100
- 474,758 · -29.1%
Race, ethnicity, and origin ACS 2023
- Neighborhood character
- Predominantly Black (68%)
- Race & ethnicity
- Black 68% White 24% Hispanic / Latino 6% Two or more races 3% Asian 1%
- Hispanic origin (detail)
- Mexican 3%
- Common ancestry
- Italian 2% Slovak 2% Hispanic 1%
- Foreign-born
- 3% · Canada
- Languages at home
- 95% English-only · Spanish 3% French/Haitian/Cajun 1%
Political lean MEDSL · Jefferson
- 2024 margin
- D (+10.4) · D 54.6% · R 44.2% · Other 1.2%
- 2008→2024 swing
- +5.4pp toward D · 2008: 5.1pp · 2024: 10.4pp
- All cycles
- 2024: D+10.4 2020: D+13.2 2016: D+7.2 2012: D+6.0 2008: D+5.1
Not yet ingested
- Civics
- —
Market trends
- HPI YoY
- ▼ -190.24%
- Current HPI
- 120.1264
- Rent YoY
- —
- Metro
- Birmingham-Hoover, AL
- State GDP YoY
- ▲ 2.94%
- F500 in state
- 4
Industry mix (Fortune 500 HQ in AL)
| Industry | F500 HQs | Revenue |
|---|---|---|
| Financial Services | 1 | $8B |
|
||
| Healthcare | 1 | $5B |
|
||
Price history
+467.6% since first listed2 events — show timeline
- 2026-05-22 Listed $105,000 Greater Alabama MLS
- 1981-09-01 Sold (Public Records) $18,500 Public Records
Property tax history
-1.1%/yrLatest (2025): $570 · +0.0% YoY. Source: county tax records.
Cash-flow waterfall
monthlySold comps — $/sqft
last 12 mo · ≤1 miLoading sold comps…