77 Red Ledge Rd · Dixfield, ME
Flood risk 1/10 · Minimal
- FEMA flood zone
- X (unshaded)
- Chance of flooding over 30 yrs
- 0.0%
- Est. flood insurance / yr
- $507 – $1,088
Fire risk 3/10 · Minor
- Est. fire insurance / yr
- $669 – $1,243
Heat risk 1/10 · Minimal
- Hot days now (above 91°F)
- 6 days/yr
- Hot days in 30 yrs
- 13 days/yr
Wind risk 3/10 · Minor
- Chance of severe wind over 30 yrs
- 6.0%
Air-quality risk 2/10 · Minimal
- Unhealthy air days now
- 1 days/yr
- Unhealthy air days in 30 yrs
- 1 days/yr
Risk factors via First Street. Map © Google.
Why this score? — see what drove the B+ grade
The composite is a weighted blend of 9 inputs, each scored 0–100. Each bar is that input's sub-score; the figure is the points it added to the 100-point composite (weight × sub-score).
- Cash flow +30.0/30.0
- 1% rule +10.0/10.0
- DSCR +10.0/10.0
- ARV discount +7.5/15.0
- Appreciation +6.4/10.0
- Schools +6.4/10.0
- Livability +3.4/5.0
- Rent growth +2.5/5.0
- Condition / age +2.5/5.0
$49,500
🖨 Deal sheet 📄 Offer letter ✓ Due diligence
Listing remarks
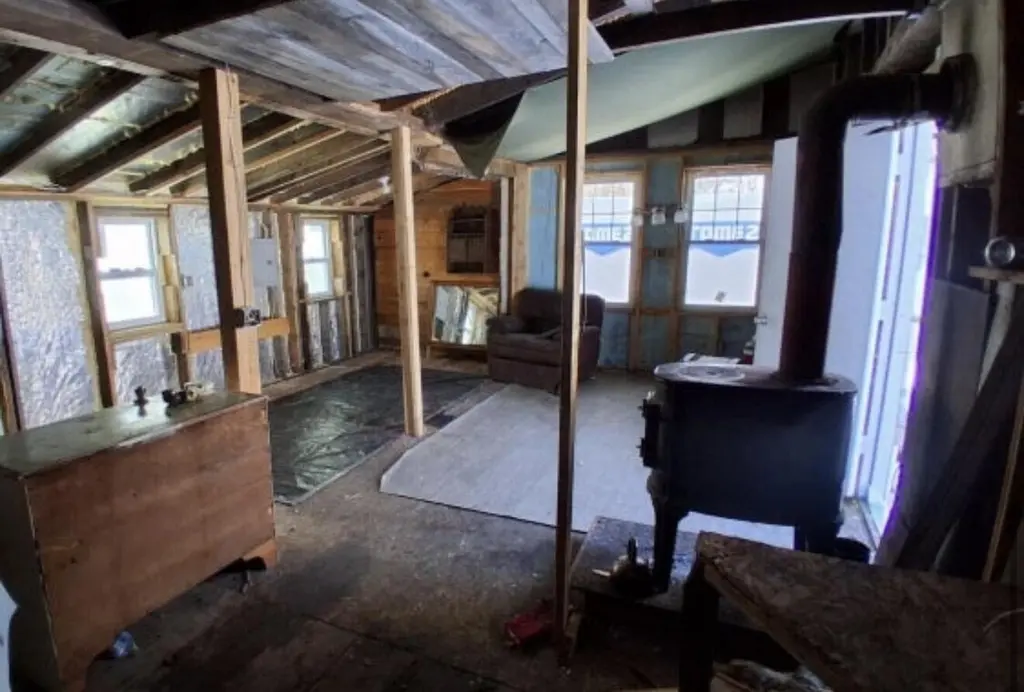
Here is your chance to own an affordable small recreational camp in Maine with a convenient location. Just outside of town, but yet remote enough to satisfy all your hunting and fishing needs. Check out this seasonal camp today and bring your imagination to finish the project. Featuring a new metal roof and windows, power and a wood stove. This snowmobile and atv property is ready for use.
Key facts
- New metal roof
- Wood stove
- Atv property
Tags
Property features AI
Finance
- HOA & community: No pet restrictions
Exterior
- Parking: Gravel parking for 5–10 vehicles
- Utilities: Electric service (circuit breakers)
- Home design: Single-family residence; One-story (750 sq ft above grade); Built in 1900
- Construction: Wood frame construction; Metal roof; Seller-provided building area (750 sq ft)
- Exterior features: Wooded, rural lot; Gravel and dirt road access; Gravel parking area with space for 5–10 vehicles
Interior
- Heating & cooling: Wood stove heating; Electric service with circuit breakers
- Interior features: One room total; Living room (first level) — approximately 25 by 15 ft
Neighborhood map
What this means for you Summary
Snapshot
- This is a 1-bed/?-bath other listed at $50k.
Deal economics
- At list price, monthly cash flow is $367 ($4k/yr) — positive.
- The deal already cash-flows at list — no discount required.
- Meets the 1% rule at list price ($842 rent vs $50k).
- Recommended offer: $48k (3.0% below list) — sets the bar for market timing.
Location & tenants
- Location reads 67/100 on livability (#92 in ME) — a middle-class / working-renter tenant base. Strengths: crime A+, cost of living A+, health & safety A+; Watch: schools D-, amenities F, commute F.
- RSU 56 (rural): math 74% / reading 81% proficiency, ranked #95 of 112 in ME (top 85%) — strong family-tenant draw, lease renewals of 3-5y typical.
- Market conditions: 27 active listings in the ZIP; 329 units permitted in Oxford County in 2024 (0 in 5+ unit buildings).
Forward outlook
- In year one you build about $2k of equity ($342 loan paydown + $1k appreciation (2.9% local appreciation)).
- Oxford County population projected at -21% by 2050 — secular population decline; favor cash flow + early exit over multi-decade hold.
- At projected returns (2.9% appreciation + 3.0% rent growth), your $14k cash investment doubles in ~3 years — after that, you're playing with house money.
Negotiation context
- It's been on market 55 days — a 3% lower offer ($48k) is reasonable based on typical stale-listing flexibility.
- 2 sale attempts with the ask held roughly flat each time — persistent listings suggest the price (not the market) is what's stuck; bring a comps-based counter.
- Current owner paid $6k; list at $50k implies a 725% gain — meaningful room to come down on a strong offer.
Risks & watch-outs
- Watch-outs: built in 1900 — expect roof / HVAC / electrical / plumbing capex.
Questions for the listing agent
- It's been on market 55 days. Have you received any prior offers? Is the seller open to a 3% concession, seller financing, or rate buy-down credit?
- Built in 1900 — when were the roof, HVAC, electrical panel, plumbing, and water heater last replaced?
- Is there a deadline driving the sale (1031 exchange, divorce, estate, relocation)? That informs how much negotiation room exists.
- Schools are D-rated, which usually means shorter tenancies and higher turnover. Who's the typical renter profile here, and what's been the actual vacancy rate?
- What's the average days-on-market for RENTAL listings here right now (not sales)? A rising rental-DOM trend means longer vacancies and softer asking-rent achievability than the comps imply.
- What's the recent tenant-quality profile in this submarket — average credit score on applications, eviction rate, late-payment / NSF rate, and stable-employment percentage? A property-management company in the area should have these aggregated.
- How much new for-sale + rental construction is in the pipeline within 1–3 miles? Heavy new supply typically softens prices + rents 12–24 months out; constrained supply supports both.
Investment metrics
- 1% rule
- 1.70% ✓
- Cap rate
- 15.19%
- Cash-on-cash
- 31.79%
- DSCR
- 2.41
- GRM
- 4.9
CMA / ARV
- ARV (median comp)
- $129,699
- List price
- $49,500
- Delta
- -61.83%
- Verdict
- UNDERPRICED
- Comps
- 8 within 2.0 mi
Projected returns pro-forma
2.86% appreciation · 3.0% rent growth · sell at horizon
- IRR
- 37.3%
- Equity multiple
- 3.09×
- Total profit
- $28,958
- Equity at exit
- $21,860
- IRR
- 37.5%
- Equity multiple
- 6.11×
- Total profit
- $70,772
- Equity at exit
- $33,384
Cash invested: $13,860 (down + closing). Projections, not guarantees.
Landlord ↔ Tenant lean methodology
- Overall (STATE)
- 41 Moderately Tenant-Leaning
- State Maine
- 41 Moderately Tenant-Leaning · D+2
- County
- — inherits STATE
- City
- — inherits STATE
ZIP-level market 04224
- Home prices YoY
- 1.3%
- Active inventory
- 27
- Price-to-rent
- 4.9×
Monthly cashflow live
- Estimated rent
- $842 medium interval (Pro) →
- Mortgage (P&I)
- −$260
- Tax from tax record
- −$18 /mo · $214/yr
- Insurance
- −$21
- HOA
- −$0
- Vacancy / Maint / Mgmt
- −$177
- Net cashflow
- $367
Break-even live
UW: 25.0% down · 7.5% · 30yr · 1.5% tax · 5.0% vac · 8.0% maint · 8.0% mgmt
Financing live
Cash to close
- Down payment
- $12,375
- Closing costs
- $1,485
- Reserves months
- —
- Total cash needed
- —
Loan-product check · same deal, 3 products live
Conventional
25% down · 7.5% · 30yr
- Down + closing
- —
- Monthly P&I
- —
- Monthly cashflow
- —
- DSCR
- —
- Eligible?
- —
Personal DTI + credit; lowest rate.
DSCR
20% down · 8.5% · 30yr
- Down + closing
- —
- Monthly P&I
- —
- Monthly cashflow
- —
- DSCR
- —
- Eligible?
- —
No personal income docs; deal must DSCR.
Hard money
10% down · 12.0% · 12mo
- Down + closing
- —
- Monthly P&I
- —
- Monthly cashflow
- —
- DSCR
- —
- Eligible?
- —
Short-term bridge; refi at stabilization.
Listing history 17 events
-
2026-06-18days on market $49,500 Active 55 DOM
-
2026-06-17days on market $49,500 Active 54 DOM
-
2026-06-16days on market $49,500 Active 53 DOM
-
2026-06-15days on market $49,500 Active 52 DOM
-
2026-06-13days on market $49,500 Active 50 DOM
-
2026-06-12days on market $49,500 Active 49 DOM
-
2026-06-09days on market $49,500 Active 46 DOM
-
2026-06-08days on market $49,500 Active 45 DOM
-
2026-06-07days on market $49,500 Active 44 DOM
-
2026-06-05days on market $49,500 Active 42 DOM
-
2026-06-04days on market $49,500 Active 40 DOM
-
2026-06-02days on market $49,500 Active 39 DOM
-
2026-06-01days on market $49,500 Active 38 DOM
-
2026-05-31days on market $49,500 Active 37 DOM
-
2026-05-31days on market $49,500 Active 36 DOM
-
2026-04-24$49,500 Active 392-char remark
-
2005-07-29soldstatus $6,000
ⓘ Source: listings_history table (triggers on properties + properties_extension) + one-shot
backfill from property_details.listing_events for pre-trigger history.
Tax reassessment forecast ME · Partial reset (capped growth)
- Current annual tax
- $214 · $18/mo
- Projected year-2 tax
- $444 · $37/mo
- Expected delta
- +$230/yr (+$19/mo · 107.3%)
ⓘ Screening estimate from a state-policy table — verify with the county assessor before closing.
Climate risk First Street
- Flood 1/10 Low FEMA zone X (unshaded) · 0% chance over 30 yrs
- Wildfire 3/10 Moderate
- Heat 1/10 Low 6 d/yr ≥91°F today · 13 d/yr by 30 yrs out
- Wind 3/10 Moderate 6% chance of damaging wind over 30 yrs
- Air quality 2/10 Low 1 unhealthy d/yr today · 1 by 30 yrs out
Nearby sold comps map
Loading sold comps map…
Walkable amenities ~0.75 mi
Loading nearby amenities…
Taxation est. · year 1
- Rental income
- $10,104
- − Mortgage interest
- −$2,773
- − Property taxes
- −$214
- − Insurance
- −$248
- − Repairs & maintenance
- −$808
- − Management
- −$808
- − Depreciation
- −$1,440
- Taxable income
- $3,813
- Est. tax owed @ 24.0%
- −$915
- After-tax cash flow
- $3,490/yr
For passive investors: Depreciation is non-cash, so a rental often shows a tax loss while cash-flowing — sheltering income. Rental losses are passive: they offset passive income freely, and up to $25,000/yr can offset ordinary (W-2) income if you actively participate and your MAGI is under $100k (phasing out to $0 by $150k); unused losses carry forward. On sale, claimed depreciation is recaptured at up to 25%, and gains may owe capital-gains tax (a 1031 exchange can defer both). Figures are a year-1 estimate at your 24.0% rate — not tax advice; consult a CPA.
Schools (NCES district)
- District
- RSU 56
- NCES district ID
- 2314833
- Math proficiency
- 74% ▲ 55.00%
- Reading proficiency
- 81% ▲ 37.00%
- Median HH income
- $38,091
- Composite
- 64.43/100
- National rank
- #544
- State rank
- #95 of 112 in ME
Livability — Dixfield
- Score
- 67/100
- State rank
- #92
- US rank
- #10320
Category grades
Schools grade is shown separately in the Schools card above.
Census & demographics
- Population (ZIP)
- 3,077
Population outlook (Oxford County) Hauer SSP2
- Today (2025)
- 55,853 people
- By 2030
- 54,190 · -3.0%
- By 2040
- 49,484 · -11.4%
- By 2050
- 43,958 · -21.3%
- By 2075
- 32,308 · -42.2%
- By 2100
- 21,858 · -60.9%
Race, ethnicity, and origin ACS 2023
- Neighborhood character
- Predominantly White (94%)
- Race & ethnicity
- White 94% Hispanic / Latino 5% Two or more races 3%
- Common ancestry
- Lithuanian 11% Slovak 5% German 2%
- Foreign-born
- 1% · Canada
- Languages at home
- 99% English-only · French/Haitian/Cajun 1%
Political lean MEDSL · Oxford
- 2024 margin
- R (+12.9) · D 42.7% · R 55.6% · Other 1.7%
- 2008→2024 swing
- -28.9pp toward R · 2008: 16.0pp · 2024: -12.9pp
- All cycles
- 2024: R+12.9 2020: R+8.8 2016: R+13.0 2012: D+14.9 2008: D+16.0
Not yet ingested
- Civics
- —
Market trends
- HPI YoY
- ▲ 2.86%
- Current HPI
- 219.9452
- Rent YoY
- —
- Metro
- —
- State GDP YoY
- —
- F500 in state
- 0
Price history
+725.0% since first listed4 events — show timeline
- 2026-04-24 Listed $49,500 MREIS
- 2026-03-11 Delisted — MREIS
- 2026-02-17 Listed $58,000 MREIS
- 2005-07-29 Sold (Public Records) $6,000 Public Records
Property tax history
-1.6%/yrLatest (2025): $214 · +8.6% YoY. Source: county tax records.
Cash-flow waterfall
monthlySold comps — $/sqft
last 12 mo · ≤1 miLoading sold comps…