 Multi-family
🌊 Lakefront
Multi-family
🌊 Lakefront
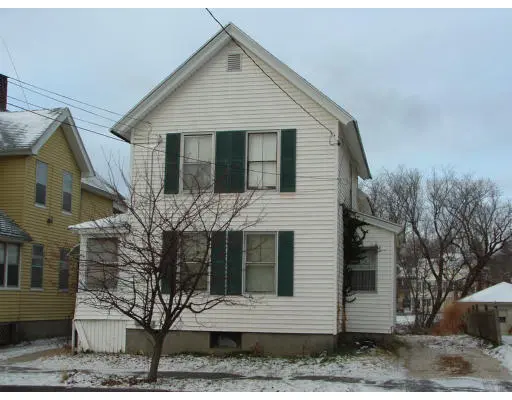
147 Dewey Ave · Pittsfield, MA
Flood risk 6/10 · Moderate
- FEMA flood zone
- AE
- Chance of flooding over 30 yrs
- 0.72%
- Est. flood insurance / yr
- $2,026 – $9,024
Fire risk 3/10 · Minor
- Est. fire insurance / yr
- $915 – $1,699
Heat risk 3/10 · Minor
- Hot days now (above 92°F)
- 7 days/yr
- Hot days in 30 yrs
- 17 days/yr
Wind risk 4/10 · Minor
- Chance of severe wind over 30 yrs
- 10.0%
Air-quality risk 2/10 · Minimal
- Unhealthy air days now
- 1 days/yr
- Unhealthy air days in 30 yrs
- 1 days/yr
Risk factors via First Street. Map © Google.
Why this score? — see what drove the B- grade
The composite is a weighted blend of 9 inputs, each scored 0–100. Each bar is that input's sub-score; the figure is the points it added to the 100-point composite (weight × sub-score).
- Cash flow +30.0/30.0
- 1% rule +10.0/10.0
- DSCR +10.0/10.0
- ARV discount +5.9/15.0
- Rent growth +4.4/5.0
- Livability +3.8/5.0
- Condition / age +2.5/5.0
- Schools +2.3/10.0
- Appreciation +0.0/10.0
$189,900
🖨 Deal sheet (PDF) 📄 Offer letter ✓ Due diligence
Multi-family units
County records classify this as Multi-Family (2-4 Unit). Listing-text estimate: 1 unit. estimate disagrees with records
Listing remarks
Opportunity awaits with this in-town multi-family flat, ideal for investors or owner-occupants. The first-floor unit offers 3 bedrooms, 1 full bath, and a new large covered side/back porch. The second-floor unit includes 1 bedroom, a 3/4 bath, and a small bonus room for added flexibility. An enclosed front porch, off-street parking, and a large/deep backyard with direct access to the Southwest Branch of the Housatonic River add to the property's appeal. Recent updates include a new roof in 2024, some vinyl replacement windows, and 2025 boiler improvements, including a new controller water filter and additional radiators. A practical option for those looking for rental income, owner-occupanc
Key facts
- Off street parking
- Large deep backyard
- New roof
Tags
Neighborhood map
What this means for you Summary
Snapshot
- This is a 2-bed/2.0-bath multifamily listed at $190k.
Deal economics
- At list price, monthly cash flow is $904 ($11k/yr) — positive.
- The deal already cash-flows at list — no discount required.
- Meets the 1% rule at list price ($3k rent vs $190k).
- Recommended offer: $184k (3.0% below list) — sets the bar for market timing.
- Cap rate 14.9% vs local median 3.6% in Pittsfield — top-decile yield for the area; either an underpriced asset or a hidden risk that comps aren't pricing in. Stress-test before assuming the spread holds.
Location & tenants
- Location reads 75/100 on livability (#70 in MA, #3,820 nationally) — a middle-class / working-renter tenant base. Strengths: commute A+, housing A+, health & safety A+; Watch: employment C-, amenities D+, schools D.
- Pittsfield (urban): math 19% / reading 34% proficiency, ranked #272 of 302 in MA (top 90%) — low school quality limits family demand, transient renter base, plan for 1-2y turnover.
- Market conditions: Rents rising fast (+7.7%/yr); 276 active listings in the ZIP; 6 comparable units currently listed for rent nearby; rentals lingering (median 45d on market — plan ~5-8 weeks vacancy on turnover, expect pricing pressure); 83% of comp listings sitting > 30 days — soft ceiling on asking rent; 130 units permitted in Berkshire County in 2024 (10 in 5+ unit buildings).
- At $3,220/mo this rent would consume 54% of the median local household income ($71k/yr) (locally 1580% of renters already pay >50% of income on rent) — very limited rent-growth headroom before tenants either downsize or default.
Forward outlook
- Local home prices are declining (-3.0%/yr); year-one equity from $1k of loan paydown is wiped out by about $6k of value loss. Plan a longer hold.
- Berkshire County population projected at -24% by 2050 — secular population decline; favor cash flow + early exit over multi-decade hold.
- At projected returns (-3.0% appreciation + 7.7% rent growth), your $53k cash investment doubles in ~5 years — after that, you're playing with house money.
Negotiation context
- It's been on market 46 days — a 3% lower offer ($184k) is reasonable based on typical stale-listing flexibility.
- 10 sale attempts since 22y ago with the ask held roughly flat each time — persistent listings suggest the price (not the market) is what's stuck; bring a comps-based counter.
- Current owner paid $86k; list at $190k implies a 121% gain — meaningful room to come down on a strong offer.
Risks & watch-outs
- Watch-outs: flood insurance adds $460/mo; built in 1880 — expect roof / HVAC / electrical / plumbing capex.
- Climate carrying-cost: in FEMA flood zone AE (mandatory federal flood insurance) — expect insurance premiums to compound above CPI over the hold.
Questions for the listing agent
- It's been on market 46 days. Have you received any prior offers? Is the seller open to a 3% concession, seller financing, or rate buy-down credit?
- Built in 1880 — when were the roof, HVAC, electrical panel, plumbing, and water heater last replaced?
- What's the actual annual flood-insurance premium (NFIP or private), and is the property in a SFHA with mandatory coverage?
- Is there a deadline driving the sale (1031 exchange, divorce, estate, relocation)? That informs how much negotiation room exists.
- Schools are D-rated, which usually means shorter tenancies and higher turnover. Who's the typical renter profile here, and what's been the actual vacancy rate?
- Crime grade is D in this area — have there been break-ins, vandalism, or insurance claims at this property in the last 3 years? What carrier currently insures it and at what premium?
- This sits on a lake — are riparian / water-frontage rights deeded with the parcel? Any dock permits, shoreline easements, or HOA water-use restrictions?
- What's the documented flood / surge / shoreline-erosion history here (FEMA AND non-FEMA — e.g., storm surge, creek backup, septic-field saturation)?
- Any water-quality or seasonal algae-bloom issues that affect tenant satisfaction or short-term-rental demand?
- What's the average days-on-market for RENTAL listings here right now (not sales)? A rising rental-DOM trend means longer vacancies and softer asking-rent achievability than the comps imply.
- What's the recent tenant-quality profile in this submarket — average credit score on applications, eviction rate, late-payment / NSF rate, and stable-employment percentage? A property-management company in the area should have these aggregated.
- How much new apartment / multifamily construction is in the pipeline within 1–3 miles? Heavy new supply (>2% of stock underway) typically softens rents 12–24 months out; light construction supports rent growth.
Investment metrics
- 1% rule
- 1.70% ✓
- Cap rate
- 14.91%
- Cash-on-cash
- 30.79%
- DSCR
- 2.37
- GRM
- 4.9
CMA / ARV
- ARV (median comp)
- $183,318
- List price
- $189,900
- Delta
- 3.59%
- Verdict
- FAIR
- Comps
- 20 within 1.0 mi
Show comp detail 2 sales within ~0.75 mi
| Address | Dist | Beds/Ba | Sqft | Sold | Price | $/sf | Match |
|---|---|---|---|---|---|---|---|
| 250 Linden St | 0.26mi | 3/2.0 (+1) | 1,320 (-11%) | 15mo | $180,000 | $136 | 52 |
| 79 Center St | 0.59mi | 3/3.0 (+1) | 1,603 (+8%) | 4mo | $220,000 | $137 | 47 |
Match score weights: distance 35% · size 25% · config 20% · recency 20%. Top-matched comps best support the ARV.
Projected returns pro-forma
-3.0% appreciation · 7.72% rent growth · sell at horizon
- IRR
- 18.7%
- Equity multiple
- 1.81×
- Total profit
- $43,073
- Equity at exit
- $28,315
- IRR
- 30.6%
- Equity multiple
- 4.48×
- Total profit
- $185,142
- Equity at exit
- $16,419
Cash invested: $53,172 (down + closing). Projections, not guarantees.
Landlord ↔ Tenant lean methodology
- Overall (STATE)
- 20 Strongly Tenant-Friendly
- State Massachusetts
- 20 Strongly Tenant-Friendly · D+15
- County
- — inherits STATE
- City
- — inherits STATE
ZIP-level market 01201
- Rents YoY
- 7.7%
- Active inventory
- 276
- Price-to-rent
- 8.5×
Monthly cashflow live
- Estimated rent
- $3,220 medium interval (Pro) →
- Mortgage (P&I)
- −$996
- Tax from tax record
- −$104 /mo · $1,253/yr
- Insurance
- −$79
- Flood insurance flood zone
- −$460 /mo · $5,525/yr
- HOA
- −$0
- Vacancy / Maint / Mgmt
- −$676
- Net cashflow
- $904
Break-even live
Sensitivity live
| Price | -10% $1,011 | -5% $958 | +0% $904 | +5% $850 | +10% $796 |
|---|---|---|---|---|---|
| Rent | -10% $650 | -5% $777 | +0% $904 | +5% $1,031 | +10% $1,158 |
| Rate | -1.0pp $1,000 | -0.5pp $952 | base $904 | +0.5pp $855 | +1.0pp $805 |
2-unit breakdown (identical units grouped — click to expand)
| Units | Beds | Baths | Est. rent |
|---|---|---|---|
| 1× unit | 3 | 1 | $1,860 |
| 1× unit | 1 | 0.75 | $1,359 |
| Total (2 units) | $3,220 | ||
UW: 25.0% down · 7.5% · 30yr · 1.5% tax · 5.0% vac · 8.0% maint · 8.0% mgmt
Financing live
Cash to close
- Down payment
- $47,475
- Closing costs
- $5,697
- Reserves months
- —
- Total cash needed
- —
Loan-product check · same deal, 3 products live
Conventional
25% down · 7.5% · 30yr
- Down + closing
- —
- Monthly P&I
- —
- Monthly cashflow
- —
- DSCR
- —
- Eligible?
- —
Personal DTI + credit; lowest rate.
DSCR
20% down · 8.5% · 30yr
- Down + closing
- —
- Monthly P&I
- —
- Monthly cashflow
- —
- DSCR
- —
- Eligible?
- —
No personal income docs; deal must DSCR.
Hard money
10% down · 12.0% · 12mo
- Down + closing
- —
- Monthly P&I
- —
- Monthly cashflow
- —
- DSCR
- —
- Eligible?
- —
Short-term bridge; refi at stabilization.
Rent comps 6 comps
| Address | Beds | Baths | Sqft | Rent | $/sqft | DOM | Units | Dist |
|---|---|---|---|---|---|---|---|---|
| 343 Columbus Ave Pittsfield, MA | 1.0 | 1.0 | 900 | $1,200 | $1.33 | 44d | 1 | 0.13mi |
| 155 Francis Ave Unit 3 Pittsfield, MA | 1.0 | 1.0 | 900 | $1,400 | $1.56 | 44d | 1 | 0.21mi |
| 266 Linden St Unit 2R Pittsfield, MA | 3.0 | 1.0 | 1000 | $1,750 | $1.75 | 24d | 1 | 0.30mi |
| 19 Atwood Ave Pittsfield, MA | 3.0 | 1.0 | 1350 | $1,600 | $1.19 | 44d | 1 | 0.78mi |
| 456 Fenn St Unit 4 Pittsfield, MA | 2.0 | 1.0 | 1000 | $1,450 | $1.45 | 44d | 1 | 0.91mi |
| 24 Curtin Ave Pittsfield, MA | 3.0 | 1.5 | 1176 | $1,600 | $1.36 | 44d | 1 | 1.05mi |
Listing history 24 events
-
2026-05-05historical
-
2026-03-20$189,900 Active
-
2019-12-23historical
-
2019-06-23$69,900
-
2019-02-27historical
-
2018-08-24historical
-
2018-07-19$79,000
-
2018-07-19$79,000
-
2013-09-25historical
-
2012-09-25$84,500
-
2007-03-29soldstatus $85,900
-
2007-01-09soldstatus $50,000
-
2007-01-09soldstatus $50,000
-
2007-01-09soldstatus $50,000
-
2006-12-05$67,500
-
2006-12-05$67,500
-
2006-10-28historical
-
2006-04-28historical
-
2005-10-28$67,500
-
2005-10-28$67,500
-
2004-10-04soldstatus $56,000
-
2004-09-14soldstatus $56,000
-
2004-06-02$64,900
-
2002-10-08soldstatus $28,000
ⓘ Source: listings_history table (triggers on properties + properties_extension) + one-shot
backfill from property_details.listing_events for pre-trigger history.
Tax reassessment forecast MA · Partial reset (capped growth)
- Current annual tax
- $1,253 · $104/mo
- Projected year-2 tax
- $1,794 · $150/mo
- Expected delta
- +$541/yr (+$45/mo · 43.2%)
ⓘ Screening estimate from a state-policy table — verify with the county assessor before closing.
Climate risk First Street
- Flood 6/10 Major FEMA zone AE · 72% chance over 30 yrs
- Wildfire 3/10 Moderate
- Heat 3/10 Moderate 7 d/yr ≥92°F today · 17 d/yr by 30 yrs out
- Wind 4/10 Moderate 10% chance of damaging wind over 30 yrs
- Air quality 2/10 Low 1 unhealthy d/yr today · 1 by 30 yrs out
Nearby sold comps map
Loading sold comps map…
Walkable amenities ~0.75 mi
Loading nearby amenities…
Taxation est. · year 1
- Rental income
- $38,640
- − Mortgage interest
- −$10,637
- − Property taxes
- −$1,253
- − Insurance
- −$6,475
- − Repairs & maintenance
- −$3,091
- − Management
- −$3,091
- − Depreciation
- −$5,524
- Taxable income
- $8,568
- Est. tax owed @ 24.0%
- −$2,056
- After-tax cash flow
- $8,791/yr
For passive investors: Depreciation is non-cash, so a rental often shows a tax loss while cash-flowing — sheltering income. Rental losses are passive: they offset passive income freely, and up to $25,000/yr can offset ordinary (W-2) income if you actively participate and your MAGI is under $100k (phasing out to $0 by $150k); unused losses carry forward. On sale, claimed depreciation is recaptured at up to 25%, and gains may owe capital-gains tax (a 1031 exchange can defer both). Figures are a year-1 estimate at your 24.0% rate — not tax advice; consult a CPA.
Schools (NCES district)
- District
- Pittsfield
- NCES district ID
- 2509630
- Math proficiency
- 19% ▼ -10.00%
- Reading proficiency
- 34% ▼ -2.00%
- Median HH income
- $44,032
- Composite
- 22.67/100
- National rank
- #8046
- State rank
- #272 of 302 in MA
Livability — Pittsfield
- Score
- 75/100
- State rank
- #70
- US rank
- #3820
Category grades
Schools grade is shown separately in the Schools card above.
Census & demographics
- Census place
- Pittsfield, MA
- County
- Berkshire County · 44,848 people
- City population
- 44,848
- Metro
- Pittsfield, MA
- Population (ZIP)
- 44,848
- Household income
- $71,093
- Rent vs Own
- Severe rent burden
- 1580.0
Population outlook (Berkshire County) Hauer SSP2
- Today (2025)
- 119,723 people
- By 2030
- 114,608 · -4.3%
- By 2040
- 102,806 · -14.1%
- By 2050
- 91,305 · -23.7%
- By 2075
- 71,517 · -40.3%
- By 2100
- 57,988 · -51.6%
Race, ethnicity, and origin ACS 2023
- Neighborhood character
- Predominantly White (78%)
- Race & ethnicity
- White 78% Two or more races 10% Hispanic / Latino 9% Black 5% Asian 1%
- Hispanic origin (detail)
- Puerto Rican 3%
- Common ancestry
- Lithuanian 8% Romanian 6% Slovak 2%
- Foreign-born
- 7% · Canada, Jamaica
- Languages at home
- 90% English-only · Spanish 6% Other Indo-European 1% Russian/Polish/Slavic 1%
Political lean MEDSL · Berkshire
- 2024 margin
- Solid D (+39.9) · D 68.9% · R 29.0% · Other 2.1%
- 2008→2024 swing
- -12.5pp toward R · 2008: 52.4pp · 2024: 39.9pp
- All cycles
- 2024: D+39.9 2020: D+47.1 2016: D+41.5 2012: D+53.7 2008: D+52.4
Not yet ingested
- Civics
- —
Market trends
- HPI YoY
- ▼ -199.88%
- Current HPI
- 283.3421
- Rent YoY
- ▲ 7.72%
- Metro
- Pittsfield, MA
- State GDP YoY
- ▲ 2.28%
- F500 in state
- 38
Industry mix (Fortune 500 HQ in MA)
| Industry | F500 HQs | Revenue |
|---|---|---|
| Technology | 3 | $17B |
|
||
| Insurance | 2 | $84B |
|
||
| Retail | 2 | $76B |
|
||
| Life Sciences | 1 | $43B |
|
||
| Energy Technology | 1 | $31B |
|
||
| Aerospace / Defense | 1 | $18B |
|
||
Price history
+578.2% since first listed24 events — show timeline
- 2026-05-05 Listing Removed — BCMLS
- 2026-03-20 Listed $189,900 BCMLS
- 2019-12-23 Listing Removed — BCMLS
- 2019-06-23 Listed $69,900 BCMLS
- 2019-02-27 Listing Removed — BCMLS
- 2018-08-24 Listing Removed — BCMLS
- 2018-07-19 Listed $79,000 BCMLS
- 2018-07-19 Listed $79,000 BCMLS
- 2013-09-25 Listing Removed — BCMLS
- 2012-09-25 Listed $84,500 BCMLS
- 2007-03-29 Sold (Public Records) $85,900 Public Records
- 2007-01-09 Sold (Public Records) $50,000 Public Records
- 2007-01-09 Sold (MLS) $50,000 BCMLS
- 2007-01-09 Sold (MLS) $50,000 MLS PIN
- 2006-12-05 Listed $67,500 BCMLS
- 2006-12-05 Listed $67,500 MLS PIN
- 2006-10-28 Listing Removed — BCMLS
- 2006-04-28 Listing Removed — BCMLS
- 2005-10-28 Listed $67,500 BCMLS
- 2005-10-28 Listed $67,500 BCMLS
- 2004-10-04 Sold (Public Records) $56,000 Public Records
- 2004-09-14 Sold (MLS) $56,000 BCMLS
- 2004-06-02 Listed $64,900 BCMLS
- 2002-10-08 Sold (Public Records) $28,000 Public Records
Property tax history
-1.0%/yrLatest (2023): $1,253 · +7.5% YoY. Source: county tax records.
Cash-flow waterfall
monthlySold comps — $/sqft
last 12 mo · ≤1 miLoading sold comps…