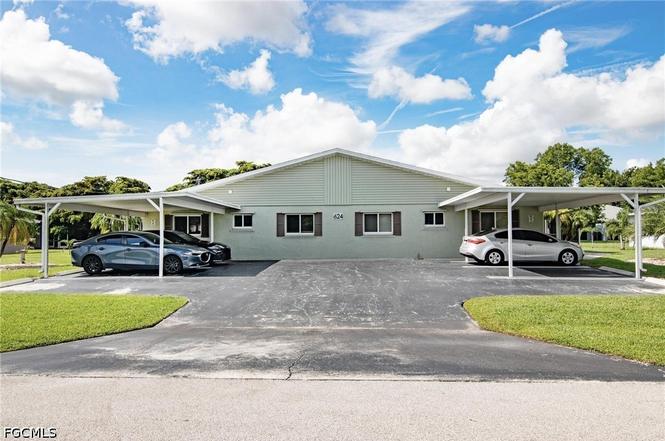
 Fourplex
624 SE 13th St #1 · Cape Coral, FL
Flood risk 6/10 · Moderate
- FEMA flood zone
- X (shaded)
- Chance of flooding over 30 yrs
- 0.57%
- Est. flood insurance / yr
- $507 – $1,088
Fire risk 1/10 · Minimal
- Est. fire insurance / yr
- $947 – $1,759
Heat risk 10/10 · Severe
- Hot days now (above 106°F)
- 7 days/yr
- Hot days in 30 yrs
- 29 days/yr
Wind risk 10/10 · Severe
- Chance of severe wind over 30 yrs
- 99.0%
Air-quality risk 2/10 · Minimal
- Unhealthy air days now
- 1 days/yr
- Unhealthy air days in 30 yrs
- 1 days/yr
Risk factors via First Street. Map © Google.
Why this score? — see what drove the D grade
The composite is a weighted blend of 9 inputs, each scored 0–100. Each bar is that input's sub-score; the figure is the points it added to the 100-point composite (weight × sub-score).
- Cash flow +13.7/30.0
- ARV discount +7.5/15.0
- DSCR +4.1/10.0
- Schools +4.1/10.0
- Livability +3.9/5.0
- 1% rule +3.6/10.0
- Condition / age +2.5/5.0
- Rent growth +0.7/5.0
- Appreciation +0.0/10.0
$669,000
🖨 Deal sheet 📄 Offer letter ✓ Due diligence
Multi-family units
County records classify this as Multi-Family (2-4 Unit). Listing-text estimate: 4 units. confirmed
Listing remarks MLS
What a GREAT Investment opportunity for an updated 4-plex home! Owned and meticulously maintained for 17 years with the owner residing in one of the units. This property has great curb appeal, making it easy to keep rented by longstanding tenants. Each unit has 2 bedrooms and one full bath with a tub & shower combo, & 855 sq ft under air. All 4 kitchens were remodeled in early 2000's. All units have a large screened lanai with a privacy wall between them. In all 4 units you will find ceiling fans, custom window treatments, washer & dryer, utility room w/ shelving, dishwasher, and disposal. Spacious paved parking lot with 4 carport spaces & 2 uncovered spaces, cement walks to each unit and security lighting in the front and sides of the building. There is a storage shed ($3k in value) in the rear of the property for property maintenance items, including the metal storm shutters for each unit. Located in a quiet neighborhood in SE Cape Coral with easy access to both the Midpoint Bridge and the North bridge, plus this property is close to restaurants, shopping and schools. A great Money Maker where the numbers just work. Three units are tenant occupied & leases date of April 2017.
Key facts
- Screened lanai
- Spacious apartments
- New roof
Tags
Property features AI
Finance
- Other: Oversized lot (approx. 120 x 125 x 120 x 125)
- Financial info: Gross scheduled income: $75,240; Operating expenses: $24,928; Tenants pay cable, electricity, internet, sewer and telephone; Pets allowed
- HOA & community: No association fee; Non-gated community
Exterior
- Utilities: Cable available; Sewer assessment paid; Water assessment paid
- Home design: Single-story property; Resale condition; Zoned RML
- Construction: Block, concrete and stucco construction; Shingle roof
- Exterior features: Automatic sprinklers; Irrigation included in assessment; Outdoor storage
Interior
- Flooring: Tile
- Bathrooms: Four full bathrooms
- Heating & cooling: Central electric heating; Central air conditioning; Ceiling fans
- Interior features: Single-hung windows; Tile flooring
Neighborhood map
What this means for you Summary
Snapshot
- This is a 4 × 2-bed/1.0-bath units multifamily listed at $669k.
Deal economics
- At list price, monthly cash flow is $47 ($565/yr) — positive. Per door: $12/mo.
- The deal already cash-flows at list — no discount required.
- To meet the 1% rule (rent ≥ 1% of price), the offer needs to be $574k (14.2% below list).
- Recommended offer: $574k (14.2% below list) — sets the bar for 1% rule.
- Cap rate 6.4% vs local median 3.1% in Cape Coral — top-decile yield for the area; either an underpriced asset or a hidden risk that comps aren't pricing in. Stress-test before assuming the spread holds.
Location & tenants
- Location reads 77/100 on livability (#208 in FL, #3,098 nationally) — a middle-class / working-renter tenant base. Strengths: housing A+, health & safety A+, amenities B+; Watch: commute F.
- Lee (suburban): math 47% / reading 50% proficiency, ranked #42 of 73 in FL (top 58%) — families likely to look elsewhere, expect single-tenant / working-renter base with shorter leases.
- Market conditions: Rents falling (-7.1%/yr); 467 active listings in the ZIP; 15,411 units permitted in Lee County in 2024 (4,686 in 5+ unit buildings).
- At $5,739/mo this rent would consume 97% of the median local household income ($71k/yr) (locally 1246% of renters already pay >50% of income on rent) — very limited rent-growth headroom before tenants either downsize or default.
Forward outlook
- Local home prices are declining (-3.0%/yr); year-one equity from $5k of loan paydown is wiped out by about $20k of value loss. Plan a longer hold.
- Lee County population projected at +44% by 2050 — long-run rental-demand tailwind backs the buy-and-hold thesis.
Negotiation context
- Only 3 days on market — expect competitive offers; lowballing is unlikely to land.
- 3 sale attempts since 26y ago with the ask held roughly flat each time — persistent listings suggest the price (not the market) is what's stuck; bring a comps-based counter.
- Current owner paid $352k; list at $669k implies a 90% gain — meaningful room to come down on a strong offer.
Risks & watch-outs
- Climate carrying-cost: major flood risk; severe wind risk, 99% chance of damaging wind over 30y; extreme-heat days projected 7→29/yr by 2055 (HVAC capex compounding) — expect insurance premiums to compound above CPI over the hold.
Questions for the listing agent
- Can we see the unit-by-unit rent roll, current vacancy, and any below-market leases? What's the average tenancy length?
- What capital expenditures (roof, boiler, parking lot, exteriors) have been made in the last 5 years, and what's planned in the next 2?
- Is there a deadline driving the sale (1031 exchange, divorce, estate, relocation)? That informs how much negotiation room exists.
- Schools are B-rated — typically a magnet for longer-tenancy family renters. What's the average tenant stay here, and is there a school-zone premium baked into asking?
- The area grade is low — what's the realistic commute time and amenity access for the typical tenant pool here? Any planned neighborhood developments (good or bad) we should know about?
- What's the average days-on-market for RENTAL listings here right now (not sales)? A rising rental-DOM trend means longer vacancies and softer asking-rent achievability than the comps imply.
- What's the recent tenant-quality profile in this submarket — average credit score on applications, eviction rate, late-payment / NSF rate, and stable-employment percentage? A property-management company in the area should have these aggregated.
- How much new apartment / multifamily construction is in the pipeline within 1–3 miles? Heavy new supply (>2% of stock underway) typically softens rents 12–24 months out; light construction supports rent growth.
Investment metrics
- 1% rule
- 0.86% ✗
- Cap rate
- 6.38%
- Cash-on-cash
- 0.30%
- DSCR
- 1.01
- GRM
- 9.7
CMA / ARV
No comps found within radius.
Projected returns pro-forma
-3.0% appreciation · 0.0% rent growth · sell at horizon
- IRR
- -19.1%
- Equity multiple
- 0.35×
- Total profit
- $-122,224
- Equity at exit
- $99,750
- IRR
- -19.3%
- Equity multiple
- 0.11×
- Total profit
- $-167,556
- Equity at exit
- $57,843
Cash invested: $187,320 (down + closing). Projections, not guarantees.
Landlord ↔ Tenant lean methodology
- Overall (STATE)
- 87 Strongly Landlord-Friendly
- State Florida
- 87 Strongly Landlord-Friendly · R+3
- County
- — inherits STATE
- City
- — inherits STATE
ZIP-level market 33990
- Rents YoY
- -7.1%
- Active inventory
- 467
- Price-to-rent
- 38.9×
Monthly cashflow live
- Estimated rent
- $5,739 high interval (Pro) →
- Mortgage (P&I)
- −$3,508
- Tax from tax record
- −$700 /mo · $8,396/yr
- Insurance
- −$279
- HOA
- −$0
- Vacancy / Maint / Mgmt
- −$1,205
- Net cashflow
- $47
Break-even live
4-unit breakdown (identical units grouped — click to expand)
| Units | Beds | Baths | Est. rent |
|---|---|---|---|
| 4× units | 2 | 1 | $5,740 |
| #1 | 2 | 1 | $1,435 |
| #2 | 2 | 1 | $1,435 |
| #3 | 2 | 1 | $1,435 |
| #4 | 2 | 1 | $1,435 |
| Total (4 units) | $5,739 | ||
UW: 25.0% down · 7.5% · 30yr · 1.5% tax · 5.0% vac · 8.0% maint · 8.0% mgmt
Financing live
Cash to close
- Down payment
- $167,250
- Closing costs
- $20,070
- Reserves months
- —
- Total cash needed
- —
Loan-product check · same deal, 3 products live
Conventional
25% down · 7.5% · 30yr
- Down + closing
- —
- Monthly P&I
- —
- Monthly cashflow
- —
- DSCR
- —
- Eligible?
- —
Personal DTI + credit; lowest rate.
DSCR
20% down · 8.5% · 30yr
- Down + closing
- —
- Monthly P&I
- —
- Monthly cashflow
- —
- DSCR
- —
- Eligible?
- —
No personal income docs; deal must DSCR.
Hard money
10% down · 12.0% · 12mo
- Down + closing
- —
- Monthly P&I
- —
- Monthly cashflow
- —
- DSCR
- —
- Eligible?
- —
Short-term bridge; refi at stabilization.
Listing history 5 events
-
2026-06-19status $669,000 Pending 3 DOM
-
2026-06-18days on market $669,000 Active 3 DOM
-
2026-06-17days on market $669,000 Active 2 DOM
-
2026-06-15remarks 683-char remark
-
2026-06-15$669,000 Active 1 DOM
ⓘ Source: listings_history table (triggers on properties + properties_extension) + one-shot
backfill from property_details.listing_events for pre-trigger history.
Tax reassessment forecast FL · Resets to sale price
- Current annual tax
- $8,396 · $700/mo
- Projected year-2 tax
- $8,396 · $700/mo
- Expected delta
- $0/yr ($0/mo · 0.0%)
ⓘ Screening estimate from a state-policy table — verify with the county assessor before closing.
Climate risk First Street
- Flood 6/10 Major FEMA zone X (shaded) · 57% chance over 30 yrs
- Wildfire 1/10 Low
- Heat 10/10 Extreme 7 d/yr ≥106°F today · 29 d/yr by 30 yrs out
- Wind 10/10 Extreme 99% chance of damaging wind over 30 yrs
- Air quality 2/10 Low 1 unhealthy d/yr today · 1 by 30 yrs out
Nearby sold comps map
Loading sold comps map…
Walkable amenities ~0.75 mi
Loading nearby amenities…
Taxation est. · year 1
- Rental income
- $68,868
- − Mortgage interest
- −$37,474
- − Property taxes
- −$8,396
- − Insurance
- −$3,345
- − Repairs & maintenance
- −$5,509
- − Management
- −$5,509
- − Depreciation
- −$19,462
- Taxable loss
- −$10,828
- Est. tax savings @ 24.0%
- +$2,599
- After-tax cash flow
- $3,164/yr
For passive investors: Depreciation is non-cash, so a rental often shows a tax loss while cash-flowing — sheltering income. Rental losses are passive: they offset passive income freely, and up to $25,000/yr can offset ordinary (W-2) income if you actively participate and your MAGI is under $100k (phasing out to $0 by $150k); unused losses carry forward. On sale, claimed depreciation is recaptured at up to 25%, and gains may owe capital-gains tax (a 1031 exchange can defer both). Figures are a year-1 estimate at your 24.0% rate — not tax advice; consult a CPA.
Schools (NCES district)
- District
- Lee
- NCES district ID
- 1201080
- Math proficiency
- 47% ▼ -11.00%
- Reading proficiency
- 50% ▼ -4.00%
- Median HH income
- $49,518
- Composite
- 41.49/100
- National rank
- #3458
- State rank
- #42 of 73 in FL
Livability — Cape Coral
- Score
- 77/100
- State rank
- #208
- US rank
- #3098
Category grades
Schools grade is shown separately in the Schools card above.
Census & demographics
- Census place
- Cape Coral, FL
- County
- Lee County · 788,662 people
- City population
- 217,388
- Metro
- Cape Coral-Fort Myers, FL
- Population (ZIP)
- 34,713
- Household income
- $70,665
- Rent vs Own
- Severe rent burden
- 1246.0
Population outlook (Lee County) Hauer SSP2
- Today (2025)
- 871,946 people
- By 2030
- 955,468 · +9.6%
- By 2040
- 1,113,587 · +27.7%
- By 2050
- 1,256,891 · +44.1%
- By 2075
- 1,560,270 · +78.9%
- By 2100
- 1,726,848 · +98.0%
Race, ethnicity, and origin ACS 2023
- Neighborhood character
- Majority White (64%)
- Race & ethnicity
- White 64% Hispanic / Latino 26% Two or more races 17% Asian 3% Black 3%
- Hispanic origin (detail)
- Mexican 4% Puerto Rican 5% Cuban 8% Dominican 2%
- Common ancestry
- Romanian 3% Lithuanian 3% Italian 3%
- Foreign-born
- 20% · Canada, Jamaica, China
- Languages at home
- 74% English-only · Spanish 20% Other Indo-European 2% Russian/Polish/Slavic 1%
Political lean MEDSL · Lee
- 2024 margin
- Strong R (+28.4) · D 35.5% · R 63.9%
- 2008→2024 swing
- -18.0pp toward R · 2008: -10.4pp · 2024: -28.4pp
- All cycles
- 2024: R+28.4 2020: R+19.2 2016: R+20.4 2012: R+16.6 2008: R+10.4
Not yet ingested
- Civics
- —
Market trends
- HPI YoY
- ▼ -196.42%
- Current HPI
- 289.1969
- Rent YoY
- ▼ -7.11%
- Metro
- Cape Coral-Fort Myers, FL
- State GDP YoY
- ▲ 3.28%
- F500 in state
- 36
Industry mix (Fortune 500 HQ in FL)
| Industry | F500 HQs | Revenue |
|---|---|---|
| Industrial Technology | 2 | $29B |
|
||
| Insurance | 2 | $17B |
|
||
| Retail | 1 | $60B |
|
||
| Technology Distribution | 1 | $58B |
|
||
| Homebuilding | 1 | $35B |
|
||
| Technology Manufacturing | 1 | $35B |
|
||
Price history
+424.7% since first listed10 events — show timeline
- 2026-06-15 Listed $669,000 FORTMLS
- 2017-06-22 Sold (Public Records) $352,000 Public Records
- 2017-06-16 Sold (MLS) $352,000 FORTMLS
- 2017-05-08 Pending — FORTMLS
- 2017-05-06 Listed $365,000 FORTMLS
- 2000-07-06 Sold (Public Records) $110,000 Public Records
- 2000-07-06 Sold (Public Records) $644,285 Public Records
- 2000-07-06 Sold (Public Records) $182,000 Public Records
- 2000-02-23 Listed $193,900 FORTMLS
- 1990-07-26 Sold (Public Records) $127,500 Public Records
Property tax history
+8.7%/yrLatest (2025): $8,396 · -4.3% YoY. Source: county tax records.
Cash-flow waterfall
monthlySold comps — $/sqft
last 12 mo · ≤1 miLoading sold comps…