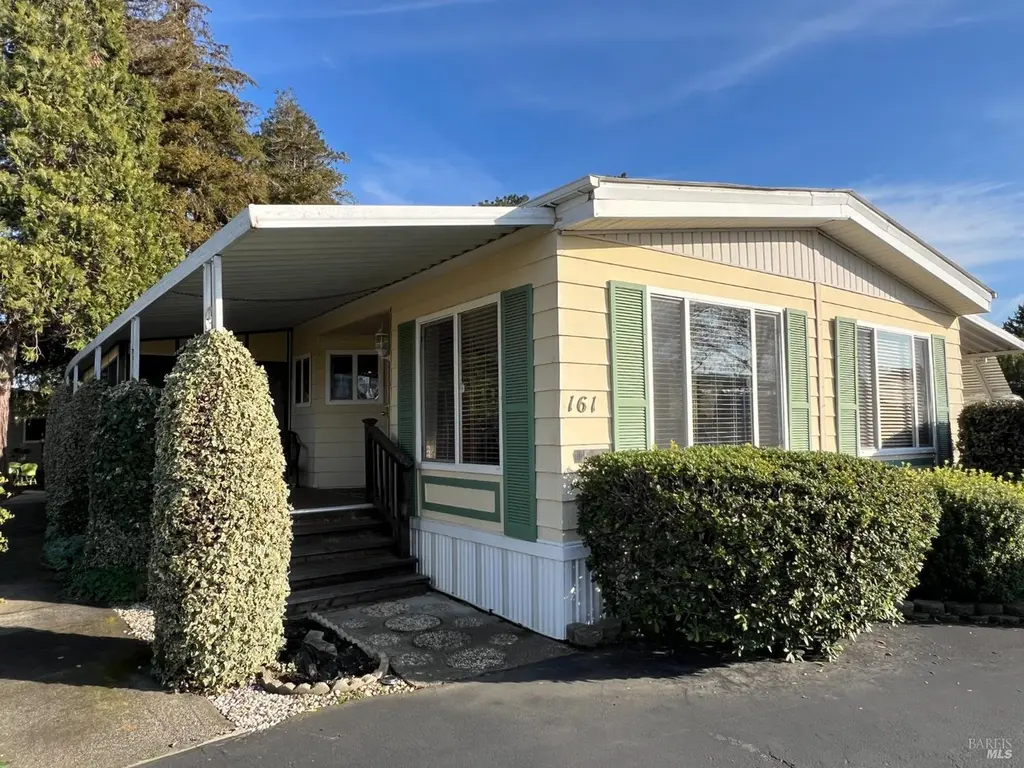
161 Bear Flag Rd · Temelec, CA
Flood risk 1/10 · Minimal
- FEMA flood zone
- X (unshaded)
- Chance of flooding over 30 yrs
- 0.0%
- Est. flood insurance / yr
- $507 – $1,088
Fire risk 5/10 · Moderate
- Est. fire insurance / yr
- $659 – $1,223
Heat risk 4/10 · Minor
- Hot days now (above 94°F)
- 7 days/yr
- Hot days in 30 yrs
- 15 days/yr
Wind risk 1/10 · Minimal
- Chance of severe wind over 30 yrs
- —
Air-quality risk 9/10 · Severe
- Unhealthy air days now
- 19 days/yr
- Unhealthy air days in 30 yrs
- 19 days/yr
Risk factors via First Street. Map © Google.
Why this score? — see what drove the D grade
The composite is a weighted blend of 9 inputs, each scored 0–100. Each bar is that input's sub-score; the figure is the points it added to the 100-point composite (weight × sub-score).
- Cash flow +18.7/30.0
- DSCR +5.9/10.0
- 1% rule +5.0/10.0
- Condition / age +3.8/5.0
- Schools +3.4/10.0
- Livability +2.8/5.0
- Rent growth +2.7/5.0
- ARV discount +0.0/15.0
- Appreciation +0.0/10.0
$325,000
🖨 Deal sheet 📄 Offer letter ✓ Due diligence
Listing remarks MLS
Beautifully upgraded home in the Seven Flags 55+ community of Sonoma, offering vineyard and mountain views and a quiet cul-de-sac location. Attractively landscaped with inviting outdoor spaces. The living/dining room combination offers an open layout with wood laminate flooring and carpet. A separate family room opens to the kitchen, which includes a casual dining counter. The large primary bedroom features an attached bath with separate tub and shower. One porch has been converted into a sunroom (approx. 8' x 15'), providing versatile added indoor space. Seven Flags of Sonoma offers a pool, clubhouse, organized activities, and well-maintained common areas, conveniently located near Sonoma Plaza, shopping, dining, and wine country amenities. Space rent: $967.36.
Key facts
- Vineyard views
- Landscaped
- Cut-de-sac location
Tags
Neighborhood map
What this means for you Summary
Snapshot
- This is a 2-bed/2.0-bath manufactured listed at $325k. Condition is rated good.
Deal economics
- At list price, monthly cash flow is $324 ($4k/yr) — positive.
- The deal already cash-flows at list — no discount required.
- Meets the 1% rule at list price ($3k rent vs $325k).
- Recommended offer: $286k (12.0% below list) — sets the bar for market timing.
Location & tenants
- Location reads 56/100 on livability (#811 in CA) — a working-class tenant base; expect higher turnover. Strengths: crime A+, employment B+, housing B; Watch: health & safety D, amenities F, commute F.
- Sonoma Valley Unified (town): math 27% / reading 42% proficiency, ranked #849 of 1,400 in CA (top 61%) — families likely to look elsewhere, expect single-tenant / working-renter base with shorter leases.
- Market conditions: Rents flat; 263 active listings in the ZIP; solid renter incomes; 1,039 units permitted in Sonoma County in 2024 (185 in 5+ unit buildings).
- This rent runs 37% of the median local income ($105k/yr) — at the standard rent-burdened threshold; future hikes will face affordability resistance.
Forward outlook
- Local home prices are declining (-3.0%/yr); year-one equity from $2k of loan paydown is wiped out by about $10k of value loss. Plan a longer hold.
- Sonoma County population projected at +8% by 2050 — modest demand growth; plan on rents tracking national, not racing it.
Negotiation context
- It's been on market 142 days — a 12% lower offer ($286k) is reasonable based on typical stale-listing flexibility.
Risks & watch-outs
- Climate carrying-cost: moderate wildfire risk — expect insurance premiums to compound above CPI over the hold.
Questions for the listing agent
- It's been on market 142 days. Have you received any prior offers? Is the seller open to a 12% concession, seller financing, or rate buy-down credit?
- Built in 1976 — when were the roof, HVAC, electrical panel, plumbing, and water heater last replaced?
- Why hasn't it sold? Are there any deal-killer items the seller is aware of (foundation, flood, title, zoning, code violations)?
- Is there a deadline driving the sale (1031 exchange, divorce, estate, relocation)? That informs how much negotiation room exists.
- The area grade is low — what's the realistic commute time and amenity access for the typical tenant pool here? Any planned neighborhood developments (good or bad) we should know about?
- What's the average days-on-market for RENTAL listings here right now (not sales)? A rising rental-DOM trend means longer vacancies and softer asking-rent achievability than the comps imply.
- What's the recent tenant-quality profile in this submarket — average credit score on applications, eviction rate, late-payment / NSF rate, and stable-employment percentage? A property-management company in the area should have these aggregated.
- How much new for-sale + rental construction is in the pipeline within 1–3 miles? Heavy new supply typically softens prices + rents 12–24 months out; constrained supply supports both.
Investment metrics
- 1% rule
- 1.00% ✓
- Cap rate
- 7.49%
- Cash-on-cash
- 4.27%
- DSCR
- 1.19
- GRM
- 8.3
CMA / ARV
- ARV (median comp)
- $275,000
- List price
- $325,000
- Delta
- 18.18%
- Verdict
- OVERPRICED
- Comps
- 15 within 1.0 mi
Show comp detail 12 sales within ~0.75 mi
| Address | Dist | Beds/Ba | Sqft | Sold | Price | $/sf | Match |
|---|---|---|---|---|---|---|---|
| 46 International Blvd | 0.05mi | 2/2.0 | 1,440 (0%) | 1mo | $189,000 | $131 | 97 |
| 106 Drake Mews # 106 | 0.18mi | 2/2.0 | 1,440 (0%) | 5mo | $288,000 | $200 | 87 |
| 282 Paseo Bolivar | 0.25mi | 2/2.0 | 1,456 (+1%) | 4mo | $365,000 | $251 | 83 |
| 162 Bear Flag Rd | 0.01mi | 2/2.0 | 1,536 (+7%) | 7mo | $262,000 | $171 | 82 |
| 145 Bear Flag Rd | 0.22mi | 3/2.0 (+1) | 1,536 (+7%) | 2mo | $289,880 | $189 | 72 |
| 14 Fort Ross Way | 0.23mi | 2/2.0 | 1,344 (-7%) | 8mo | $288,000 | $214 | 71 |
| 166 Seven Flags Cir | 0.36mi | 2/2.0 | 1,344 (-7%) | 2mo | $285,000 | $212 | 70 |
| 123 Bear Flag Rd | 0.24mi | 2/2.0 | 1,536 (+7%) | 9mo | $200,000 | $130 | 70 |
| 42 Cabrillo Plz | 0.08mi | 2/2.0 | 1,632 (+13%) | 10mo | $312,000 | $191 | 66 |
| 132 Bear Flag Rd | 0.18mi | 2/3.0 | 1,617 (+12%) | 4mo | $437,750 | $271 | 64 |
| 230 E Seven Flags Cir | 0.30mi | 2/2.0 | 1,580 (+10%) | 9mo | $159,950 | $101 | 63 |
| 258 English Flag Way | 0.33mi | 3/2.0 (+1) | 1,344 (-7%) | 10mo | $278,500 | $207 | 60 |
Match score weights: distance 35% · size 25% · config 20% · recency 20%. Top-matched comps best support the ARV.
Projected returns pro-forma
-3.0% appreciation · 0.79% rent growth · sell at horizon
- IRR
- -12.1%
- Equity multiple
- 0.57×
- Total profit
- $-39,082
- Equity at exit
- $48,459
- IRR
- -6.7%
- Equity multiple
- 0.61×
- Total profit
- $-35,074
- Equity at exit
- $28,100
Cash invested: $91,000 (down + closing). Projections, not guarantees.
Landlord ↔ Tenant lean methodology
- Overall (STATE)
- 18 Strongly Tenant-Friendly
- State California
- 18 Strongly Tenant-Friendly · D+13
- County
- — inherits STATE
- City
- — inherits STATE
ZIP-level market 95476
- Rents YoY
- 0.8%
- Active inventory
- 263
- Price-to-rent
- 8.3×
Monthly cashflow live
- Estimated rent
- $3,253 medium interval (Pro) →
- Mortgage (P&I)
- −$1,704
- Tax est. 1.5%
- −$406 /mo · $4,875/yr
- Insurance
- −$135
- HOA
- −$0
- Vacancy / Maint / Mgmt
- −$683
- Net cashflow
- $324
Break-even live
UW: 25.0% down · 7.5% · 30yr · 1.5% tax · 5.0% vac · 8.0% maint · 8.0% mgmt
Financing live
Cash to close
- Down payment
- $81,250
- Closing costs
- $9,750
- Reserves months
- —
- Total cash needed
- —
Loan-product check · same deal, 3 products live
Conventional
25% down · 7.5% · 30yr
- Down + closing
- —
- Monthly P&I
- —
- Monthly cashflow
- —
- DSCR
- —
- Eligible?
- —
Personal DTI + credit; lowest rate.
DSCR
20% down · 8.5% · 30yr
- Down + closing
- —
- Monthly P&I
- —
- Monthly cashflow
- —
- DSCR
- —
- Eligible?
- —
No personal income docs; deal must DSCR.
Hard money
10% down · 12.0% · 12mo
- Down + closing
- —
- Monthly P&I
- —
- Monthly cashflow
- —
- DSCR
- —
- Eligible?
- —
Short-term bridge; refi at stabilization.
Listing history 19 events
-
2026-06-18days on market $325,000 Active 142 DOM
-
2026-06-17days on market $325,000 Active 141 DOM
-
2026-06-16days on market $325,000 Active 140 DOM
-
2026-06-15price $325,000 Active 139 DOM
-
2026-06-15days on market $339,000 Active 139 DOM
-
2026-06-14days on market $339,000 Active 137 DOM
-
2026-06-13days on market $339,000 Active 136 DOM
-
2026-06-10days on market $339,000 Active 134 DOM
-
2026-06-09days on market $339,000 Active 133 DOM
-
2026-06-08days on market $339,000 Active 132 DOM
-
2026-06-07days on market $339,000 Active 131 DOM
-
2026-06-05days on market $339,000 Active 128 DOM
-
2026-06-03days on market $339,000 Active 127 DOM
-
2026-06-02days on market $339,000 Active 126 DOM
-
2026-06-01days on market $339,000 Active 125 DOM
-
2026-05-31days on market $339,000 Active 124 DOM
-
2026-05-30days on market $339,000 Active 123 DOM
-
2026-03-11price $339,000 784-char remark
Show marketing remark (784 chars)
Beautifully upgraded home in the Seven Flags 55+ community of Sonoma, offering vineyard and mountain views and a quiet cul-de-sac location. Attractively landscaped with inviting outdoor spaces. The living/dining room combination offers an open layout with wood laminate flooring and carpet. A separate family room opens to the kitchen, which includes a casual dining counter. The large primary bedroom features an attached bath with separate tub and shower. One porch has been converted into a sunroom (approx. 8' x 15'), providing versatile added indoor space. Seven Flags of Sonoma offers a pool, clubhouse, organized activities, and well-maintained common areas, conveniently located near Sonoma Plaza, shopping, dining, and wine country amenities. Space rent: $967.36.
-
2026-01-27$349,000 Active 784-char remark
Show marketing remark (784 chars)
Beautifully upgraded home in the Seven Flags 55+ community of Sonoma, offering vineyard and mountain views and a quiet cul-de-sac location. Attractively landscaped with inviting outdoor spaces. The living/dining room combination offers an open layout with wood laminate flooring and carpet. A separate family room opens to the kitchen, which includes a casual dining counter. The large primary bedroom features an attached bath with separate tub and shower. One porch has been converted into a sunroom (approx. 8' x 15'), providing versatile added indoor space. Seven Flags of Sonoma offers a pool, clubhouse, organized activities, and well-maintained common areas, conveniently located near Sonoma Plaza, shopping, dining, and wine country amenities. Space rent: $967.36.
ⓘ Source: listings_history table (triggers on properties + properties_extension) + one-shot
backfill from property_details.listing_events for pre-trigger history.
Climate risk First Street
- Flood 1/10 Low FEMA zone X (unshaded) · 0% chance over 30 yrs
- Wildfire 5/10 Major
- Heat 4/10 Moderate 7 d/yr ≥94°F today · 15 d/yr by 30 yrs out
- Wind 1/10 Low
- Air quality 9/10 Extreme 19 unhealthy d/yr today · 19 by 30 yrs out
Nearby sold comps map
Loading sold comps map…
Walkable amenities ~0.75 mi
Loading nearby amenities…
Taxation est. · year 1
- Rental income
- $39,032
- − Mortgage interest
- −$18,205
- − Property taxes
- −$4,875
- − Insurance
- −$1,625
- − Repairs & maintenance
- −$3,123
- − Management
- −$3,123
- − Depreciation
- −$9,455
- Taxable loss
- −$1,373
- Est. tax savings @ 24.0%
- +$329
- After-tax cash flow
- $4,213/yr
For passive investors: Depreciation is non-cash, so a rental often shows a tax loss while cash-flowing — sheltering income. Rental losses are passive: they offset passive income freely, and up to $25,000/yr can offset ordinary (W-2) income if you actively participate and your MAGI is under $100k (phasing out to $0 by $150k); unused losses carry forward. On sale, claimed depreciation is recaptured at up to 25%, and gains may owe capital-gains tax (a 1031 exchange can defer both). Figures are a year-1 estimate at your 24.0% rate — not tax advice; consult a CPA.
Condition & rehab AI · 12 photos
This manufactured home in Seven Flags 55+ community is in good condition with cosmetic updates needed for a fresh look and increased value.
Value-add opportunities
- Resale Paint exterior siding — Enhances curb appeal and property value
- Rental Clean gutters — Keeps property in good condition and prevents water damage
Renovation cost estimate screening
Value-add ROI direction
- Resale Paint exterior siding — Enhances curb appeal and property value ↑
- Rental Clean gutters — Keeps property in good condition and prevents water damage ↑
ⓘ Cost ranges are severity-bucket heuristics (US national rule-of-thumb). Get contractor quotes + a written scope before underwriting a rehab budget.
Schools (NCES district)
- District
- Sonoma Valley Unified
- NCES district ID
- 0637200
- Math proficiency
- 27% ▼ -1.00%
- Reading proficiency
- 42% ▲ 1.00%
- Median HH income
- $63,880
- Composite
- 33.88/100
- National rank
- #10355
- State rank
- #849 of 1400 in CA
Livability — Temelec
- Score
- 56/100
- State rank
- #811
- US rank
- #22885
Category grades
Schools grade is shown separately in the Schools card above.
Census & demographics
- Census place
- Temelec, CA
- County
- Sonoma County · 449,805 people
- Metro
- Santa Rosa-Petaluma, CA
- Population (ZIP)
- 35,196
- Household income
- $105,374
- Rent vs Own
- Severe rent burden
- 1218.0
Population outlook (Sonoma County) Hauer SSP2
- Today (2025)
- 539,935 people
- By 2030
- 554,870 · +2.8%
- By 2040
- 573,262 · +6.2%
- By 2050
- 580,715 · +7.6%
- By 2075
- 579,229 · +7.3%
- By 2100
- 547,835 · +1.5%
Race, ethnicity, and origin ACS 2023
- Neighborhood character
- Predominantly White (66%)
- Race & ethnicity
- White 66% Hispanic / Latino 28% Two or more races 13% Asian 2% Black 1%
- Hispanic origin (detail)
- Mexican 23%
- Common ancestry
- Italian 5% Lithuanian 4% Portuguese 3%
- Foreign-born
- 16% · Canada, Dominican Republic
- Languages at home
- 75% English-only · Spanish 21% Other Indo-European 1% Other Asian/Pacific 0%
Political lean MEDSL · Sonoma
- 2024 margin
- Solid D (+46.2) · D 71.4% · R 25.2% · Other 3.3%
- 2008→2024 swing
- -3.4pp toward R · 2008: 49.6pp · 2024: 46.2pp
- All cycles
- 2024: D+46.2 2020: D+51.5 2016: D+47.9 2012: D+44.9 2008: D+49.6
Not yet ingested
- Civics
- —
Market trends
- HPI YoY
- ▼ -1116.03%
- Current HPI
- 236.6408
- Rent YoY
- ▲ 0.79%
- Metro
- Santa Rosa-Petaluma, CA
- State GDP YoY
- ▲ 3.21%
- F500 in state
- 116
Industry mix (Fortune 500 HQ in CA)
| Industry | F500 HQs | Revenue |
|---|---|---|
| Technology | 27 | $1,492B |
|
||
| Financial Services | 3 | $174B |
|
||
| Retail | 3 | $44B |
|
||
| Insurance | 3 | $26B |
|
||
| Media / Entertainment | 2 | $115B |
|
||
| Pharmaceuticals / Biotech | 2 | $62B |
|
||
Price history
-2.9% since first listed2 events — show timeline
- 2026-03-11 Price Changed $339,000 BAREIS
- 2026-01-27 Listed $349,000 BAREIS
Cash-flow waterfall
monthlySold comps — $/sqft
last 12 mo · ≤1 miLoading sold comps…