 🏗️ New Construction
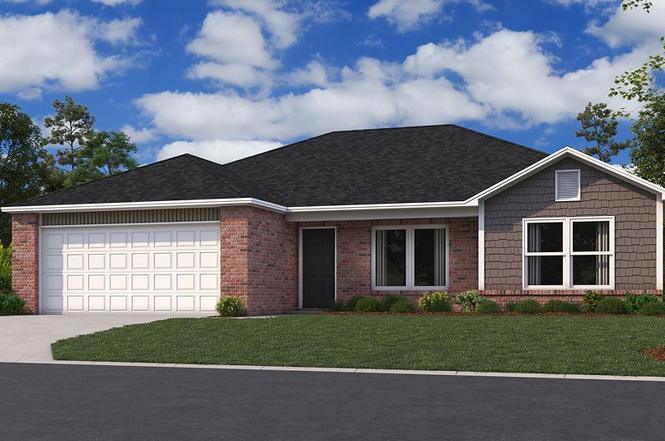
Rc Clark Plan · Broken Arrow, OK
Flood risk No data
- FEMA flood zone
- —
- Chance of flooding over 30 yrs
- —
- Est. flood insurance / yr
- —
Fire risk No data
- Est. fire insurance / yr
- —
Heat risk No data
- Hot days now (above threshold)
- —
- Hot days in 30 yrs
- —
Wind risk No data
- Chance of severe wind over 30 yrs
- —
Air-quality risk No data
- Unhealthy air days now
- —
- Unhealthy air days in 30 yrs
- —
Risk factors via First Street. Map © Google.
Why this score? — see what drove the D grade
The composite is a weighted blend of 9 inputs, each scored 0–100. Each bar is that input's sub-score; the figure is the points it added to the 100-point composite (weight × sub-score).
- Cash flow +14.6/30.0
- ARV discount +7.5/15.0
- DSCR +4.4/10.0
- 1% rule +4.0/10.0
- Livability +3.9/5.0
- Rent growth +3.5/5.0
- Condition / age +2.5/5.0
- Schools +2.4/10.0
- Appreciation +0.0/10.0
$258,000
🖨 Deal sheet 📄 Offer letter ✓ Due diligence
Key facts
- 2 garage spots
- Listed 250 days
Property features AI
Finance
- Other: Listing status: Active
- Financial info: List price $258000
Exterior
- Parking: 2 garage spaces; 2 total parking spaces
- Home design: Plan: Rc Clark; New construction inventory type: Plan
- Exterior features: Located at 7005 S Maple Ave, Broken Arrow, OK 74011
Interior
- Bedrooms: 3 bedrooms
- Bathrooms: 2 full bathrooms
- Interior features: Living area of 1422
Neighborhood map
What this means for you Summary
Snapshot
- This is a 3-bed/2.0-bath single-family listed at $258k.
Deal economics
- At list price, monthly cash flow is $59 ($705/yr) — positive.
- The deal already cash-flows at list — no discount required.
- To meet the 1% rule (rent ≥ 1% of price), the offer needs to be $226k (12.3% below list).
- Recommended offer: $226k (12.3% below list) — sets the bar for 1% rule.
- Cap rate 6.6% vs local median 4.0% in Broken Arrow — top-decile yield for the area; either an underpriced asset or a hidden risk that comps aren't pricing in. Stress-test before assuming the spread holds.
Location & tenants
- Location reads 78/100 on livability (#7 in OK, #2,691 nationally) — a middle-class / working-renter tenant base. Strengths: commute A+, cost of living A+, housing A+; Watch: schools D+, amenities F.
- Broken Arrow (suburban): math 23% / reading 28% proficiency, ranked #79 of 270 in OK (top 29%) — low school quality limits family demand, transient renter base, plan for 1-2y turnover.
- Market conditions: Rents rising fast (+4.1%/yr); 381 active listings in the ZIP; 8 comparable units currently listed for rent nearby; rentals leasing fast (median 3d on market — plan ~1-2 weeks tenant-placement turnaround); solid renter incomes; 2,818 units permitted in Tulsa County in 2024 (518 in 5+ unit buildings).
Forward outlook
- Local home prices are declining (-3.0%/yr); year-one equity from $2k of loan paydown is wiped out by about $8k of value loss. Plan a longer hold.
- Tulsa County population projected at +30% by 2050 — long-run rental-demand tailwind backs the buy-and-hold thesis.
Negotiation context
- It's been on market 250 days — a 12% lower offer ($227k) is reasonable based on typical stale-listing flexibility.
Questions for the listing agent
- It's been on market 250 days. Have you received any prior offers? Is the seller open to a 12% concession, seller financing, or rate buy-down credit?
- Why hasn't it sold? Are there any deal-killer items the seller is aware of (foundation, flood, title, zoning, code violations)?
- Is there a deadline driving the sale (1031 exchange, divorce, estate, relocation)? That informs how much negotiation room exists.
- Schools are D-rated, which usually means shorter tenancies and higher turnover. Who's the typical renter profile here, and what's been the actual vacancy rate?
- The area grade is low — what's the realistic commute time and amenity access for the typical tenant pool here? Any planned neighborhood developments (good or bad) we should know about?
- What's the average days-on-market for RENTAL listings here right now (not sales)? A rising rental-DOM trend means longer vacancies and softer asking-rent achievability than the comps imply.
- What's the recent tenant-quality profile in this submarket — average credit score on applications, eviction rate, late-payment / NSF rate, and stable-employment percentage? A property-management company in the area should have these aggregated.
- How much new for-sale + rental construction is in the pipeline within 1–3 miles? Heavy new supply typically softens prices + rents 12–24 months out; constrained supply supports both.
Investment metrics
- 1% rule
- 0.90% ✗
- Cap rate
- 6.57%
- Cash-on-cash
- 1.01%
- DSCR
- 1.04
- GRM
- 9.2
CMA / ARV
- ARV (on-the-fly)
- $250,272
- Comps found
- 12
Show comp detail 12 sales within ~0.75 mi
| Address | Dist | Beds/Ba | Sqft | Sold | Price | $/sf | Match |
|---|---|---|---|---|---|---|---|
| 7121 S Maple Ave | 0.00mi | 3/2.0 | 1,422 (0%) | 2mo | $267,200 | $188 | 99 |
| 7105 S Maple Ave | 0.00mi | 3/2.0 | 1,422 (0%) | 4mo | $267,200 | $188 | 97 |
| 7600 S Maple Ave | 0.07mi | 3/2.0 | 1,414 (-1%) | 3mo | $185,000 | $131 | 94 |
| 7208 S Lions Ave | 0.06mi | 3/2.0 | 1,446 (+2%) | 2mo | $277,144 | $192 | 93 |
| 7508 S Lions Ave | 0.06mi | 3/2.0 | 1,252 (-12%) | 2mo | $185,000 | $148 | 76 |
| 7025 S Maple Ave | 0.00mi | 3/2.0 | 1,633 (+15%) | 1mo | $288,175 | $176 | 74 |
| 7204 S Lions Ave | 0.06mi | 3/2.0 | 1,633 (+15%) | 1mo | $284,050 | $174 | 72 |
| 7205 S Maple Ave | 0.00mi | 4/2.0 (+1) | 1,615 (+14%) | 1mo | $281,107 | $174 | 72 |
| 7017 S Maple Ave | 0.00mi | 4/2.0 (+1) | 1,613 (+13%) | 3mo | $285,775 | $177 | 70 |
| 7020 S Maple Ave | 0.00mi | 4/2.0 (+1) | 1,615 (+14%) | 4mo | $282,107 | $175 | 69 |
| 7606 Glenwood Cir | 0.41mi | 3/2.0 | 1,634 (+15%) | 2mo | $245,000 | $150 | 54 |
| 7505 S Walnut Ave | 0.49mi | 3/2.0 | 1,606 (+13%) | 4mo | $285,000 | $177 | 53 |
Match score weights: distance 35% · size 25% · config 20% · recency 20%. Top-matched comps best support the ARV.
Projected returns pro-forma
-3.0% appreciation · 4.09% rent growth · sell at horizon
- IRR
- -13.5%
- Equity multiple
- 0.51×
- Total profit
- $-34,270
- Equity at exit
- $37,316
- IRR
- -2.9%
- Equity multiple
- 0.80×
- Total profit
- $-14,357
- Equity at exit
- $21,639
Cash invested: $70,076 (down + closing). Projections, not guarantees.
Landlord ↔ Tenant lean methodology
- Overall (STATE)
- 83 Strongly Landlord-Friendly
- State Oklahoma
- 83 Strongly Landlord-Friendly · R+20
- County
- — inherits STATE
- City
- — inherits STATE
ZIP-level market 74011
- Rents YoY
- 4.1%
- Active inventory
- 381
- Price-to-rent
- 9.5×
Monthly cashflow live
- Estimated rent
- $2,264 high interval (Pro) →
- Mortgage (P&I)
- −$1,312
- Tax est. 1.5%
- −$313 /mo · $3,754/yr
- Insurance
- −$104
- HOA
- −$0
- Vacancy / Maint / Mgmt
- −$475
- Net cashflow
- $59
Break-even live
UW: 25.0% down · 7.5% · 30yr · 1.5% tax · 5.0% vac · 8.0% maint · 8.0% mgmt
Financing live
Cash to close
- Down payment
- $62,568
- Closing costs
- $7,508
- Reserves months
- —
- Total cash needed
- —
Loan-product check · same deal, 3 products live
Conventional
25% down · 7.5% · 30yr
- Down + closing
- —
- Monthly P&I
- —
- Monthly cashflow
- —
- DSCR
- —
- Eligible?
- —
Personal DTI + credit; lowest rate.
DSCR
20% down · 8.5% · 30yr
- Down + closing
- —
- Monthly P&I
- —
- Monthly cashflow
- —
- DSCR
- —
- Eligible?
- —
No personal income docs; deal must DSCR.
Hard money
10% down · 12.0% · 12mo
- Down + closing
- —
- Monthly P&I
- —
- Monthly cashflow
- —
- DSCR
- —
- Eligible?
- —
Short-term bridge; refi at stabilization.
Rent comps 8 comps
| Address | Beds | Baths | Sqft | Rent | $/sqft | DOM | Units | Dist |
|---|---|---|---|---|---|---|---|---|
| 7313 S Walnut Ave Broken Arrow, OK | 3.0 | 2.0 | 1600 | $1,990 | $1.24 | 10d | 1 | 0.45mi |
| 2008 W Huntsville Pl Broken Arrow, OK | 3.0 | 2.0 | 1568 | $2,100 | $1.34 | 3d | 1 | 0.56mi |
| 2420 W Imperial Ct Broken Arrow, OK | 3.0 | 2.0 | 1726 | $2,415 | $1.40 | 1d | 1 | 0.84mi |
| 2421 W Imperial Ct Broken Arrow, OK | 3.0 | 2.0 | 1726 | $2,415 | $1.40 | 1d | 1 | 0.85mi |
| 2430 W Imperial Ct Broken Arrow, OK | 3.0 | 2.0 | 1726 | $2,415 | $1.40 | 1d | 1 | 0.85mi |
| 2602 W Tucson St Broken Arrow, OK | 1.0–2.0 | 1.0–2.5 | 1028 | $1,884 | $1.83 | 1d | 19 | 1.12mi |
| 6308 S 1st Pl Broken Arrow, OK | 3.0 | 2.0 | 1600 | $3,400 | $2.12 | 16d | 1 | 1.12mi |
| 7211 S Laurel Pl Broken Arrow, OK | 4.0 | 2.0 | 1851 | $2,200 | $1.19 | 3d | 1 | 1.33mi |
Listing history 14 events
-
2026-06-18days on market $258,000 Active 250 DOM
-
2026-06-17days on market $258,000 Active 249 DOM
-
2026-06-16days on market $258,000 Active 248 DOM
-
2026-06-15days on market $258,000 Active 247 DOM
-
2026-06-13days on market $258,000 Active 245 DOM
-
2026-06-10days on market $258,000 Active 242 DOM
-
2026-06-09days on market $258,000 Active 241 DOM
-
2026-06-08days on market $258,000 Active 240 DOM
-
2026-06-07days on market $258,000 Active 239 DOM
-
2026-06-05days on market $258,000 Active 236 DOM
-
2026-06-03days on market $258,000 Active 235 DOM
-
2026-06-02days on market $258,000 Active 234 DOM
-
2026-06-01days on market $258,000 Active 233 DOM
-
2026-05-31days on market $258,000 Active 232 DOM
ⓘ Source: listings_history table (triggers on properties + properties_extension) + one-shot
backfill from property_details.listing_events for pre-trigger history.
Nearby sold comps map
Loading sold comps map…
Walkable amenities ~0.75 mi
Loading nearby amenities…
Taxation est. · year 1
- Rental income
- $27,164
- − Mortgage interest
- −$14,019
- − Property taxes
- −$3,754
- − Insurance
- −$1,251
- − Repairs & maintenance
- −$2,173
- − Management
- −$2,173
- − Depreciation
- −$7,281
- Taxable loss
- −$3,487
- Est. tax savings @ 24.0%
- +$837
- After-tax cash flow
- $1,542/yr
For passive investors: Depreciation is non-cash, so a rental often shows a tax loss while cash-flowing — sheltering income. Rental losses are passive: they offset passive income freely, and up to $25,000/yr can offset ordinary (W-2) income if you actively participate and your MAGI is under $100k (phasing out to $0 by $150k); unused losses carry forward. On sale, claimed depreciation is recaptured at up to 25%, and gains may owe capital-gains tax (a 1031 exchange can defer both). Figures are a year-1 estimate at your 24.0% rate — not tax advice; consult a CPA.
Schools (NCES district)
- District
- Broken Arrow
- NCES district ID
- 4005490
- Math proficiency
- 23% ▼ -9.00%
- Reading proficiency
- 28% ▼ -9.00%
- Median HH income
- $64,646
- Composite
- 23.86/100
- National rank
- #7801
- State rank
- #79 of 270 in OK
Livability — Broken Arrow
- Score
- 78/100
- State rank
- #7
- US rank
- #2691
Category grades
Schools grade is shown separately in the Schools card above.
Census & demographics
- Census place
- Broken Arrow, OK
- County
- Tulsa County · 640,811 people
- City population
- 144,172
- Metro
- Tulsa, OK
- Population (ZIP)
- 33,900
- Household income
- $99,157
- Rent vs Own
- Severe rent burden
- 389.0
Population outlook (Tulsa County) Hauer SSP2
- Today (2025)
- 723,846 people
- By 2030
- 766,033 · +5.8%
- By 2040
- 851,386 · +17.6%
- By 2050
- 938,389 · +29.6%
- By 2075
- 1,166,011 · +61.1%
- By 2100
- 1,350,277 · +86.5%
Race, ethnicity, and origin ACS 2023
- Neighborhood character
- Predominantly White (68%)
- Race & ethnicity
- White 68% Two or more races 15% Hispanic / Latino 10% Native American 4% Black 4% Asian 3%
- Hispanic origin (detail)
- Mexican 7%
- Common ancestry
- Lithuanian 3% Serbian 2% Slovak 2%
- Foreign-born
- 5% · Canada
- Languages at home
- 93% English-only · Spanish 5% Other Asian/Pacific 1%
Political lean MEDSL · Tulsa
- 2024 margin
- R (+15.2) · D 41.3% · R 56.5% · Other 2.2%
- 2008→2024 swing
- +9.2pp toward D · 2008: -24.5pp · 2024: -15.2pp
- All cycles
- 2024: R+15.2 2020: R+15.6 2016: R+22.9 2012: R+27.4 2008: R+24.5
Not yet ingested
- Civics
- —
Market trends
- HPI YoY
- ▼ -180.15%
- Current HPI
- 210.8302
- Rent YoY
- ▲ 4.09%
- Metro
- Tulsa, OK
- State GDP YoY
- ▲ 1.55%
- F500 in state
- 6
Industry mix (Fortune 500 HQ in OK)
| Industry | F500 HQs | Revenue |
|---|---|---|
| Energy | 3 | $48B |
|
||
Cash-flow waterfall
monthlySold comps — $/sqft
last 12 mo · ≤1 miLoading sold comps…