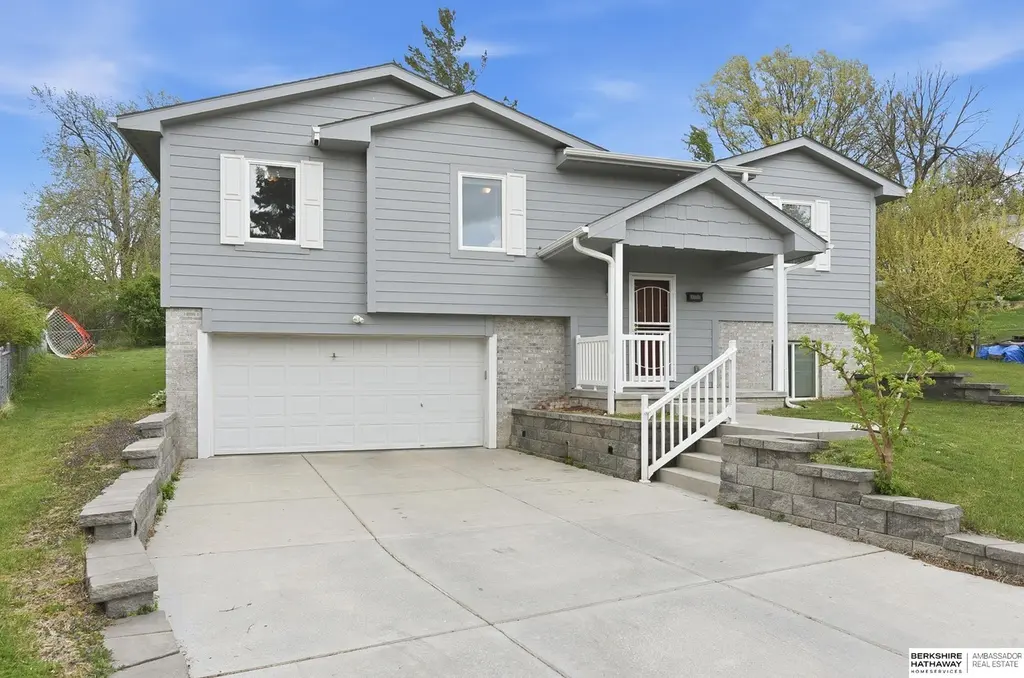
13956 Hickory Cir · Omaha, NE
Flood risk 1/10 · Minimal
- FEMA flood zone
- X (unshaded)
- Chance of flooding over 30 yrs
- 0.0%
- Est. flood insurance / yr
- $473 – $860
Fire risk 1/10 · Minimal
- Est. fire insurance / yr
- $1,161 – $2,155
Heat risk 3/10 · Minor
- Hot days now (above 102°F)
- 7 days/yr
- Hot days in 30 yrs
- 16 days/yr
Wind risk 2/10 · Minimal
- Chance of severe wind over 30 yrs
- —
Air-quality risk 2/10 · Minimal
- Unhealthy air days now
- 1 days/yr
- Unhealthy air days in 30 yrs
- 1 days/yr
Risk factors via First Street. Map © Google.
Why this score? — see what drove the D- grade
The composite is a weighted blend of 9 inputs, each scored 0–100. Each bar is that input's sub-score; the figure is the points it added to the 100-point composite (weight × sub-score).
- ARV discount +13.6/15.0
- Cash flow +6.0/30.0
- Schools +5.3/10.0
- Livability +4.2/5.0
- Rent growth +3.0/5.0
- Condition / age +2.5/5.0
- 1% rule +1.3/10.0
- DSCR +0.3/10.0
- Appreciation +0.0/10.0
$295,000
🖨 Deal sheet 📄 Offer letter ✓ Due diligence
Listing remarks
Pending Contract -Welcome to this beautiful split-level home, perfectly situated in a quiet cul-de-sac within a highly desirable neighborhood. The main level features three specious bedrooms, a full bathroom, a bright living room, a dining area and kitchen. The finished basement offers two additional bedrooms and a full bathroom, providing plenty of space for a growing or large family. With rooms for everyone, this home is must-see. Schedule your showing today before it's gone!
Key facts
- 1,002 sq ft lot
- 2 garage spots
- Built 2018
Property features AI
Exterior
- Parking: Attached 2-car garage; Two covered parking spaces
- Utilities: Public water; Public sewer; Electricity available on property; Natural gas available
- Home design: Single-family residence; Split-entry design; Not new (built in 2018)
- Construction: Wood siding and brick exterior; Asbestos siding/roof components noted; Composition and asbestos shingle roof; Concrete perimeter foundation; Built in 2018
- Exterior features: Patio; Chain link fencing; City lot in a cul-de-sac with public sidewalk
Interior
- Kitchen: Oven; Dishwasher; Garbage disposal; Microwave
- Bedrooms: Master bedroom on main floor; Additional bedrooms on main floor; Bedrooms in finished basement
- Flooring: Carpet; Luxury vinyl plank
- Bathrooms: Two full bathrooms; One main-level bathroom
- Heating & cooling: Forced air heating (electric and natural gas); Central air conditioning
- Interior features: Central vacuum
- Laundry & utility: Finished basement utility space
Neighborhood map
What this means for you Summary
Snapshot
- This is a 3-bed/2.0-bath other listed at $295k.
Deal economics
- At list price, monthly cash flow is $-569 ($-7k/yr) — negative.
- To cash-flow at today's rent, offer at most $194k (34.1% below list).
- To meet the 1% rule (rent ≥ 1% of price), the offer needs to be $186k (37.0% below list).
- Recommended offer: $186k (37.0% below list) — sets the bar for 1% rule.
Location & tenants
- Location reads 84/100 on livability (#7 in NE, #663 nationally) — a professional / high-income tenant draw. Strengths: amenities A+, commute A+, cost of living A+; Watch: crime F.
- Millard Public Schools (urban): math 58% / reading 60% proficiency, ranked #13 of 111 in NE (top 12%) — acceptable for families but not a draw, mixed tenant base, ~2y average lease; only 13% free/reduced lunch — higher-income household profile.
- Zoned schools: Montclair Elementary School (math 48% / reading 56%, grade C-, #200 of 502 statewide, top 46%, 592 students, 30% FRL); Millard North Middle School (math 51% / reading 57%, grade B-, #38 of 128 statewide, top 31%, 790 students, 29% FRL); Millard North High School (math 61% / reading 66%, grade B-, #37 of 261 statewide, top 14%, 2,573 students, 22% FRL).
- Market conditions: Rents rising (+1.9%/yr); 110 active listings in the ZIP; 6 comparable units currently listed for rent nearby; rentals leasing fast (median 3d on market — plan ~1-2 weeks tenant-placement turnaround); solid renter incomes; 4,539 units permitted in Douglas County in 2024 (2,583 in 5+ unit buildings).
Forward outlook
- Local home prices are declining (-3.0%/yr); year-one equity from $2k of loan paydown is wiped out by about $9k of value loss. Plan a longer hold.
- Douglas County population projected at +28% by 2050 — long-run rental-demand tailwind backs the buy-and-hold thesis.
Negotiation context
- It's been on market 20 days — a 2% lower offer ($291k) is reasonable based on typical stale-listing flexibility.
Questions for the listing agent
- What do current leases actually rent for vs. the listed asking? Can we see a recent rent roll and the last 12 months of T-12 income?
- Is there a deadline driving the sale (1031 exchange, divorce, estate, relocation)? That informs how much negotiation room exists.
- Crime grade is F in this area — have there been break-ins, vandalism, or insurance claims at this property in the last 3 years? What carrier currently insures it and at what premium?
- The area grade is low — what's the realistic commute time and amenity access for the typical tenant pool here? Any planned neighborhood developments (good or bad) we should know about?
- What's the average days-on-market for RENTAL listings here right now (not sales)? A rising rental-DOM trend means longer vacancies and softer asking-rent achievability than the comps imply.
- What's the recent tenant-quality profile in this submarket — average credit score on applications, eviction rate, late-payment / NSF rate, and stable-employment percentage? A property-management company in the area should have these aggregated.
- How much new for-sale + rental construction is in the pipeline within 1–3 miles? Heavy new supply typically softens prices + rents 12–24 months out; constrained supply supports both.
Investment metrics
- 1% rule
- 0.63% ✗
- Cap rate
- 3.98%
- Cash-on-cash
- -8.27%
- DSCR
- 0.63
- GRM
- 13.2
CMA / ARV
- ARV (median comp)
- $341,358
- List price
- $295,000
- Delta
- -13.58%
- Verdict
- UNDERPRICED
- Comps
- 20 within 1.0 mi
Projected returns pro-forma
-3.0% appreciation · 1.95% rent growth · sell at horizon
- IRR
- -32.0%
- Equity multiple
- -0.04×
- Total profit
- $-85,975
- Equity at exit
- $43,985
- IRR
- -42.9%
- Equity multiple
- -0.56×
- Total profit
- $-129,249
- Equity at exit
- $25,506
Cash invested: $82,600 (down + closing). Projections, not guarantees.
Landlord ↔ Tenant lean methodology
- Overall (STATE)
- 83 Strongly Landlord-Friendly
- State Nebraska
- 83 Strongly Landlord-Friendly · R+13
- County
- — inherits STATE
- City
- — inherits STATE
ZIP-level market 68144
- Rents YoY
- 1.9%
- Active inventory
- 110
- Price-to-rent
- 13.2×
Monthly cashflow live
- Estimated rent
- $1,859 high interval (Pro) →
- Mortgage (P&I)
- −$1,547
- Tax from tax record
- −$368 /mo · $4,419/yr
- Insurance
- −$123
- HOA
- −$0
- Vacancy / Maint / Mgmt
- −$390
- Net cashflow
- $-569
Break-even live
UW: 25.0% down · 7.5% · 30yr · 1.5% tax · 5.0% vac · 8.0% maint · 8.0% mgmt
Financing live
Cash to close
- Down payment
- $73,750
- Closing costs
- $8,850
- Reserves months
- —
- Total cash needed
- —
Loan-product check · same deal, 3 products live
Conventional
25% down · 7.5% · 30yr
- Down + closing
- —
- Monthly P&I
- —
- Monthly cashflow
- —
- DSCR
- —
- Eligible?
- —
Personal DTI + credit; lowest rate.
DSCR
20% down · 8.5% · 30yr
- Down + closing
- —
- Monthly P&I
- —
- Monthly cashflow
- —
- DSCR
- —
- Eligible?
- —
No personal income docs; deal must DSCR.
Hard money
10% down · 12.0% · 12mo
- Down + closing
- —
- Monthly P&I
- —
- Monthly cashflow
- —
- DSCR
- —
- Eligible?
- —
Short-term bridge; refi at stabilization.
Rent comps 6 comps
| Address | Beds | Baths | Sqft | Rent | $/sqft | DOM | Units | Dist |
|---|---|---|---|---|---|---|---|---|
| 13407 Montclair Dr Omaha, NE | 1.0–2.0 | 1.0 | 865 | $1,003 | $1.16 | 3d | 2 | 0.62mi |
| 13110 Sterling Ridge Dr Omaha, NE | 1.0–2.0 | 1.0–2.0 | 894 | $4,048 | $4.53 | 2d | 21 | 0.77mi |
| 2219 S 148th Ave Omaha, NE | 4.0 | 2.5 | 2106 | $2,600 | $1.23 | 43d | 1 | 0.80mi |
| 3820 S 148th Ave Omaha, NE | 1.0–3.0 | 1.0–2.0 | 1029 | $2,195 | $2.13 | 3d | 20 | 1.06mi |
| 13615 Spring St Omaha, NE | 4.0 | 2.0 | 1500 | $2,050 | $1.37 | 19d | 1 | 1.07mi |
| 3307 S 133rd St Omaha, NE | 3.0 | 2.0 | 1668 | $1,950 | $1.17 | 2d | 1 | 1.18mi |
Listing history 5 events
-
2026-05-14status Pending 482-char remark
-
2026-05-13price $295,000 482-char remark
-
2026-05-07price $315,000 482-char remark
-
2026-05-01price $329,500 482-char remark
-
2026-04-24$340,000 New 482-char remark
ⓘ Source: listings_history table (triggers on properties + properties_extension) + one-shot
backfill from property_details.listing_events for pre-trigger history.
Tax reassessment forecast NE · Resets to sale price
- Current annual tax
- $4,419 · $368/mo
- Projected year-2 tax
- $5,104 · $425/mo
- Expected delta
- +$684/yr (+$57/mo · 15.5%)
ⓘ Screening estimate from a state-policy table — verify with the county assessor before closing.
Climate risk First Street
- Flood 1/10 Low FEMA zone X (unshaded) · 0% chance over 30 yrs
- Wildfire 1/10 Low
- Heat 3/10 Moderate 7 d/yr ≥102°F today · 16 d/yr by 30 yrs out
- Wind 2/10 Low
- Air quality 2/10 Low 1 unhealthy d/yr today · 1 by 30 yrs out
Nearby sold comps map
Loading sold comps map…
Walkable amenities ~0.75 mi
Loading nearby amenities…
Taxation est. · year 1
- Rental income
- $22,313
- − Mortgage interest
- −$16,525
- − Property taxes
- −$4,419
- − Insurance
- −$1,475
- − Repairs & maintenance
- −$1,785
- − Management
- −$1,785
- − Depreciation
- −$8,582
- Taxable loss
- −$12,258
- Est. tax savings @ 24.0%
- +$2,942
- After-tax cash flow
- $-3,889/yr
For passive investors: Depreciation is non-cash, so a rental often shows a tax loss while cash-flowing — sheltering income. Rental losses are passive: they offset passive income freely, and up to $25,000/yr can offset ordinary (W-2) income if you actively participate and your MAGI is under $100k (phasing out to $0 by $150k); unused losses carry forward. On sale, claimed depreciation is recaptured at up to 25%, and gains may owe capital-gains tax (a 1031 exchange can defer both). Figures are a year-1 estimate at your 24.0% rate — not tax advice; consult a CPA.
Schools (NCES district)
- District
- Millard Public Schools
- NCES district ID
- 3173740
- Math proficiency
- 58% ▼ -7.00%
- Reading proficiency
- 60% ▼ -6.00%
- Median HH income
- $81,146
- Composite
- 53.23/100
- National rank
- #1500
- State rank
- #13 of 111 in NE
Livability — Omaha
- Score
- 84/100
- State rank
- #7
- US rank
- #663
Category grades
Schools grade is shown separately in the Schools card above.
Census & demographics
- Census place
- Omaha, NE
- County
- Douglas County · 538,646 people
- City population
- 552,986
- Metro
- Omaha-Council Bluffs, NE-IA
- Population (ZIP)
- 25,732
- Household income
- $83,576
- Rent vs Own
- Severe rent burden
- 1113.0
Population outlook (Douglas County) Hauer SSP2
- Today (2025)
- 625,245 people
- By 2030
- 661,613 · +5.8%
- By 2040
- 732,395 · +17.1%
- By 2050
- 801,988 · +28.3%
- By 2075
- 968,637 · +54.9%
- By 2100
- 1,101,871 · +76.2%
Race, ethnicity, and origin ACS 2023
- Neighborhood character
- Predominantly White (84%)
- Race & ethnicity
- White 84% Hispanic / Latino 7% Two or more races 6% Black 3% Asian 2%
- Hispanic origin (detail)
- Mexican 4%
- Common ancestry
- Romanian 4% Slovak 4% Portuguese 2%
- Foreign-born
- 5% · Canada, United Kingdom, South Korea
- Languages at home
- 92% English-only · Spanish 3% Arabic 1% Other Indo-European 1%
Political lean MEDSL · Douglas
- 2024 margin
- D (+10.2) · D 54.4% · R 44.2% · Other 1.4%
- 2008→2024 swing
- +5.5pp toward D · 2008: 4.6pp · 2024: 10.2pp
- All cycles
- 2024: D+10.2 2020: D+11.3 2016: D+1.4 2012: R+4.3 2008: D+4.6
Not yet ingested
- Civics
- —
Market trends
- HPI YoY
- ▼ -228.19%
- Current HPI
- 249.064
- Rent YoY
- ▲ 1.95%
- Metro
- Omaha-Council Bluffs, NE-IA
- State GDP YoY
- ▲ 0.68%
- F500 in state
- 2
Industry mix (Fortune 500 HQ in NE)
| Industry | F500 HQs | Revenue |
|---|---|---|
| Conglomerate | 1 | $371B |
|
||
Price history
-16.2% since first listed6 events — show timeline
- 2026-06-10 Sold (MLS) $285,000 GPRMLS
- 2026-05-14 Pending — GPRMLS
- 2026-05-13 Price Changed $295,000 GPRMLS
- 2026-05-07 Price Changed $315,000 GPRMLS
- 2026-05-01 Price Changed $329,500 GPRMLS
- 2026-04-24 Listed $340,000 GPRMLS
Property tax history
+30.6%/yrLatest (2025): $4,419 · +16.4% YoY. Source: county tax records.
Cash-flow waterfall
monthlySold comps — $/sqft
last 12 mo · ≤1 miLoading sold comps…