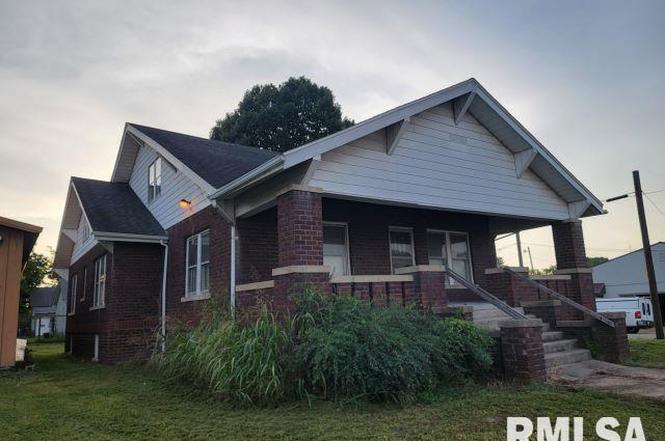
101 S 6th St · Murphysboro, IL
Flood risk 1/10 · Minimal
- FEMA flood zone
- X (unshaded)
- Chance of flooding over 30 yrs
- 0.0%
- Est. flood insurance / yr
- $507 – $1,088
Fire risk 1/10 · Minimal
- Est. fire insurance / yr
- $804 – $1,492
Heat risk 5/10 · Moderate
- Hot days now (above 107°F)
- 7 days/yr
- Hot days in 30 yrs
- 21 days/yr
Wind risk 2/10 · Minimal
- Chance of severe wind over 30 yrs
- 2.0%
Air-quality risk 1/10 · Minimal
- Unhealthy air days now
- 0 days/yr
- Unhealthy air days in 30 yrs
- 0 days/yr
Risk factors via First Street. Map © Google.
Why this score? — see what drove the B- grade
The composite is a weighted blend of 9 inputs, each scored 0–100. Each bar is that input's sub-score; the figure is the points it added to the 100-point composite (weight × sub-score).
- Cash flow +30.0/30.0
- 1% rule +10.0/10.0
- DSCR +10.0/10.0
- ARV discount +7.5/15.0
- Livability +2.7/5.0
- Rent growth +2.5/5.0
- Condition / age +2.5/5.0
- Schools +0.8/10.0
- Appreciation +0.0/10.0
$52,500
🖨 Deal sheet 📄 Offer letter ✓ Due diligence
Listing remarks
DIAMOND IN THE ROUGH! Calling all the DIY'ers and house flippers. This all brick house has great bones for it's age. It hasn't had a lot of updates made over the years but it is a well built house. The roof has been replaced within the last 10 years. All of the rooms are spacious and several rooms have the old house charm. Most of the main level has the original hardwood floors. And they are in excellent shape! The fireplace and built-in cabinets are beautiful. There are several stain glassed windows as well. All of the rooms have some plaster cracks, so those will need fixed along with an interior paint job. Kitchen will need updated; new cabinets, flooring and all new appliances. The boil
Key facts
- Built-in cabinets
- Detached pole barn
- All brick house
Tags
Property features AI
Exterior
- Parking: Detached garage with space for 4 cars (4 total parking spaces)
- Utilities: Public water; Public sewer
- Home design: Detached single-family home; 1.5-story design; Property over 100 years old
- Construction: Frame construction; Built before 1978
- Exterior features: Corner, level lot (100 x 100)
Interior
- Kitchen: Kitchen on main level (13 x 19) with vinyl flooring
- Bedrooms: 5 bedrooms total; Main-level master bedroom (12 x 13) with hardwood flooring; Second-level bedroom (13 x 18) with laminate flooring; Main-level bedroom (13 x 12) with hardwood flooring; Main-level bedroom (12 x 12) with hardwood flooring; Second-level bedroom (12 x 18) with laminate flooring
- Flooring: Hardwood flooring in multiple main-level rooms; Laminate flooring in some second-level bedrooms; Vinyl flooring in kitchen
- Bathrooms: 1 full bathroom
- Interior features: Full unfinished basement with egress window; Wood-burning fireplace
Neighborhood map
What this means for you Summary
Snapshot
- This is a 1-bed/1.0-bath single-family listed at $52k.
Deal economics
- At list price, monthly cash flow is $382 ($5k/yr) — positive.
- The deal already cash-flows at list — no discount required.
- Meets the 1% rule at list price ($942 rent vs $52k).
- Recommended offer: $48k (9.0% below list) — sets the bar for market timing.
- Cap rate 15.0% vs local median 6.2% in Murphysboro — top-decile yield for the area; either an underpriced asset or a hidden risk that comps aren't pricing in. Stress-test before assuming the spread holds.
Location & tenants
- Location reads 54/100 on livability (#1,265 in IL) — a working-class tenant base; expect higher turnover. Strengths: cost of living A+, housing A-; Watch: crime D-, amenities F, commute F.
- Murphysboro CUSD 186 (town): math 9% / reading 10% proficiency, ranked #585 of 620 in IL (top 94%) — low school quality limits family demand, transient renter base, plan for 1-2y turnover; 62% free/reduced lunch — lower-income household profile, screen leases tightly.
- Zoned schools: Murphysboro Middle School (math 4% / reading 6%, grade F, #636 of 665 statewide, top 98%, 444 students, 0% FRL); Murphysboro High School (math 17% / reading 17%, grade F, #430 of 693 statewide, top 66%, 598 students, 0% FRL) — zoned schools average 0% FRL vs 62% district-wide (62 pts lower); this property's tenant base skews higher-income than the district average.
- Market conditions: 79 active listings in the ZIP; 5 units permitted in Jackson County in 2024 (0 in 5+ unit buildings).
Forward outlook
- Local home prices are declining (-3.0%/yr); year-one equity from $363 of loan paydown is wiped out by about $2k of value loss. Plan a longer hold.
- At projected returns (-3.0% appreciation + 3.0% rent growth), your $15k cash investment doubles in ~4 years — after that, you're playing with house money.
Negotiation context
- It's been on market 118 days — a 9% lower offer ($48k) is reasonable based on typical stale-listing flexibility.
Risks & watch-outs
- Watch-outs: built in 1923 — expect roof / HVAC / electrical / plumbing capex.
- Climate carrying-cost: extreme-heat days projected 7→21/yr by 2055 (HVAC capex compounding) — expect insurance premiums to compound above CPI over the hold.
Questions for the listing agent
- It's been on market 118 days. Have you received any prior offers? Is the seller open to a 9% concession, seller financing, or rate buy-down credit?
- Built in 1923 — when were the roof, HVAC, electrical panel, plumbing, and water heater last replaced?
- Why hasn't it sold? Are there any deal-killer items the seller is aware of (foundation, flood, title, zoning, code violations)?
- Is there a deadline driving the sale (1031 exchange, divorce, estate, relocation)? That informs how much negotiation room exists.
- Schools are F-rated, which usually means shorter tenancies and higher turnover. Who's the typical renter profile here, and what's been the actual vacancy rate?
- Crime grade is D in this area — have there been break-ins, vandalism, or insurance claims at this property in the last 3 years? What carrier currently insures it and at what premium?
- What's the average days-on-market for RENTAL listings here right now (not sales)? A rising rental-DOM trend means longer vacancies and softer asking-rent achievability than the comps imply.
- What's the recent tenant-quality profile in this submarket — average credit score on applications, eviction rate, late-payment / NSF rate, and stable-employment percentage? A property-management company in the area should have these aggregated.
- How much new for-sale + rental construction is in the pipeline within 1–3 miles? Heavy new supply typically softens prices + rents 12–24 months out; constrained supply supports both.
Investment metrics
- 1% rule
- 1.80% ✓
- Cap rate
- 15.02%
- Cash-on-cash
- 31.16%
- DSCR
- 2.39
- GRM
- 4.6
CMA / ARV
- ARV (on-the-fly)
- $122,364
- Comps found
- 4
Show comp detail 4 sales within ~0.75 mi
| Address | Dist | Beds/Ba | Sqft | Sold | Price | $/sf | Match |
|---|---|---|---|---|---|---|---|
| 538 S 17th St | 0.62mi | 2/2.0 (+1) | 1,880 (+1%) | 2mo | $99,400 | $53 | 58 |
| 707 Illinois Ave | 0.71mi | 2/2.0 (+1) | 1,792 (-3%) | 11mo | $117,500 | $66 | 43 |
| 707 Illinois Ave | 0.71mi | 2/2.0 (+1) | 1,792 (-3%) | 11mo | $117,500 | $66 | 43 |
| 1517 Oak St | 0.54mi | 2/1.5 (+1) | 1,665 (-10%) | 13mo | $135,000 | $81 | 40 |
Match score weights: distance 35% · size 25% · config 20% · recency 20%. Top-matched comps best support the ARV.
Projected returns pro-forma
-3.0% appreciation · 3.0% rent growth · sell at horizon
- IRR
- 26.0%
- Equity multiple
- 2.08×
- Total profit
- $15,816
- Equity at exit
- $7,828
- IRR
- 33.7%
- Equity multiple
- 4.07×
- Total profit
- $45,132
- Equity at exit
- $4,539
Cash invested: $14,700 (down + closing). Projections, not guarantees.
Landlord ↔ Tenant lean methodology
- Overall (STATE)
- 43 Moderately Tenant-Leaning
- State Illinois
- 43 Moderately Tenant-Leaning · D+7
- County
- — inherits STATE
- City
- — inherits STATE
ZIP-level market 62966
- Active inventory
- 79
- Price-to-rent
- 4.6×
Monthly cashflow live
- Estimated rent
- $942 medium interval (Pro) →
- Mortgage (P&I)
- −$275
- Tax est. 1.5%
- −$66 /mo · $788/yr
- Insurance
- −$22
- HOA
- −$0
- Vacancy / Maint / Mgmt
- −$198
- Net cashflow
- $382
Break-even live
UW: 25.0% down · 7.5% · 30yr · 1.5% tax · 5.0% vac · 8.0% maint · 8.0% mgmt
Financing live
Cash to close
- Down payment
- $13,125
- Closing costs
- $1,575
- Reserves months
- —
- Total cash needed
- —
Loan-product check · same deal, 3 products live
Conventional
25% down · 7.5% · 30yr
- Down + closing
- —
- Monthly P&I
- —
- Monthly cashflow
- —
- DSCR
- —
- Eligible?
- —
Personal DTI + credit; lowest rate.
DSCR
20% down · 8.5% · 30yr
- Down + closing
- —
- Monthly P&I
- —
- Monthly cashflow
- —
- DSCR
- —
- Eligible?
- —
No personal income docs; deal must DSCR.
Hard money
10% down · 12.0% · 12mo
- Down + closing
- —
- Monthly P&I
- —
- Monthly cashflow
- —
- DSCR
- —
- Eligible?
- —
Short-term bridge; refi at stabilization.
Listing history 11 events
-
2026-05-23status Active
-
2026-05-23price $60,000
-
2026-04-23status Pending
-
2026-02-09status Active
-
2026-01-31historical
-
2026-01-08status Active
-
2026-01-06historical
-
2026-01-05historical
-
2025-10-05price
-
2025-08-26price
-
2025-07-23Active
ⓘ Source: listings_history table (triggers on properties + properties_extension) + one-shot
backfill from property_details.listing_events for pre-trigger history.
Climate risk First Street
- Flood 1/10 Low FEMA zone X (unshaded) · 0% chance over 30 yrs
- Wildfire 1/10 Low
- Heat 5/10 Major 7 d/yr ≥107°F today · 21 d/yr by 30 yrs out
- Wind 2/10 Low 2% chance of damaging wind over 30 yrs
- Air quality 1/10 Low 0 unhealthy d/yr today · 0 by 30 yrs out
Nearby sold comps map
Loading sold comps map…
Walkable amenities ~0.75 mi
Loading nearby amenities…
Taxation est. · year 1
- Rental income
- $11,309
- − Mortgage interest
- −$2,941
- − Property taxes
- −$788
- − Insurance
- −$262
- − Repairs & maintenance
- −$905
- − Management
- −$905
- − Depreciation
- −$1,527
- Taxable income
- $3,981
- Est. tax owed @ 24.0%
- −$955
- After-tax cash flow
- $3,625/yr
For passive investors: Depreciation is non-cash, so a rental often shows a tax loss while cash-flowing — sheltering income. Rental losses are passive: they offset passive income freely, and up to $25,000/yr can offset ordinary (W-2) income if you actively participate and your MAGI is under $100k (phasing out to $0 by $150k); unused losses carry forward. On sale, claimed depreciation is recaptured at up to 25%, and gains may owe capital-gains tax (a 1031 exchange can defer both). Figures are a year-1 estimate at your 24.0% rate — not tax advice; consult a CPA.
Schools (NCES district)
- District
- Murphysboro CUSD 186
- NCES district ID
- 1727610
- Math proficiency
- 9% ▼ -9.00%
- Reading proficiency
- 10% ▼ -8.00%
- Median HH income
- $36,963
- Composite
- 7.97/100
- National rank
- #9925
- State rank
- #585 of 620 in IL
Livability — Murphysboro
- Score
- 54/100
- State rank
- #1265
- US rank
- #23786
Category grades
Schools grade is shown separately in the Schools card above.
Census & demographics
- Census place
- Murphysboro, IL
- City population
- 13,995
- Population (ZIP)
- 13,995
Population outlook (Jackson County) Hauer SSP2
- Today (2025)
- 59,093 people
- By 2030
- 59,628 · +0.9%
- By 2040
- 59,495 · +0.7%
- By 2050
- 58,811 · -0.5%
- By 2075
- 57,683 · -2.4%
- By 2100
- 55,337 · -6.4%
Race, ethnicity, and origin ACS 2023
- Neighborhood character
- Predominantly White (77%)
- Race & ethnicity
- White 77% Hispanic / Latino 8% Black 8% Two or more races 6%
- Hispanic origin (detail)
- Mexican 3% Puerto Rican 1%
- Common ancestry
- Lithuanian 5% Slovak 3% Italian 2%
- Foreign-born
- 4% · Canada, South Korea
- Languages at home
- 91% English-only · Spanish 6% Russian/Polish/Slavic 1%
Political lean MEDSL · Jackson
- 2024 margin
- Toss-up / Even · D 51.0% · R 47.5% · Other 1.4%
- 2008→2024 swing
- -18.3pp toward R · 2008: 21.8pp · 2024: 3.5pp
- All cycles
- 2024: D+3.5 2020: D+1.3 2016: D+3.0 2012: D+10.3 2008: D+21.8
Not yet ingested
- Civics
- —
Market trends
- HPI YoY
- ▼ -76.39%
- Current HPI
- 95.9393
- Rent YoY
- —
- Metro
- —
- State GDP YoY
- ▲ 1.59%
- F500 in state
- 60
Industry mix (Fortune 500 HQ in IL)
| Industry | F500 HQs | Revenue |
|---|---|---|
| Insurance | 4 | $201B |
|
||
| Consumer Goods | 4 | $87B |
|
||
| Industrial Machinery | 3 | $64B |
|
||
| Healthcare | 2 | $55B |
|
||
| Retail / Pharmacy | 1 | $148B |
|
||
| Agriculture / Food | 1 | $86B |
|
||
Price history
11 events — show timeline
- 2026-05-23 Relisted — MRED as Distributed by MLS Grid
- 2026-05-23 Price Changed $60,000 MRED as Distributed by MLS Grid
- 2026-04-23 Pending — MRED as Distributed by MLS Grid
- 2026-02-09 Relisted — MRED as Distributed by MLS Grid
- 2026-01-31 Listing Removed — MRED as Distributed by MLS Grid
- 2026-01-08 Relisted — MRED as Distributed by MLS Grid
- 2026-01-06 Listing Removed — RMLSA as Distributed by MLS Grid
- 2026-01-05 Listing Removed — MRED as Distributed by MLS Grid
- 2025-10-05 Price Changed — RMLSA as Distributed by MLS Grid
- 2025-08-26 Price Changed — RMLSA as Distributed by MLS Grid
- 2025-07-23 Listed — RMLSA as Distributed by MLS Grid
Property tax history
+1.6%/yrLatest (2024): $3,475 · +8.5% YoY. Source: county tax records.
Cash-flow waterfall
monthlySold comps — $/sqft
last 12 mo · ≤1 miLoading sold comps…