 Multi-family
1602 87th Ave · Oakland, CA
Flood risk 1/10 · Minimal
- FEMA flood zone
- X (unshaded)
- Chance of flooding over 30 yrs
- 0.0%
- Est. flood insurance / yr
- $507 – $1,088
Fire risk 1/10 · Minimal
- Est. fire insurance / yr
- $659 – $1,223
Heat risk 4/10 · Minor
- Hot days now (above 84°F)
- 7 days/yr
- Hot days in 30 yrs
- 15 days/yr
Wind risk 1/10 · Minimal
- Chance of severe wind over 30 yrs
- —
Air-quality risk 8/10 · Major
- Unhealthy air days now
- 14 days/yr
- Unhealthy air days in 30 yrs
- 14 days/yr
Risk factors via First Street. Map © Google.
Why this score? — see what drove the D grade
The composite is a weighted blend of 9 inputs, each scored 0–100. Each bar is that input's sub-score; the figure is the points it added to the 100-point composite (weight × sub-score).
- ARV discount +15.0/15.0
- Cash flow +9.0/30.0
- Rent growth +4.1/5.0
- Livability +3.6/5.0
- 1% rule +3.0/10.0
- Schools +3.0/10.0
- DSCR +2.5/10.0
- Condition / age +2.5/5.0
- Appreciation +0.0/10.0
$597,000
🖨 Deal sheet 📄 Offer letter ✓ Due diligence
Multi-family units
County records classify this as Multi-Family (2-4 Unit). Listing-text estimate: 1 unit. estimate disagrees with records
Listing remarks
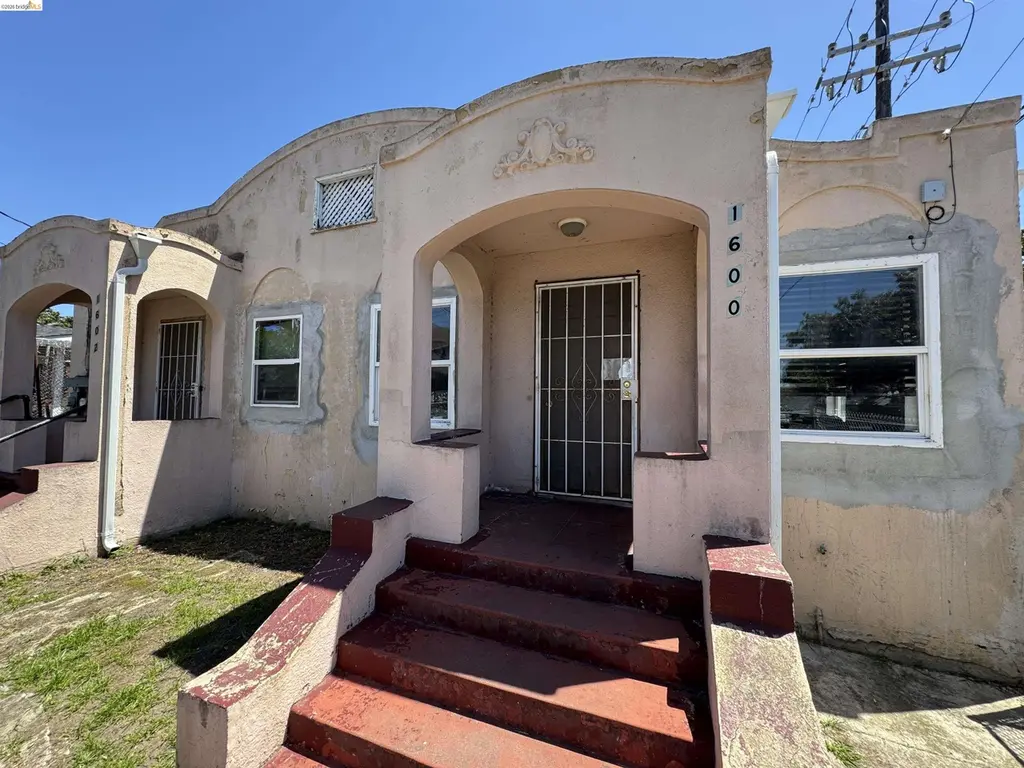
A classic 1930s duplex at 1600 & 1602 87th Ave, each unit a spacious 2-bed/1-bath, along with a detached 3-bed/2-bath single-family home at 8714 Holly St complete with its own garage. Situated on a corner parcel, the two duplex units can provide rental income, while the standalone home will be delivered vacant; making it an ideal owner-occupant opportunity or a value-add rental. The property benefits from important updates including newer windows and a newer roof, offering a strong foundation for further cosmetic upgrades needed. With fresh paint and finishing touches, there is significant upside potential in rents and overall property value.
Key facts
- Fresh paint
- Newer roof
- Newer windows
Tags
Property features AI
Exterior
- Parking: Detached garage with side yard access (1 parking space total)
- Utilities: Public water; Public sewer
- Home design: Triplex (residential income property); Built in 1930
- Construction: Stucco and wood siding exterior
- Exterior features: Chain link fencing; Corner lot; Two houses on one lot
Interior
- Bedrooms: Total of 3 units (see unit bathroom counts for layout details)
- Flooring: Engineered wood
- Bathrooms: Unit 1: 1 bathroom; Unit 2: 1 bathroom; Unit 3: 2 bathrooms
- Heating & cooling: Forced air heating; Ceiling fans for cooling
- Interior features: Engineered wood flooring; Partial unfinished basement with separate entry
Neighborhood map
What this means for you Summary
Snapshot
- This is a 4-bed/3.0-bath multifamily listed at $597k.
Deal economics
- At list price, monthly cash flow is $-471 ($-6k/yr) — negative.
- To cash-flow at today's rent, offer at most $514k (13.9% below list).
- To meet the 1% rule (rent ≥ 1% of price), the offer needs to be $480k (19.7% below list).
- Recommended offer: $480k (19.7% below list) — sets the bar for 1% rule.
- Cap rate 5.3% vs local median 2.4% in Oakland — top-decile yield for the area; either an underpriced asset or a hidden risk that comps aren't pricing in. Stress-test before assuming the spread holds.
Location & tenants
- Location reads 71/100 on livability (#224 in CA) — a middle-class / working-renter tenant base. Strengths: amenities A+, commute A+, employment A+; Watch: schools C-, crime F, cost of living F.
- Oakland Unified (urban): math 27% / reading 33% proficiency, ranked #1,007 of 1,400 in CA (top 72%) — families likely to look elsewhere, expect single-tenant / working-renter base with shorter leases; 68% free/reduced lunch — lower-income household profile, screen leases tightly.
- Market conditions: Rents rising fast (+6.5%/yr); 83 active listings in the ZIP; 4 comparable units currently listed for rent nearby; rentals lingering (median 44d on market — plan ~5-8 weeks vacancy on turnover, expect pricing pressure); 75% of comp listings sitting > 30 days — soft ceiling on asking rent; 1,742 units permitted in Alameda County in 2024 (856 in 5+ unit buildings).
- At $4,796/mo this rent would consume 111% of the median local household income ($52k/yr) (locally 2404% of renters already pay >50% of income on rent) — very limited rent-growth headroom before tenants either downsize or default.
Forward outlook
- Local home prices are declining (-3.0%/yr); year-one equity from $4k of loan paydown is wiped out by about $18k of value loss. Plan a longer hold.
- Alameda County population projected at +34% by 2050 — long-run rental-demand tailwind backs the buy-and-hold thesis.
Negotiation context
- It's been on market 34 days — a 3% lower offer ($579k) is reasonable based on typical stale-listing flexibility.
- 4 sale attempts since 16y ago with the ask held roughly flat each time — persistent listings suggest the price (not the market) is what's stuck; bring a comps-based counter.
Risks & watch-outs
- Watch-outs: built in 1930 — expect roof / HVAC / electrical / plumbing capex.
Questions for the listing agent
- What do current leases actually rent for vs. the listed asking? Can we see a recent rent roll and the last 12 months of T-12 income?
- It's been on market 34 days. Have you received any prior offers? Is the seller open to a 20% concession, seller financing, or rate buy-down credit?
- Built in 1930 — when were the roof, HVAC, electrical panel, plumbing, and water heater last replaced?
- Is there a deadline driving the sale (1031 exchange, divorce, estate, relocation)? That informs how much negotiation room exists.
- Crime grade is F in this area — have there been break-ins, vandalism, or insurance claims at this property in the last 3 years? What carrier currently insures it and at what premium?
- The area grade is low — what's the realistic commute time and amenity access for the typical tenant pool here? Any planned neighborhood developments (good or bad) we should know about?
- What's the average days-on-market for RENTAL listings here right now (not sales)? A rising rental-DOM trend means longer vacancies and softer asking-rent achievability than the comps imply.
- What's the recent tenant-quality profile in this submarket — average credit score on applications, eviction rate, late-payment / NSF rate, and stable-employment percentage? A property-management company in the area should have these aggregated.
- How much new apartment / multifamily construction is in the pipeline within 1–3 miles? Heavy new supply (>2% of stock underway) typically softens rents 12–24 months out; light construction supports rent growth.
Investment metrics
- 1% rule
- 0.80% ✗
- Cap rate
- 5.35%
- Cash-on-cash
- -3.38%
- DSCR
- 0.85
- GRM
- 10.4
CMA / ARV
- ARV (median comp)
- $818,371
- List price
- $597,000
- Delta
- -27.05%
- Verdict
- UNDERPRICED
- Comps
- 20 within 1.0 mi
Show comp detail 1 sale within ~0.75 mi
| Address | Dist | Beds/Ba | Sqft | Sold | Price | $/sf | Match |
|---|---|---|---|---|---|---|---|
| 1468 84th Ave | 0.22mi | 5/3.0 (+1) | 2,103 (-9%) | 3mo | $400,000 | $190 | 68 |
Match score weights: distance 35% · size 25% · config 20% · recency 20%. Top-matched comps best support the ARV.
Projected returns pro-forma
-3.0% appreciation · 6.45% rent growth · sell at horizon
- IRR
- -18.0%
- Equity multiple
- 0.35×
- Total profit
- $-109,360
- Equity at exit
- $89,015
- IRR
- -4.5%
- Equity multiple
- 0.66×
- Total profit
- $-57,348
- Equity at exit
- $51,618
Cash invested: $167,160 (down + closing). Projections, not guarantees.
Landlord ↔ Tenant lean methodology
- Overall (CITY)
- 0 Strongly Tenant-Friendly
- State California
- 18 Strongly Tenant-Friendly · D+13
- County
- — inherits STATE
- City Oakland
- 0 Strongly Tenant-Friendly · D+62
ZIP-level market 94621
- Rents YoY
- 6.5%
- Active inventory
- 83
- Price-to-rent
- 20.7×
Monthly cashflow live
- Estimated rent
- $4,796 high interval (Pro) →
- Mortgage (P&I)
- −$3,131
- Tax from tax record
- −$880 /mo · $10,564/yr
- Insurance
- −$249
- HOA
- −$0
- Vacancy / Maint / Mgmt
- −$1,007
- Net cashflow
- $-471
Break-even live
2-unit breakdown (identical units grouped — click to expand)
| Units | Beds | Baths | Est. rent |
|---|---|---|---|
| 2× units | 2 | 1 | $4,796 |
| #1 | 2 | 1 | $2,398 |
| #2 | 2 | 1 | $2,398 |
| Total (2 units) | $4,796 | ||
UW: 25.0% down · 7.5% · 30yr · 1.5% tax · 5.0% vac · 8.0% maint · 8.0% mgmt
Financing live
Cash to close
- Down payment
- $149,250
- Closing costs
- $17,910
- Reserves months
- —
- Total cash needed
- —
Loan-product check · same deal, 3 products live
Conventional
25% down · 7.5% · 30yr
- Down + closing
- —
- Monthly P&I
- —
- Monthly cashflow
- —
- DSCR
- —
- Eligible?
- —
Personal DTI + credit; lowest rate.
DSCR
20% down · 8.5% · 30yr
- Down + closing
- —
- Monthly P&I
- —
- Monthly cashflow
- —
- DSCR
- —
- Eligible?
- —
No personal income docs; deal must DSCR.
Hard money
10% down · 12.0% · 12mo
- Down + closing
- —
- Monthly P&I
- —
- Monthly cashflow
- —
- DSCR
- —
- Eligible?
- —
Short-term bridge; refi at stabilization.
Rent comps 4 comps
| Address | Beds | Baths | Sqft | Rent | $/sqft | DOM | Units | Dist |
|---|---|---|---|---|---|---|---|---|
| 1724 96th Ave Oakland, CA | 4.0 | 2.0 | 1743 | $4,000 | $2.29 | 1d | 1 | 0.47mi |
| 1211 98th Ave Unit 1211 Oakland, CA | 4.0 | 2.0 | 1630 | $3,300 | $2.02 | 43d | 1 | 0.61mi |
| 7625 Lockwood St Oakland, CA | 5.0 | 3.0 | 2115 | $1,199 | $0.57 | 43d | 1 | 0.70mi |
| 2702 99th Ave Oakland, CA | 4.0 | 1.0 | 1750 | $4,200 | $2.40 | 43d | 1 | 1.17mi |
Listing history 23 events
-
2026-06-18days on market $597,000 Active 34 DOM
-
2026-06-17days on market $597,000 Active 33 DOM
-
2026-06-16days on market $597,000 Active 32 DOM
-
2026-06-15days on market $597,000 Active 31 DOM
-
2026-06-13days on market $597,000 Active 29 DOM
-
2026-06-13days on market $597,000 Active 28 DOM
-
2026-06-09days on market $597,000 Active 25 DOM
-
2026-06-08days on market $597,000 Active 24 DOM
-
2026-06-07days on market $597,000 Active 23 DOM
-
2026-06-04days on market $597,000 Active 20 DOM
-
2026-06-03days on market $597,000 Active 19 DOM
-
2026-06-02days on market $597,000 Active 18 DOM
-
2026-06-01days on market $597,000 Active 17 DOM
-
2026-05-31days on market $597,000 Active 16 DOM
-
2026-05-15$597,000 Active 658-char remark
-
2017-08-24historical
-
2015-02-01historical
-
2014-09-10New
-
2014-01-16historical
-
2011-08-08status Pending
-
2010-11-17New
-
2010-02-14historical
-
2010-01-18New
ⓘ Source: listings_history table (triggers on properties + properties_extension) + one-shot
backfill from property_details.listing_events for pre-trigger history.
Tax reassessment forecast CA · Resets to sale price
- Current annual tax
- $10,564 · $880/mo
- Projected year-2 tax
- $10,564 · $880/mo
- Expected delta
- $0/yr ($0/mo · 0.0%)
ⓘ Screening estimate from a state-policy table — verify with the county assessor before closing.
Climate risk First Street
- Flood 1/10 Low FEMA zone X (unshaded) · 0% chance over 30 yrs
- Wildfire 1/10 Low
- Heat 4/10 Moderate 7 d/yr ≥84°F today · 15 d/yr by 30 yrs out
- Wind 1/10 Low
- Air quality 8/10 Severe 14 unhealthy d/yr today · 14 by 30 yrs out
Nearby sold comps map
Loading sold comps map…
Walkable amenities ~0.75 mi
Loading nearby amenities…
Taxation est. · year 1
- Rental income
- $57,552
- − Mortgage interest
- −$33,441
- − Property taxes
- −$10,564
- − Insurance
- −$2,985
- − Repairs & maintenance
- −$4,604
- − Management
- −$4,604
- − Depreciation
- −$17,367
- Taxable loss
- −$16,014
- Est. tax savings @ 24.0%
- +$3,843
- After-tax cash flow
- $-1,809/yr
For passive investors: Depreciation is non-cash, so a rental often shows a tax loss while cash-flowing — sheltering income. Rental losses are passive: they offset passive income freely, and up to $25,000/yr can offset ordinary (W-2) income if you actively participate and your MAGI is under $100k (phasing out to $0 by $150k); unused losses carry forward. On sale, claimed depreciation is recaptured at up to 25%, and gains may owe capital-gains tax (a 1031 exchange can defer both). Figures are a year-1 estimate at your 24.0% rate — not tax advice; consult a CPA.
Schools (NCES district)
- District
- Oakland Unified
- NCES district ID
- 0628050
- Math proficiency
- 27% ▬ 0.00%
- Reading proficiency
- 33% ▬ 0.00%
- Median HH income
- $55,194
- Composite
- 29.52/100
- National rank
- #11769
- State rank
- #1007 of 1400 in CA
Livability — Oakland
- Score
- 71/100
- State rank
- #224
- US rank
- #7245
Category grades
Schools grade is shown separately in the Schools card above.
Census & demographics
- Census place
- Oakland, CA
- County
- Alameda County · 1,614,355 people
- City population
- 385,993
- Metro
- San Francisco-Oakland-Berkeley, CA
- Population (ZIP)
- 33,840
- Household income
- $52,049
- Rent vs Own
- Severe rent burden
- 2404.0
Population outlook (Alameda County) Hauer SSP2
- Today (2025)
- 1,928,884 people
- By 2030
- 2,069,146 · +7.3%
- By 2040
- 2,338,405 · +21.2%
- By 2050
- 2,586,608 · +34.1%
- By 2075
- 3,061,911 · +58.7%
- By 2100
- 3,234,133 · +67.7%
Race, ethnicity, and origin ACS 2023
- Neighborhood character
- Majority Hispanic (63%)
- Race & ethnicity
- Hispanic / Latino 63% Black 24% Two or more races 14% White 6% Asian 4% Native American 2%
- Hispanic origin (detail)
- Mexican 41%
- Common ancestry
- Italian 1%
- Foreign-born
- 35% · Canada, China, Vietnam
- Languages at home
- 40% English-only · Spanish 53% Arabic 2% Other Asian/Pacific 2%
Political lean MEDSL · Alameda
- 2024 margin
- Solid D (+53.6) · D 74.6% · R 21.0% · Other 4.4%
- 2008→2024 swing
- -5.9pp toward R · 2008: 59.5pp · 2024: 53.6pp
- All cycles
- 2024: D+53.6 2020: D+62.5 2016: D+64.4 2012: D+59.8 2008: D+59.5
Not yet ingested
- Civics
- —
Market trends
- HPI YoY
- ▼ -346.43%
- Current HPI
- 523.2253
- Rent YoY
- ▲ 6.45%
- Metro
- San Francisco-Oakland-Berkeley, CA
- State GDP YoY
- ▲ 3.21%
- F500 in state
- 116
Industry mix (Fortune 500 HQ in CA)
| Industry | F500 HQs | Revenue |
|---|---|---|
| Technology | 27 | $1,492B |
|
||
| Financial Services | 3 | $174B |
|
||
| Retail | 3 | $44B |
|
||
| Insurance | 3 | $26B |
|
||
| Media / Entertainment | 2 | $115B |
|
||
| Pharmaceuticals / Biotech | 2 | $62B |
|
||
Price history
9 events — show timeline
- 2026-05-15 Listed $597,000 bridgeMLS, Bay East AOR, or Contra Costa AOR
- 2017-08-24 Listing Removed — bridgeMLS, Bay East AOR, or Contra Costa AOR
- 2015-02-01 Listing Removed — bridgeMLS, Bay East AOR, or Contra Costa AOR
- 2014-09-10 Listed — bridgeMLS, Bay East AOR, or Contra Costa AOR
- 2014-01-16 Listing Removed — bridgeMLS, Bay East AOR, or Contra Costa AOR
- 2011-08-08 Pending — bridgeMLS, Bay East AOR, or Contra Costa AOR
- 2010-11-17 Listed — bridgeMLS, Bay East AOR, or Contra Costa AOR
- 2010-02-14 Listing Removed — bridgeMLS, Bay East AOR, or Contra Costa AOR
- 2010-01-18 Listed — bridgeMLS, Bay East AOR, or Contra Costa AOR
Property tax history
+4.8%/yrLatest (2025): $10,564 · +17.5% YoY. Source: county tax records.
Cash-flow waterfall
monthlySold comps — $/sqft
last 12 mo · ≤1 miLoading sold comps…