 Duplex
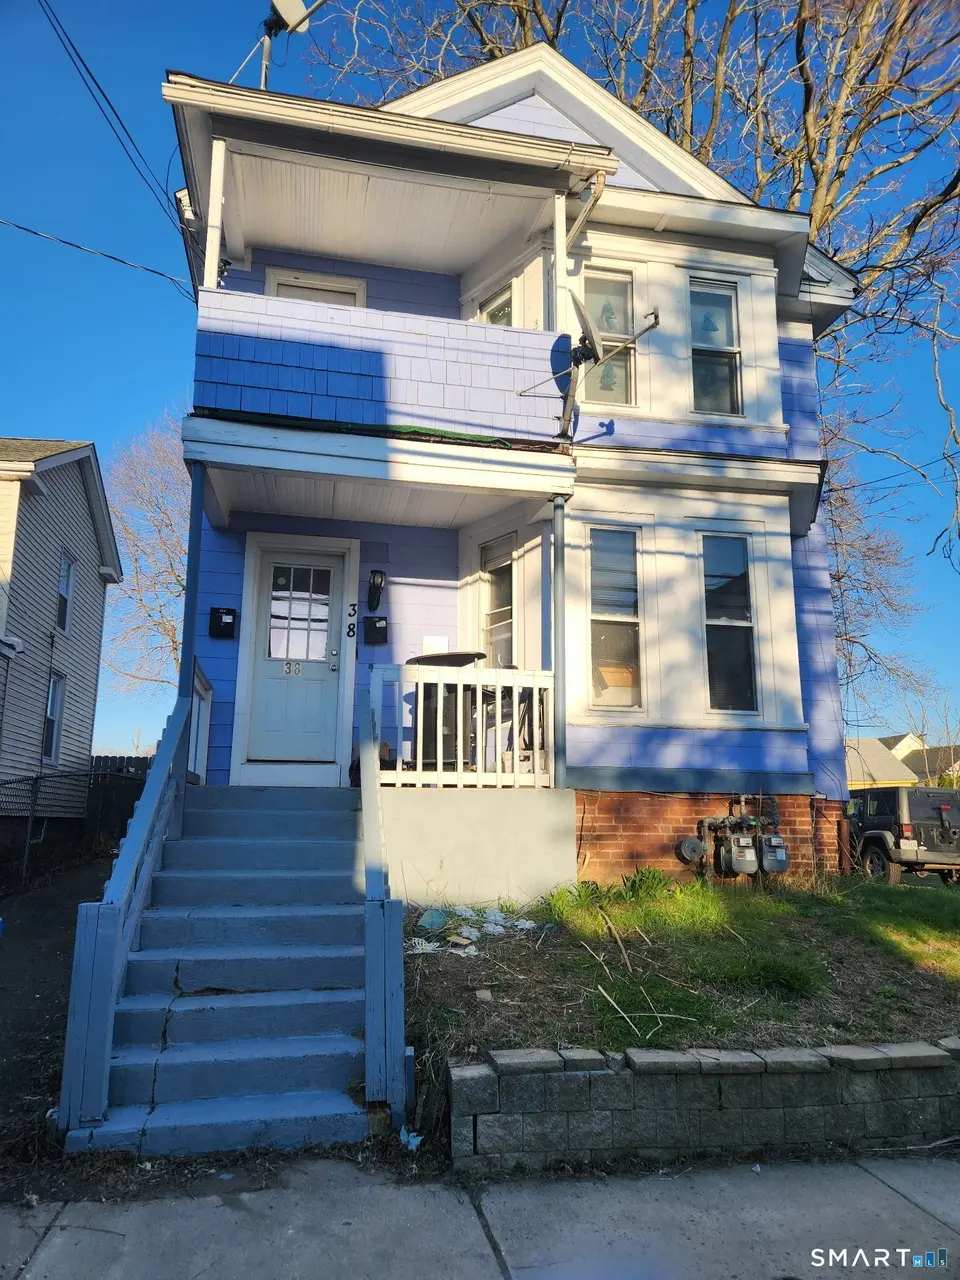
38 Church St · Enfield, CT
Flood risk 1/10 · Minimal
- FEMA flood zone
- X (unshaded)
- Chance of flooding over 30 yrs
- 0.0%
- Est. flood insurance / yr
- $473 – $860
Fire risk 3/10 · Minor
- Est. fire insurance / yr
- $829 – $1,539
Heat risk 5/10 · Moderate
- Hot days now (above 99°F)
- 7 days/yr
- Hot days in 30 yrs
- 15 days/yr
Wind risk 6/10 · Moderate
- Chance of severe wind over 30 yrs
- 27.0%
Air-quality risk 3/10 · Minor
- Unhealthy air days now
- 2 days/yr
- Unhealthy air days in 30 yrs
- 3 days/yr
Risk factors via First Street. Map © Google.
Why this score? — see what drove the B grade
The composite is a weighted blend of 9 inputs, each scored 0–100. Each bar is that input's sub-score; the figure is the points it added to the 100-point composite (weight × sub-score).
- Cash flow +29.8/30.0
- ARV discount +15.0/15.0
- DSCR +10.0/10.0
- 1% rule +8.2/10.0
- Rent growth +3.5/5.0
- Schools +3.0/10.0
- Livability +2.5/5.0
- Condition / age +2.5/5.0
- Appreciation +0.0/10.0
$304,900
🖨 Deal sheet 📄 Offer letter ✓ Due diligence
Multi-family units
County records classify this as Multi-Family (2-4 Unit). Listing-text estimate: 2 units. confirmed
Listing remarks MLS
Fantastic investment opportunity in the heart of Enfield! This well-maintained two-family home features spacious layouts and strong rental potential. The first-floor unit offers 2 bedrooms, 1 bath, eat-in kitchen, while the second-floor unit boasts of 3 bedrooms, 1 bath, ample living space with includes finished attic space. Both units have separate utilities for convenience. Enjoy off-street parking and a private backyard perfect for tenants or family gatherings. Ideally located close to schools, shopping, and public transportation, this property provides steady income potential. Don't miss this opportunity to own a versatile, income-generating property!
Key facts
- Spacious layouts
- Separate utilities
- Finished attic space
Tags
Neighborhood map
What this means for you Summary
Snapshot
- This is a 1×2bd/1ba + 1×3bd/1ba units multifamily listed at $305k.
Deal economics
- At list price, monthly cash flow is $1k ($13k/yr) — positive. Per door: $559/mo.
- The deal already cash-flows at list — no discount required.
- Meets the 1% rule at list price ($4k rent vs $305k).
- Recommended offer: $287k (6.0% below list) — sets the bar for market timing.
Location & tenants
- Location reads: area grade B — affects rentability + tenant quality, not the cash-flow math above.
- Enfield School District (suburban): math 25% / reading 41% proficiency, ranked #114 of 153 in CT (top 74%) — families likely to look elsewhere, expect single-tenant / working-renter base with shorter leases.
- Market conditions: Rents rising (+3.9%/yr); 182 active listings in the ZIP; 6 comparable units currently listed for rent nearby; rentals lingering (median 44d on market — plan ~5-8 weeks vacancy on turnover, expect pricing pressure); 67% of comp listings sitting > 30 days — soft ceiling on asking rent; solid renter incomes; 1,867 units permitted in Capitol Planning Region in 2024 (1,399 in 5+ unit buildings).
- At $4,020/mo this rent would consume 53% of the median local household income ($90k/yr) (locally 954% of renters already pay >50% of income on rent) — very limited rent-growth headroom before tenants either downsize or default.
Forward outlook
- Local home prices are declining (-3.0%/yr); year-one equity from $2k of loan paydown is wiped out by about $9k of value loss. Plan a longer hold.
- At projected returns (-3.0% appreciation + 3.9% rent growth), your $85k cash investment doubles in ~8 years — after that, you're playing with house money.
Negotiation context
- It's been on market 70 days — a 6% lower offer ($287k) is reasonable based on typical stale-listing flexibility.
- 13 sale attempts since 21y ago with the ask held roughly flat each time — persistent listings suggest the price (not the market) is what's stuck; bring a comps-based counter.
- Current owner paid $42k; list at $305k implies a 626% gain — meaningful room to come down on a strong offer.
Risks & watch-outs
- Watch-outs: built in 1900 — expect roof / HVAC / electrical / plumbing capex.
- Climate carrying-cost: major wind risk, 27% chance of damaging wind over 30y; extreme-heat days projected 7→15/yr by 2055 (HVAC capex compounding) — expect insurance premiums to compound above CPI over the hold.
Questions for the listing agent
- It's been on market 70 days. Have you received any prior offers? Is the seller open to a 6% concession, seller financing, or rate buy-down credit?
- Can we see the unit-by-unit rent roll, current vacancy, and any below-market leases? What's the average tenancy length?
- What capital expenditures (roof, boiler, parking lot, exteriors) have been made in the last 5 years, and what's planned in the next 2?
- Built in 1900 — when were the roof, HVAC, electrical panel, plumbing, and water heater last replaced?
- Why hasn't it sold? Are there any deal-killer items the seller is aware of (foundation, flood, title, zoning, code violations)?
- Is there a deadline driving the sale (1031 exchange, divorce, estate, relocation)? That informs how much negotiation room exists.
- What's the average days-on-market for RENTAL listings here right now (not sales)? A rising rental-DOM trend means longer vacancies and softer asking-rent achievability than the comps imply.
- What's the recent tenant-quality profile in this submarket — average credit score on applications, eviction rate, late-payment / NSF rate, and stable-employment percentage? A property-management company in the area should have these aggregated.
- How much new apartment / multifamily construction is in the pipeline within 1–3 miles? Heavy new supply (>2% of stock underway) typically softens rents 12–24 months out; light construction supports rent growth.
Investment metrics
- 1% rule
- 1.32% ✓
- Cap rate
- 10.70%
- Cash-on-cash
- 15.73%
- DSCR
- 1.70
- GRM
- 6.3
CMA / ARV
- ARV (median comp)
- $384,086
- List price
- $304,900
- Delta
- -20.62%
- Verdict
- UNDERPRICED
- Comps
- 20 within 1.0 mi
Show comp detail 11 sales within ~0.75 mi
| Address | Dist | Beds/Ba | Sqft | Sold | Price | $/sf | Match |
|---|---|---|---|---|---|---|---|
| 88 High St | 0.31mi | 4/2.0 | 2,153 (+6%) | 5mo | $275,000 | $128 | 72 |
| 55 Highland Park | 0.58mi | 5/2.0 (+1) | 2,100 (+3%) | 2mo | $395,000 | $188 | 61 |
| 33 Alden Ave | 0.13mi | 4/2.0 | 2,217 (+9%) | 24mo | $350,000 | $158 | 60 |
| 820 Burbank Ave | 0.71mi | 4/2.0 | 2,106 (+3%) | 9mo | $400,000 | $190 | 54 |
| 54 Elm St | 0.54mi | 4/2.0 | 1,960 (-4%) | 19mo | $302,000 | $154 | 52 |
| 704 Enfield St | 0.43mi | 5/2.0 (+1) | 2,178 (+7%) | 16mo | $380,000 | $174 | 50 |
| 18 Woodworth St | 0.57mi | 5/3.0 (+1) | 1,920 (-6%) | 10mo | $390,000 | $203 | 46 |
| 119 Pearl St | 0.46mi | 4/2.0 | 2,231 (+9%) | 23mo | $300,000 | $134 | 44 |
| 71 Park Ave | 0.54mi | 5/2.0 (+1) | 2,280 (+12%) | 8mo | $425,000 | $186 | 44 |
| 3 South St | 0.43mi | 5/2.0 (+1) | 2,240 (+10%) | 20mo | $325,000 | $145 | 42 |
| 24 Ohear Ave | 0.67mi | 5/3.5 (+1) | 2,296 (+12%) | 2mo | $425,000 | $185 | 36 |
Match score weights: distance 35% · size 25% · config 20% · recency 20%. Top-matched comps best support the ARV.
Projected returns pro-forma
-3.0% appreciation · 3.9% rent growth · sell at horizon
- IRR
- 7.6%
- Equity multiple
- 1.30×
- Total profit
- $25,555
- Equity at exit
- $45,462
- IRR
- 17.6%
- Equity multiple
- 2.52×
- Total profit
- $129,481
- Equity at exit
- $26,362
Cash invested: $85,372 (down + closing). Projections, not guarantees.
Landlord ↔ Tenant lean methodology
- Overall (STATE)
- 27 Tenant-Leaning
- State Connecticut
- 27 Tenant-Leaning · D+7
- County
- — inherits STATE
- City
- — inherits STATE
ZIP-level market 06082
- Rents YoY
- 3.9%
- Active inventory
- 182
- Price-to-rent
- 13.4×
Monthly cashflow live
- Estimated rent
- $4,020 high interval (Pro) →
- Mortgage (P&I)
- −$1,599
- Tax from tax record
- −$331 /mo · $3,972/yr
- Insurance
- −$127
- HOA
- −$0
- Vacancy / Maint / Mgmt
- −$844
- Net cashflow
- $1,119
Break-even live
2-unit breakdown (identical units grouped — click to expand)
| Units | Beds | Baths | Est. rent |
|---|---|---|---|
| 1× unit | 2 | 1 | $1,890 |
| 1× unit | 3 | 1 | $2,131 |
| Total (2 units) | $4,020 | ||
UW: 25.0% down · 7.5% · 30yr · 1.5% tax · 5.0% vac · 8.0% maint · 8.0% mgmt
Financing live
Cash to close
- Down payment
- $76,225
- Closing costs
- $9,147
- Reserves months
- —
- Total cash needed
- —
Loan-product check · same deal, 3 products live
Conventional
25% down · 7.5% · 30yr
- Down + closing
- —
- Monthly P&I
- —
- Monthly cashflow
- —
- DSCR
- —
- Eligible?
- —
Personal DTI + credit; lowest rate.
DSCR
20% down · 8.5% · 30yr
- Down + closing
- —
- Monthly P&I
- —
- Monthly cashflow
- —
- DSCR
- —
- Eligible?
- —
No personal income docs; deal must DSCR.
Hard money
10% down · 12.0% · 12mo
- Down + closing
- —
- Monthly P&I
- —
- Monthly cashflow
- —
- DSCR
- —
- Eligible?
- —
Short-term bridge; refi at stabilization.
Rent comps 6 comps
| Address | Beds | Baths | Sqft | Rent | $/sqft | DOM | Units | Dist |
|---|---|---|---|---|---|---|---|---|
| 42 Hartford Ave Enfield, CT | 4.0 | 1.0 | 1538 | $2,400 | $1.56 | 43d | 1 | 0.31mi |
| 54 Prospect St Enfield, CT | 4.0 | 2.0 | 2016 | $3,200 | $1.59 | 1d | 1 | 0.36mi |
| 36B Maple Ave Enfield, CT | 3.0 | 1.5 | 1800 | $1,775 | $0.99 | 43d | 1 | 0.55mi |
| 37 Shad Row #37 Suffield, CT | 3.0 | 2.5 | 2000 | $2,700 | $1.35 | 1d | 1 | 0.87mi |
| 44 Saint James Ave Enfield, CT | 3.0 | 2.0 | 1500 | $2,700 | $1.80 | 43d | 1 | 1.10mi |
| 8 Catherine Ln Suffield, CT | 3.0 | 2.0 | 1486 | $3,500 | $2.36 | 43d | 1 | 1.23mi |
Listing history 45 events
-
2026-06-18days on market $304,900 Active 70 DOM
-
2026-06-17days on market $304,900 Active 69 DOM
-
2026-06-16days on market $304,900 Active 68 DOM
-
2026-06-15days on market $304,900 Active 67 DOM
-
2026-06-13days on market $304,900 Active 65 DOM
-
2026-06-10days on market $304,900 Active 62 DOM
-
2026-06-09days on market $304,900 Active 61 DOM
-
2026-06-08pricedays on market $304,900 Active 60 DOM
-
2026-06-07days on market $314,900 Active 59 DOM
-
2026-06-05days on market $314,900 Active 56 DOM
-
2026-06-03days on market $314,900 Active 55 DOM
-
2026-06-02days on market $314,900 Active 54 DOM
-
2026-06-01days on market $314,900 Active 53 DOM
-
2026-05-31days on market $314,900 Active 52 DOM
-
2026-04-09$314,900 Active 663-char remark
Show marketing remark (663 chars)
Fantastic investment opportunity in the heart of Enfield! This well-maintained two-family home features spacious layouts and strong rental potential. The first-floor unit offers 2 bedrooms, 1 bath, eat-in kitchen, while the second-floor unit boasts of 3 bedrooms, 1 bath, ample living space with includes finished attic space. Both units have separate utilities for convenience. Enjoy off-street parking and a private backyard perfect for tenants or family gatherings. Ideally located close to schools, shopping, and public transportation, this property provides steady income potential. Don't miss this opportunity to own a versatile, income-generating property!
-
2010-09-16soldstatus $42,000 41-char remark
Show marketing remark (41 chars)
Bank owned two family with walk up attic.
-
2010-07-19$44,500 41-char remark
Show marketing remark (41 chars)
Bank owned two family with walk up attic.
-
2010-07-17historical
-
2010-06-03$50,000
-
2010-05-30historical
-
2010-05-05$53,250
-
2010-05-01historical
-
2010-03-01historical
-
2010-02-27$57,500
-
2010-02-20$64,900
-
2010-02-09historical
-
2009-12-03historical
-
2009-11-09$74,900
-
2009-08-03$109,900
-
2008-06-11historical
-
2008-04-03historical
-
2008-01-11$190,000
-
2007-09-19historical
-
2007-09-14$179,900
-
2007-09-12$179,900
-
2007-09-11historical
-
2007-05-11$184,000
-
2006-08-21soldstatus $190,000
-
2006-08-21soldstatus $190,000
-
2005-09-30soldstatus $172,300
-
2005-09-30soldstatus $172,300
-
2005-09-29soldstatus $172,300
-
2005-04-22$175,000
-
2000-10-19soldstatus $75,000
-
1986-04-24soldstatus $87,900
ⓘ Source: listings_history table (triggers on properties + properties_extension) + one-shot
backfill from property_details.listing_events for pre-trigger history.
Tax reassessment forecast CT · Partial reset (capped growth)
- Current annual tax
- $3,972 · $331/mo
- Projected year-2 tax
- $5,248 · $437/mo
- Expected delta
- +$1,276/yr (+$106/mo · 32.1%)
ⓘ Screening estimate from a state-policy table — verify with the county assessor before closing.
Climate risk First Street
- Flood 1/10 Low FEMA zone X (unshaded) · 0% chance over 30 yrs
- Wildfire 3/10 Moderate
- Heat 5/10 Major 7 d/yr ≥99°F today · 15 d/yr by 30 yrs out
- Wind 6/10 Major 27% chance of damaging wind over 30 yrs
- Air quality 3/10 Moderate 2 unhealthy d/yr today · 3 by 30 yrs out
Nearby sold comps map
Loading sold comps map…
Walkable amenities ~0.75 mi
Loading nearby amenities…
Taxation est. · year 1
- Rental income
- $48,240
- − Mortgage interest
- −$17,079
- − Property taxes
- −$3,972
- − Insurance
- −$1,524
- − Repairs & maintenance
- −$3,859
- − Management
- −$3,859
- − Depreciation
- −$8,870
- Taxable income
- $9,076
- Est. tax owed @ 24.0%
- −$2,178
- After-tax cash flow
- $11,248/yr
For passive investors: Depreciation is non-cash, so a rental often shows a tax loss while cash-flowing — sheltering income. Rental losses are passive: they offset passive income freely, and up to $25,000/yr can offset ordinary (W-2) income if you actively participate and your MAGI is under $100k (phasing out to $0 by $150k); unused losses carry forward. On sale, claimed depreciation is recaptured at up to 25%, and gains may owe capital-gains tax (a 1031 exchange can defer both). Figures are a year-1 estimate at your 24.0% rate — not tax advice; consult a CPA.
Schools (NCES district)
- District
- Enfield School District
- NCES district ID
- 0901470
- Math proficiency
- 25% ▼ -14.00%
- Reading proficiency
- 41% ▼ -10.00%
- Median HH income
- $68,750
- Composite
- 30.42/100
- National rank
- #6238
- State rank
- #114 of 153 in CT
Livability — Enfield
No livability data for this city. (Only ~50 U.S. cities are tracked.)
Census & demographics
- Census place
- Thompsonville, CT
- County
- Hartford County · 754,208 people
- City population
- 41,090
- Metro
- Hartford-East Hartford-Middletown, CT
- Population (ZIP)
- 41,090
- Household income
- $90,404
- Rent vs Own
- Severe rent burden
- 954.0
Population outlook (Capitol County) Hauer SSP2
- By 2040
- 1,063,519
Race, ethnicity, and origin ACS 2023
- Neighborhood character
- Predominantly White (76%)
- Race & ethnicity
- White 76% Hispanic / Latino 11% Two or more races 9% Black 5% Asian 2%
- Hispanic origin (detail)
- Mexican 1% Puerto Rican 7%
- Common ancestry
- Romanian 10% Lithuanian 9% Slovak 2%
- Foreign-born
- 6% · Canada, Jamaica
- Languages at home
- 89% English-only · Spanish 5% Other Indo-European 2% Russian/Polish/Slavic 1%
Political lean MEDSL · Capitol
- 2024 margin
- Strong D (+21.9) · D 60.1% · R 38.2% · Other 1.7%
- All cycles
- 2024: D+21.9
Not yet ingested
- Civics
- —
Market trends
- HPI YoY
- ▼ -494.72%
- Current HPI
- 192.4011
- Rent YoY
- ▲ 3.90%
- Metro
- Hartford-East Hartford-Middletown, CT
- State GDP YoY
- ▲ 1.06%
- F500 in state
- 38
Industry mix (Fortune 500 HQ in CT)
| Industry | F500 HQs | Revenue |
|---|---|---|
| Industrial Machinery | 4 | $38B |
|
||
| Insurance | 3 | $71B |
|
||
| Financial Services | 2 | $25B |
|
||
| Transportation / Logistics | 2 | $18B |
|
||
| Healthcare | 1 | $247B |
|
||
| Telecommunications | 1 | $55B |
|
||
Price history
+258.2% since first listed31 events — show timeline
- 2026-04-09 Listed $314,900 Smart MLS
- 2010-09-16 Sold (MLS) $42,000 Smart MLS
- 2010-07-19 Listed $44,500 Smart MLS
- 2010-07-17 Listing Removed — Smart MLS
- 2010-06-03 Listed $50,000 Smart MLS
- 2010-05-30 Listing Removed — Smart MLS
- 2010-05-05 Listed $53,250 Smart MLS
- 2010-05-01 Listing Removed — Smart MLS
- 2010-03-01 Listing Removed — Smart MLS
- 2010-02-27 Listed $57,500 Smart MLS
- 2010-02-20 Listed $64,900 Smart MLS
- 2010-02-09 Listing Removed — Smart MLS
- 2009-12-03 Listing Removed — Smart MLS
- 2009-11-09 Listed $74,900 Smart MLS
- 2009-08-03 Listed $109,900 Smart MLS
- 2008-06-11 Listing Removed — Smart MLS
- 2008-04-03 Listing Removed — Smart MLS
- 2008-01-11 Listed $190,000 Smart MLS
- 2007-09-19 Listing Removed — Smart MLS
- 2007-09-14 Listed $179,900 Smart MLS
- 2007-09-12 Listed $179,900 Smart MLS
- 2007-09-11 Listing Removed — Smart MLS
- 2007-05-11 Listed $184,000 Smart MLS
- 2006-08-21 Sold (Public Records) $190,000 Public Records
- 2006-08-21 Sold (Public Records) $190,000 Public Records
- 2005-09-30 Sold (Public Records) $172,300 Public Records
- 2005-09-30 Sold (Public Records) $172,300 Public Records
- 2005-09-29 Sold (MLS) $172,300 Smart MLS
- 2005-04-22 Listed $175,000 Smart MLS
- 2000-10-19 Sold (Public Records) $75,000 Public Records
- 1986-04-24 Sold (Public Records) $87,900 Public Records
Property tax history
+0.8%/yrLatest (2025): $3,972 · +2.7% YoY. Source: county tax records.
Cash-flow waterfall
monthlySold comps — $/sqft
last 12 mo · ≤1 miLoading sold comps…